disaster risks in mega-cities, Eds., S. Ikeda, T. Fukuzono, and T. Sato, pp. 57–87. c
TERRAPUB and NIED, 2006.
Public Preference and Willingness to Pay for Flood
Risk Reduction
Guofang Zhai
1 Introduction
Floods are one of the oldest, most frequent, and most severe natural disas-ters to which human beings are exposed. In Japan, floodplains hold about 49% of the population and 75% of property, and flooding is a serious natural haz-ard. The need to reduce flood risk by applying not only “hard” measures, such as dams and levees, but also “soft” ones, such as early-warning systems and measures to heighten awareness of flood risk, is thus widely accepted. Un-fortunately, the severe economic recession in Japan and public concern with the need to preserve the environment have recently put a brake on investment in large-scale public works, including flood prevention schemes such as dikes and dams.
In these early years of the 21st century, floods have occurred frequently in Japan, causing disastrous loss of life and property. The Tokai Flood in 2000 caused damage amounting to 978.3 billion yen, with 10 dead and 115 injured. The Niigata-Fukushima Flood on July 13, 2004, left 16 people dead or missing, 22 buildings destroyed, 156 severely damaged, 85 partially dam-aged, 4,022 inundated above ground, and 22,620 inundated below ground. The frequency of flooding provides adequate evidence to support advocates of large-scale flood disaster prevention schemes.
Zhaiet al.(2003) conducted an efficiency analysis of Japanese flood pre-vention investment vs. total flood losses including death, injuries, and intangi-ble effects and showed that, since the 1980s, investment has changed from an efficient mode to an inefficient one in terms of both the economic standpoint and total savings on flood losses, including loss of life, with the ratio of total benefits to total costs, elasticity, and the marginal rate of substitution for flood loss decreasing in relation to investment in flood prevention.
The objective of this paper is to answer important five questions by con-ducting a survey in the Toki-Shonai River region of Central Japan: What are the main public preferences regarding river management in Japan? What is the public flood risk acceptability? What is the willingness to pay (WTP) for flood risk reduction? What are the relationships among the attributes of flood
58 G. Zhai
risk reduction like economic damage reduction, human loss reduction, and environmental protection?
2 Theoretical Framework for Estimating WTP
Water quality, river landscaping, flood control, and similar issues have no market price tag. These are called non-market goods in economics. Infor-mation obtained by assessing the public’s interest in, and willingness to pay for flood control and ecological restoration is critical for municipal planners and policy-makers who desire to vote on legislation according to their con-stituents’ wishes. The numerous techniques available for estimating WTP can be broadly divided into two categories: revealed preference and stated prefer-ence methods. The former, such as the travel-cost and hedonic price methods, determine the demand for goods or services by examining the purchase of related goods in the private market place, while the latter, such as the con-tingent valuation method and choice experiment techniques, measure demand by examining the individual’s stated preference for goods or services rela-tive to other goods and services. The choice of method for a study depends on several criteria, including the purpose of the study, availability of data, and particular economic values required (use and/or non-use values). For ex-ample, the revealed preference method is still generally preferred for certain types of non-market goods like recreational fishing, while the stated prefer-ence method is applied to other types of non-market goods such as estimat-ing discount rates in developestimat-ing countries (Batemanet al., 2002). Shabman and Stephenson (1996) showed that the contingent valuation method (CVM) produces the smallest mean estimates, implying that CVM is the most con-servative estimation technique and is thus least likely to overestimate actual benefits based on the property damage avoided, hedonic price, and contingent valuation techniques for the same study area (Roanoke, Virginia, USA). As highlighted by Daun and Clark (2000), however, CVM has rarely been specif-ically applied to the estimation of flood control benefits (Thunberg, 1988; Shabman and Stephenson, 1996; Clarket al., 2002). On the other hand, the choice experiment approach has not been applied in the flood risk analysis as far as we know.
monetary benefits of non-market commodities like environmental resources. If respondents answer a CVM question, as assumed by economic theory, the elicited value corresponds to the economic value of the goods (resource) as measured by the Hicksian compensating surplus (Carson and Mitchell, 1989). The estimated value for a natural resource can then be used as an input to a cost-benefit analysis.
The choice experiment approach is based on the idea that any goods can be described in terms of its attributes, or characteristics, and their levels (Bate-man et al., 2002). For example, a bus service can be described in terms of its cost, timing, and comfort. Likewise, flood prevention measures can be described in terms of hard measures such as internal and external flooding measures, soft measures such as early warning systems, and concern about the environmental protection of rivers.
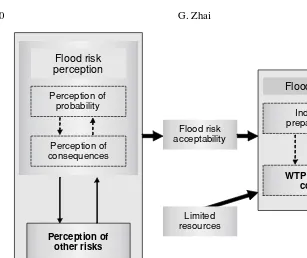
WTP for flood and environmental risk reduction may depend on factors such as risk perception, resource limitations, personality (individual charac-teristics), current risk levels, and acceptability of risks. Whether an individual acts or not depends on whether his utility reaches a maximum, which is strictly confined to the addressed factors. Figure 1 shows the theoretical framework used in this study for estimating WTP for flood risk reduction. The hypothesis for the theoretical framework was tested using CVM and the choice experi-ment approach.
3 Survey Design and Implementation
3.1 Survey area
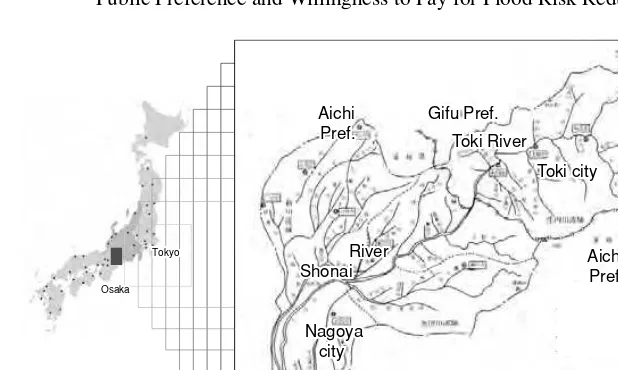
The survey area was the Shonai-Toki River basin in Central Japan (Fig. 2). The upper and the lower reaches are called the Toki River and Shonai River, respectively. The main stream is 96 km long. The basin has an area of 1,010 km2and is home to about 4 million residents. The upper reaches area is quite different from the lower one in terms of both natural environment (climate, geographical features) and socio-economic patterns (urbanization, population, and property accumulation). Therefore, the Kita ward of Nagoya City, Aichi Prefecture, in the lower reaches area, and Toki City, Gifu Prefecture, in the upper reaches area, were selected as survey areas to examine whether public preferences regarding flood control would differ with location.
60 G. Zhai
WTP for flood control Individual preparedness Flood risk
acceptability
Perception of other risks Perception of
probability
Perception of consequences
Flood risk perception
Limited resources
Flood control
Individual’s utility maximization
Fig. 1. Theoretical framework for analyzing WTP for flood control.
million residents. This storm, regarded as a “once in over 200 years” event, caused 10 deaths, serious injury to 20 people, and 978.3 billion in direct economic losses. It was one of the most serious flooding disasters in Japanese history according to Ministry of Land, Infrastructure, and Transport (MLIT) statistics.
3.2 Survey implementation
Shonai River
Toki River
Nagoya city
Toki city Gifu Pref.
Gifu Pref.
Aichi Pref. Aichi
Pref.
Tokyo Tokyo Osaka Osaka
N Shonai
River
Toki River
Nagoya city
Toki city Gifu Pref.
Gifu Pref.
Aichi Pref. Aichi
Pref.
Tokyo Osaka
N
15 km 0 5 10
Fig. 2. Location of survey area.
interviews, as proposed by Arrowet al.(1993).
The survey was conducted from the end of March to the beginning of April, 2004, before the start of the rainy season (June to September). The survey followed the Total Survey Design Method (TSD), which attempts to achieve an optimum balance across all effort areas. TSD was developed by Mangione (1995) and has been successful in securing high response rates from general and special samples. The survey procedure was as follows.
First, brief descriptions of flooding, the current status of flood control measures, and methods of preventing flooding were presented. In particular, for ease of understanding, illustrations were used to present the relationship between property damage and flood inundation, and to describe external flood control measures, internal flood control measures, and early-warning systems. To provide respondents with a further incentive to answer the questionnaire beyond involving them in cooperative thinking on measures for flood risk re-duction, they were asked to write their name and address on the questionnaire if they wanted a summary of the survey report.
Second, in addition to thorough discussion of the questionnaire draft with-in the project team, six people were asked to formally pre-test the question-naires. Based on the information returned, the questionnaire was revised.
62 G. Zhai
a packet of flower seeds as a small gift were also enclosed. The covering letter was signed by the Project Director. The 500 households were randomly cho-sen from a commercial phone directory database, Kurofune 2004 (Datascape & Communications Inc., 2004) for Toki City in the Gifu prefecture, and the Kita ward, Nagoya City in the Aichi prefecture. In all cases, the replies to the surveys were anonymous except that respondents gave their name and address if they wanted a summary of the survey report.
Fourth, a reminder postcard was sent to all recipients of the sample ap-proximately two weeks after the initial mailing. The postcard thanked those who had already responded and requested a response from those who had not yet responded. Fifth, a new covering letter, also signed by the Project Direc-tor, a questionnaire, stamped addressed envelope, and packet of flower seeds were sent to those who said they had not received the questionnaire and would like to respond. As a result, of a total of 962 surveys that were validly dis-tributed (479 in Kita ward, Nagoya City and 483 in Toki City, respectively), questionnaires from 428 households (201 from Kita ward and 227 from Toki City) were received by mail, for a response rate of 44.5%. Finally, a summary of the survey report, with a letter of thanks signed by the Project Director, was mailed to those who had requested it in late June, 2004.
The questionnaire included 26 questions, and 148 detailed items (Table 1). The questions concerned household characteristics, flood experience, risk per-ceptions, flood preparedness, willingness to pay to prevent flood damage, and choice experiments on flood prevention policies. To improve the response rate on important individual survey items that survey respondents are often unwill-ing to answer, such as household income and age, intervals were used rather than exact values. Respondents were asked to express WTP values for internal flood measures, external flood measures, and early-warning systems. Internal and external flood measures relate to structural modifications to waterways, while early-warning systems relate to non-structural measures. Because ap-propriate measures for external flood risk reduction differ between the two cities, this issue is discussed separately below.
3.3 Basic statistical results
Males accounted for 76.5% of all respondents. The range from 40 to 70 accounted for 71.6% of all respondents. Single-family houses accounted for 84.5% of the dwellings (compared to 57.5% for all of Japan in 1998). Wooden houses totaled 67.2% of the dwellings (53.5% for all of Japan in 1998), and houses with embankments composed 13.2% of the total.
Table 1. Items in questionnaires.
Category Item and definition
Category Item and definition
CVM
WTP
Attributes of choice experiment
Internal floods: floods due to reduced sewage and pumping capacity during rains. External floods: floods due to collapse or overflow of dikes and/or dams as a result of rain exceeding that expected on the basis of probability
Early-warning system: system for predicting an imminent flood and warning those in the area of risk
external flood reduction internal flood reduction early warning systems environmental protection
willingness to pay for countermeasures
Residentsí attributes
Age: at 10 year intervals: 10s, 20s...
Income: at 2 million yen intervals: less than 2 million, 2.01 - 4 million yen... Number of people in household: persons
Occupation: Residence period: years
Education: junior high school, high school, college school, university, graduate school
Style: single family or multi-family Structure: wooden or non-wooden Ownership: rental or private
Distance from river: 1) less than 100 m, 2) 100 - 500 m, 3) 500 m - 1 km, 4) 1 - 2 km, 5) 2 - 5 km, 6) more than 5 km
Flood risk perception
Perception of other risks
Experience of flood disaster: yes or no
Perceived frequency of flood risk: 0, 1,..., 6 corresponding to, once for 5 years, 10 years, 20 years, 50 years, 100 years, more than 100 years, and never respectively Perceived consequences of flood risk: 0 for not worried,..., 10 for very worried Characteristics of
house
The 25 items below were evaluated using 0 for not worried,..., 10 for very worried Natural disasters: earthquakes, volcanoes, thunderstorms
Environmental risks: pollution, global warming, endangered species Disease risks: cerebral apoplexy, cardiac insufficiency, AIDS, SARS, BSE Urban risks: gas explosions, fires, traffic accidents
Traditional risks: labor accidents, robbery, murder
High-technology risks: nuclear accidents, GMO, Internet damage
Acceptability of above- and below-ground inundation
The 18 items below were evaluated using yes (1) or no (0)
Insurance, evacuation kits, embankments, evacuation, familiarity with disaster maps, etc. Effects of flood control works on environment: yes or no
Local budget for public facilities like firefighting: yes or no Upper reaches: Toki City
Lower reaches: Kita ward of Nagoya City WTP
factors
than 10 years for 9.9% of the respondents, 10–20 years for 19.3%, 20–30 years for 21.1%, 30–40 years for 18.3%, 40–50 years for 12.2%, 50-60 years for 9.4%, and more than 60 years for 9.7%.
64 G. Zhai
than 14 million yen.
The education levels of the respondents were distributed as follows: 18.5% had graduated from junior high school, 49.6% from high school, 11.7% from junior college, 18.5% from college, and 1.3% from graduate school.
4 Public Preferences for River Management
Respondents were asked to answer the question: “Although dams and dikes and so on are constructed to prevent flood occurrence, flooding occurs somewhere every year. What do you think of current flood prevention mea-sures? Please choose your favorite ONE AND ONLY ONE measure from those below.” Analysis of the results showed the diversity of people’s interests in river management, although most (82%) thought that some flood control measures should be taken (Fig. 3). Respondents in Toki City had a greater preference for external flood measures (28.2%) than those in Kita ward (19%), while those in Kita ward had a greater preference for internal flood measures (48.1%) than those in Toki City (25.7%) (Fig. 4).
5 Flood Risk Acceptability
5.1 Perceived probability of house flooding in the future
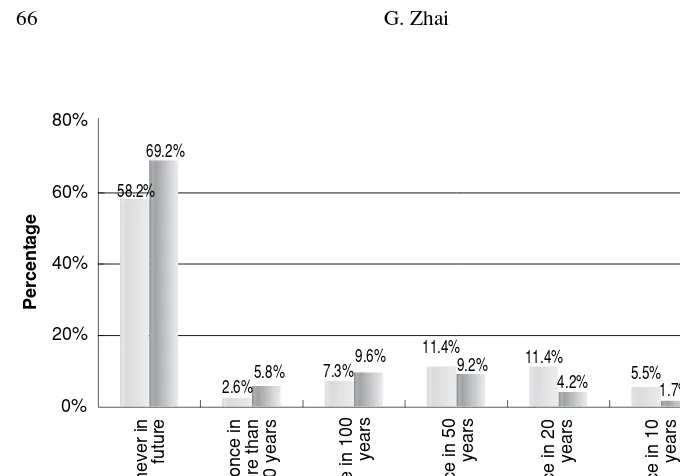
In the survey, two questions dealt with residents’ perceived a probability of their houses flooding in the future. The questions were worded as follows: “How often do you think your house will be flooded below (above) ground in the future? Please choose the most appropriate answer from the choices below. Once in 5 years, 10 years, 20 years, 50 years, 100 years, or more than 100 years; absolutely never; don’t know.” Because the recurrence of a 100-year flood or a 200-year flood may have been difficult for respondents to understand, the probability of a flood occurring within the next 50 years was also included in the survey. Of 391 and 364 valid responses to the questions of below- and above-ground inundation, respectively, the respective percentages of respondents answering “don’t know” were 30% and 34%. If the “don’t know” responses are excluded, the results (Fig. 5) indicate that nearly 60 and 70% of respondents did not correctly perceive the probabilities of below- and above-ground inundation, respectively. Among the group that did correctly perceive the probability of flooding, the median below-ground inundation probability was once in 50 years and once in 20 years (both 11.4%), while the median above-ground inundation probability was once in 100 years (9.6%).
5.2 Acceptable flood probability
Flood measures are
Fig. 3. Public preferences for river management.
Toki city
External flood measures Internal flood measures
Soft measures Lessening current expenses
Flood measures are unnecessary Others Donít know
Fig. 4. Difference in public preferences according to regions.
66 G. Zhai
never in future once in more than 100 years
once in 100
Below-ground inundation (N=273) Above-ground inundation (N=240)
Fig. 5. Perceived probability of house inundation.
0%
unallowable once in 1000
years
Acceptability of flood occurrence
Below-ground inundation (N=238) Above-ground inundation (N=237)
acceptability was once in 100 years (23%).
6 WTP for Flood Risk Reduction
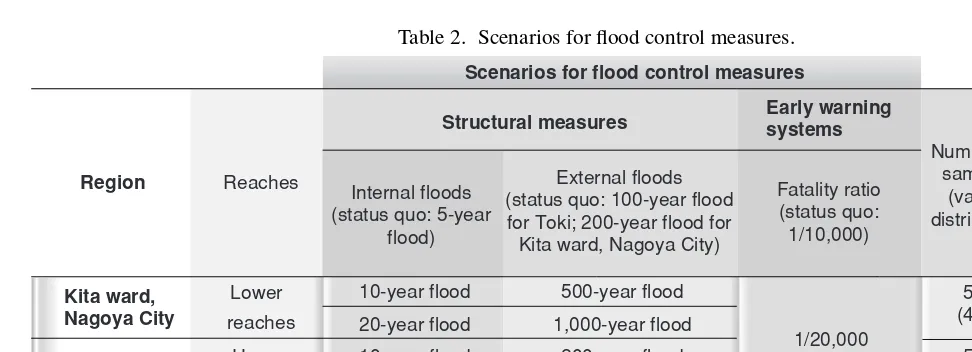
As a matter of common sense, countermeasures against internal and ex-ternal floods and early-warning systems should be implemented. These are defined in Table 1. First, respondents were asked to give answers for five scenarios: two scenarios each for internal and external floods, and one sce-nario for early warning systems (Table 2). The current sewage systems in Toki and Nagoya were designed for about a 5-year internal flood, while the levees and banks were designed for a 100-year flood in Toki and a 200-year flood in Nagoya. Planning flood control projects for higher levels requires an understanding of residents’ WTP thresholds.
In addition, to examine WTP for environmental risks from flood control projects, information about potential damage to the river environment from the construction of flood control projects was either included in the survey or not. Here, environmental effects were dealt with as external factors; that is, when flood control projects are constructed, the environment may be dam-aged. However, Clarket al. (2002) treated them as internal factors; that is, when flood control projects are constructed, efforts might be made to mini-mize effects on the environment. The effect of providing financial information was considered in the same way.
Because the recurrence of floods at specific levels, i.e. 100-year or 200-year floods, may have been difficult for respondents to understand, the proba-bility of a 50-year flood was also included in the survey in the same terms as once every 200 years (i.e., a probability of 22.2% within 50 years).
After indicating that the hypothetical projects would last for 20 years, re-spondents were asked to give their WTP values for each project. Because payment cards and dichotomous choice formats like a referendum approach are recommended and the former are more informative and cheaper to imple-ment than the latter (Batemanet al., 2002), payment cards were used in the survey.
68
G.
Zhai
Table 2. Scenarios for flood control measures.
Region Reaches
Kita ward, Nagoya City
Lower reaches
Toki City Upper
reaches
Scenarios for flood control measures
Structural measures Early warningsystems
Internal floods (status quo: 5-year
flood)
10-year flood
20-year flood 10-year flood
20-year flood
External floods (status quo: 100-year flood for Toki; 200-year flood for Kita ward, Nagoya City)
500-year flood
Fatality ratio (status quo: 1/10,000)
1/20,000
Number of samples
(validly distributed)
500 (479)
201 (42%)
500 (483)
227 (47%)
1000 (962)
428 (44.5%) Number of observations
(response rate)
1,000-year flood 200-year flood
500-year flood
Q: If an early warning system for floods was established, the fatality ratio of a 50-year flood would decrease from one in every 10,000 people to one in 20,000. If a foundation was established for the specific purpose of implementing this early warning system, how much would you donate to it every year? (Choose one please)
1. 5. 9. 13.
2. 6. 10. 14.
3. 7. 11. 15.
4. 8. 12. 16. Other:
0 200 500 1,000
2,000 3,000 4,000 5,000
7,000 10,000 15,000 20,000
25,000 30,000 35,000
Fig. 7. Question asked in survey.
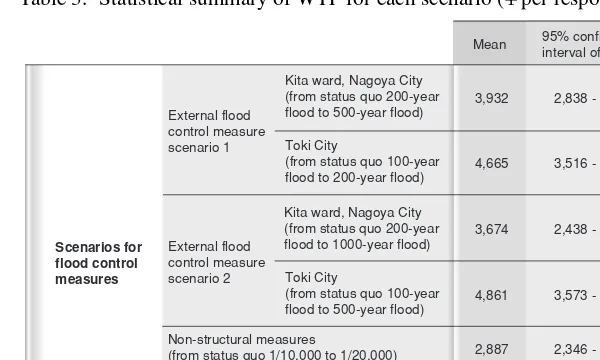
by the government, payment by donation was used in the survey (Fig. 7). Because the status quo protection levels provided by levees in Nagoya (200-year flood) and Toki (100-year flood) cities differ, the WTP for external flood control measures for the two areas is discussed separately. Ta-ble 3 shows a statistical summary of the WTP for each scenario. The WTP
levels for different measures range from 2,887 to 4,861 in terms of the
mean and from1,000 to2,000 in terms of the median. Regarding the
sce-narios for flood control measures listed in the table, external scenario 1 refers to a measure that would improve the protection level from the status quo of a 100-year flood to that of a 200-year flood for Toki or from the status quo of a 200-year flood to that of a 500-year flood for Nagoya. External scenario 2 would improve the protection level from the status quo of a 100-year flood to that of a 500-year flood in Toki or from the status quo of a 200-year flood to that of a 1000-year flood for Nagoya. Internal scenario 1 refers to a mea-sure that would improve the protection level from the status quo of a 5-year flood to that of a 10-year flood, while internal scenario 2 would improve the protection level to that of a 20-year flood.
6.1 Determinants of WTP for flood risk reduction with multivariate
re-gression
70 G. Zhai
Table 3. Statistical summary of WTP for each scenario (per respondent per year).
95% confidence
(from status quo 1/10,000 to 1/20,000) Internal flood control measure scenario 1 (from status quo 5-year flood to 10-year flood) Internal flood control measure scenario 2 (from status quo 5-year flood to 10-year flood) External flood
control measure scenario 2
Kita ward, Nagoya City (from status quo 200-year flood to 500-year flood) Toki City
(from status quo 100-year flood to 200-year flood) Kita ward, Nagoya City (from status quo 200-year flood to 1000-year flood) Toki City
(from status quo 100-year flood to 500-year flood)
3,932
per capita), individual preparedness, etc.
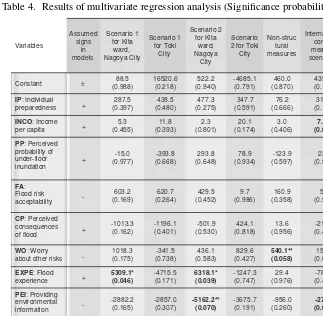
Due to high correlations between perceived probability of under- and above-floor inundation (0.914), the perceived under-floor inundation proba-bility was selected as one of the independent variables (PP) of WTP. Indi-vidual preparedness (IP) was assessed from 18 sub-items, like preparation of survival food, potable water, hazard map, and so on. If the answer was YES to the preparation of a sub-item, then 1 mark was given. If all answers were YES, the individual preparedness mark was 18. The degree of worry about other risks (WO) and perceptions of the consequences of flood risk (CP) were averaged by degrees of worry ranging from 0 (not at all) to 10 (very worried) from 25 non-flood-related risks (excluding typhoons, storms, river flooding, and landslides) and 12 sub-items of flood impacts, respectively. Income per capita (INCO) was used to represent limited resources. In addition, flood ex-perience (EXPE), the effects of providing environmental and budget informa-tion (PEI and PBI) on WTP, and the distance from a river (DIST) were tested in the models. A multivariate regression model was run with SPSS 10.0J for Windows (SPSS Inc., 1999a). The results are shown in Table 4.
First, the goodness of fit to the models was 0.40–0.45 for external mea-sures, 0.22–0.23 for internal meamea-sures, and 0.126 for non-structural measures. This suggests that the framework in Fig. 1 is most applicable to external mea-sures.
Table 4. Results of multivariate regression analysis (Significance probability in parentheses). about other risks
EXPE: Flood
Note: * and ** denote statistically significant levels of 0.05 and 0.01, respectively. -4685.1
0.423 0.126 0.219 0.235
and so was not necessarily consistent with the assumptions in the framework. IP, INCO, and PEI had the same signs in the seven models, while the other factors did not. This suggests that WTP may increase with individual pre-paredness and income per capita, but may decrease after negative information on flood control measures is provided, which is consistent with the common assumptions. Of the variables with different signs in the models (PP, FA, CP, WO, EXPE, PBI, and DIST), some were interrelated—for example, flood risk acceptability depends on the trade-off between flood risk perception and the perception of other risks. This implies that another method (e.g., a covariance structure analysis) is needed to obtain a general and integrated evaluation.
72 G. Zhai
EXPE, PEI, and DIST for internal measures; WO and DIST for non-structural measures; and INCO and PEI for internal measures. However, there were no statistically significant factors for either external or internal measures for Toki city.
6.2 Covariance structure analysis
As mentioned, the multivariate regression analysis showed slightly differ-ent results for the determinants of individual WTP for each flood risk reduc-tion measure. To discuss the general determinants of a synthesized WTP for flood risk reduction, which are measured indirectly by means of observable in-dicators, such as individual WTP, a covariance structure analysis (CSA) was used here.
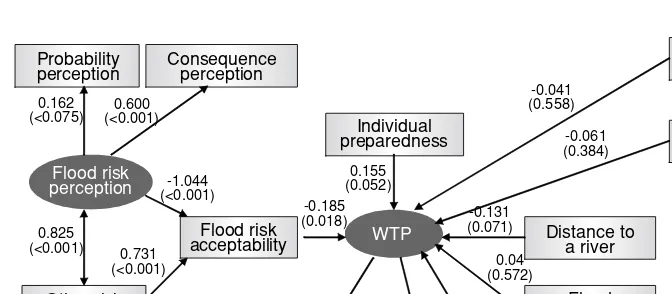
CSA is an extension of the regression model and is used to test the fit of a correlation matrix against two or more causal models being compared (e.g., Krzanowski and Marriott, 1998; Wakui and Wakui, 2003). CSA origi-nated from physiology, and has been widely applied in business, marketing, and human resource management. In CSA, the researcher uses the existing knowledge/theory/framework to generate hypotheses of how the system func-tions. These hypotheses are explicitly stated in the form of a causal model that depicts pathways, both direct and indirect, by which (latent or observed) variables influence each other. The researcher’s theoretical model can be eval-uated by assessing the extent to which covariances among variables in the model are consistent with those occurring in the actual data. To test the theo-retical framework shown in Fig. 1 through CSA, two latent variables, general WTP and perceived flood risk, were introduced. The general WTP repre-sents the resident’s fundamental attitude to paying for a reduction in flood risk and determines the specific WTP for each measure, while the perceived flood risk is conceptualized from perceptions regarding the probability and consequences of flood risk.
(B)
Observed variable Latent variable X1,...X5: WTP for each different measure
2=189.6,df=89, RMSEA= 0.071, CFI= 0.980, NFI= 0.963
WTP Kita ward of Nagoya City
Flood risk
Observed variable Latent variable X1,...X5: WTP for each different measure
2=169.6, df=89, RMSEA= 0.068, CFI= 0.981, NFI= 0.961
WTP
Fig. 8. Simplified path diagrams of WTP for flood control measures.
74 G. Zhai
the effects (standardized regression weights) or the correlations.
First, the proposed models for both Toki City and Kita ward, Nagoya City appear to be supported. The root mean square error of approxi-mation (RMSEA), comparative fit index (CFI), and normed fit index (NFI) are approximately 0.070, 0.98, and 0.96, respectively. In addition, the chi-square to degree of freedom ratio ranges from 1.91 to 2.13. Together, these fitting statistics suggest that the model fits the data reasonably well1.
Second, the signs for the effect values of the variables are consistent with the assumption in Table 4, implying the validity of the framework in Fig. 1. That is, in relation to the direct effects of the variables, WTP for flood con-trol measures may increase with income per capita, individual preparedness, and flood experience, but may decrease with distance to a river, flood risk ac-ceptability, and the provision of environmental information. Providing budget information with different signs showed different impacts on WTP in Toki City and Kita ward, Nagoya City. However, in relation to indirect effects, the signs of the variables imply that WTP increases with perceived flood risk and decreases with perception of other risks.
Finally, the most important determinants of WTP for flood control mea-sures are slightly different for both areas. For Toki City, the most important determinants were acceptability of flood risk, individual preparedness, income per capita, and the distance to a river, while for Kita ward, they were accept-ability of flood risk and the provision of environmental information, at a sta-tistically significant level of 0.1. Furthermore, the acceptability of flood risk depends (at a statistically significant level) on perceived flood risk and percep-tion of other risks. The effect values suggest that perceived flood risk plays a slightly more important role in the acceptability of flood risk than perception of other risks.
7 Multi-Attribute Evaluation with Choice Experiment Approach
7.1 Framework for evaluating multi-attribute flood prevention measures
through a choice experiment
In a choice experiment, respondents are presented with a series of alterna-tives and asked to choose those that they most prefer. A baseline alternative, corresponding to the status quo, is generally included in each choice set. Usu-ally, each alternative is defined by a number of attributes, which vary among the different alternatives. Aggregated choice frequencies are modeled to infer
1The magnitudes of the fitting statistics should be interpreted in light of the fact that
the relative impact of each attribute on choice, and the marginal value of each attribute for a given option is calculated by statistical methods like the multi-nomial logit model. Along with the attributes, individual characteristics such as income and age may also influence the choice. The mixed logit model can be used to deal with these characteristics (Greene, 2003).
The main theoretical support for the choice experiment technique is the random utility theory (Thurstone, 1927; Mcfadden, 1973; Manski, 1977), ac-cording to which consumers maximize their utility function (subject to a bud-get constraint), whose random term is supposed to have a specific distribution:
ui =vi +εi, (1)
whereUi is the utility when theith scenario is chosen,Vi is the deterministic
component, andεis the random term.
Supposing that the random terms have an extreme-value (Gumbel) distri-bution, the probability of choosing theith scenario from a choice setYfollows a logistic distribution and leads to what is called the conditional logit model (Mcfadden, 1973; Greene, 2003):
P(i/Y)=exp(λVi)/
j
exp(λVi). (2)
An important implication of the standard logit model is that selections from the choice set must obey the property of independence from irrelevant alternatives (IIA), which states that the relative probabilities of two options being selected are unaffected by the introduction or removal of other alterna-tives (Luce, 1959).
To estimate the indirect utility function, the following linear form is often applied:
Vi n = Ai +
j
βjxi j+
h
αhzhn, (3)
where Ai is an alternative-specific constant (ASC),βj is the parameter of the jth attribute of theith alternative represented by the variablexi j, andαhis the
parameter of thehth characteristic of personnrepresented byzhn.
As a measure of the benefits resulting from changes in an attribute, the marginal willingness to pay (MWTP), which is widely discussed as a main research consideration in the fields of transportation and environmental stud-ies, can be rewritten as
MSRi = −
∂V/∂xi
76 G. Zhai
The price level used here was the mean payment increase proposed in each survey scenario, whileV is the marginal indirect utility for attributei.
In a manner similar to MWTP, another measure, the marginal substitu-tion ratio (MSR), provides the marginal substitusubstitu-tion of one attribute due to a change in another one. Because of the specific functional form of the indirect utility function, MSRs have to be calculated as
MSRj−>i = −
∂V/∂xi
∂V/∂xj
. (5)
The implementation of the choice experiment approach proceeds in sev-eral steps, as described in a later section. We can already specify that flood prevention measures must first be described by their main attributes and can take different respective levels. The attributes and levels are then combined (using a statistical design) to create scenarios, which are formed into choice sets that are presented to respondents at the time of the survey.
7.2 Valuation question card
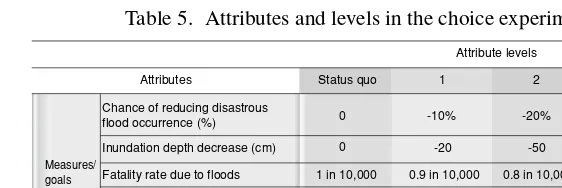
As a matter of common sense, countermeasures against internal and exter-nal floods and early warning systems should be implemented to prevent flood damage, yet at the same time, the environment should be protected at the lowest possible cost. Therefore, we utilized five criteria (attributes) compris-ing different public preferences for flood prevention measures: external flood reduction, internal flood reduction, early warning systems, environmental pro-tection, and willingness to pay for countermeasures. These criteria were rep-resented as the occurrence of disastrous floods, inundation depth, fatality rate, environmental improvement ratio, and annual additional expense per capita, respectively. Four levels were assigned to each attribute (Table 5).
To help individuals understand each attribute, brief explanations were pro-vided in the survey questionnaires. The chance of disastrous flood occurrence was defined as the probability of floods due to the collapse or overflow of dikes and dams (i.e., an external flood) as a result of rains exceeding those that would be expected on the basis of probability. At the moment, the dikes in Nagoya city are built to withstand 200-year rains, while those in Toki city are built to withstand 100-year rains. The levels for this attribute were defined
as−10, −20, −50%, and the status quo (0%). Inundation depth reduction
Table 5. Attributes and levels in the choice experiment.
0
Inundation depth decrease (cm) 0
Fatality rate due to floods 1 in 10,000
Measures/ goals
Improvement rate for river
environment 0
Annual additional expense per capita 0
Chance of reducing disastrous flood occurrence (%)
Attribute levels
Attributes Status quo 1 2 3
-10% -20%
-20 -50
0.9 in 10,000 0.8 in 10,000
10% 20%
2,000 5,000
-50%
-100
0.5 in 10,000
50%
10,000
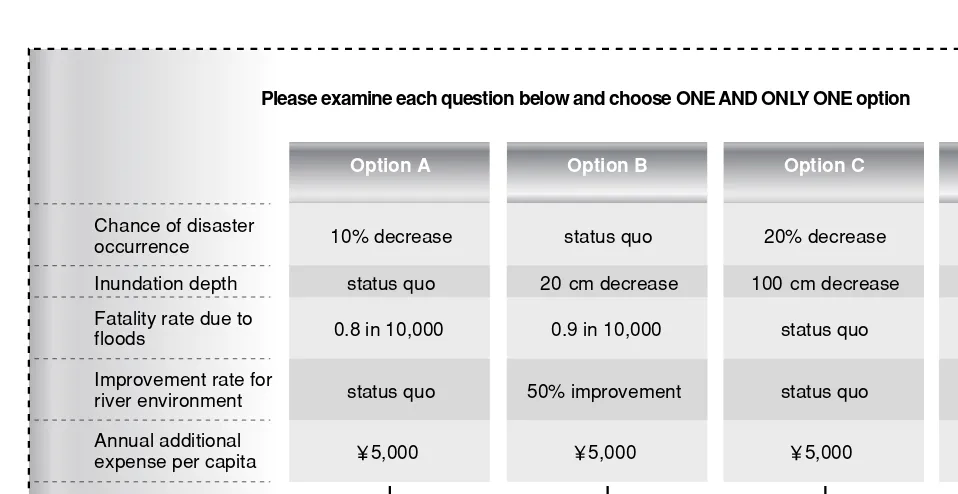
a flood over the total population affected by the flood. The current fatality rate due to floods is approximately 1 in 10,000 per flood event (Zhai et al., 2006a). Here, the levels were specified as 0.9 in 10,000, 0.8 in 10,000, 0.5 in 10,000, and the status quo (1 in 10,000). Because the occurrence of fatali-ties largely depends on early warning and evacuation systems, the fatality rate reduction may be viewed as its representative index. The river environment refers to the natural environment, including the aquatic plants and animals in a river and in the waterfront ecosystem, and the living environment at the interface between the river and human beings, including the water quality, landscape, and river space. The levels for this attribute were defined as im-provement rates of 10, 20, and 50%, and the status quo (0%). The last attribute was the additional expense of flood prevention measures, with levels of 2,000 yen/person/year, 5,000 yen/person/year, 10,000 yen/person/year, and the sta-tus quo (0 yen/person/year). Based on the attributes and their levels, 12 choice sets were created by an orthogonal design approach using SPSS version 10.0J (SPSS Inc., 1999a). The valuation section of the survey consisted of four separate questions. For each question, respondents were asked to choose the most desirable of three alternatives based on descriptions of flood prevention measures at different prices (options A, B, and C), or to choose option D (the status quo) (Fig. 9).
7.3 Main results
ob-78
G.
Zhai
A. B. C. D.
Chance of disaster occurrence
Inundation depth
Fatality rate due to floods
Improvement rate for river environment
Annual additional expense per capita
I would select
Option A Option B Option C Option D
(status quo)
10% decrease status quo 20% decrease status quo
status quo 20 cm decrease 100 cm decrease status quo
0.8 in 10,000 0.9 in 10,000 status quo 1 in 10,000
status quo 50% improvement status quo status quo
5,000 5,000 5,000 0
Please examine each question below and choose ONE AND ONLY ONE option
tain important information like the marginal substitution ratio (MSR) from the validated model or models. The fourth is to discuss whether there are regional differences in the model results.
Table 6 shows the results for two multinomial logit models, denoted as Model 1 and Model 2, which were both processed with LIMDEP Version 8.0 (Greene, 2002). Model 1 contained the attributes and constants, while Model 2 was a full model containing both the attributes and the socio-economic fac-tors. To correctly draw inferences from the model results, it was important to validate the models. The validation included evaluating the goodness of fit and assessing each variable coefficient, including the alternative-specific con-stants (ASCs). The explanatory power of Model 2 was a little stronger, with an R-squared and an adjusted R-squared of 0.232 and 0.221, respectively.
The hypothesis that the socio-economic factors are not significant in ex-plaining the respondents’ choice preferences was strongly rejected by the like-lihood ratio test (Eq. (6)): chi-squared =2[852.174−822.13] =60.1. The critical chi-squared value for 24 degrees of freedom is 36.42. This means that the socio-economic factors significantly affected an individual’s decision-making, and thus, Model 2 was statistically proven to be stronger than Model 1 in terms of its explanatory power. The multinomial logit model necessarily involves strong assumptions about the independence of irrelevant alternatives (IIA). Hausman tests for IIA reject the null hypothesis.
Chi-squared=2(lnL(model with a factor)
−lnL(model without a factor))
>Chi-squared (degrees of freedom). (6)
Four attributes (CHANCE, DEPTH, ENVIRONMENT, and EXPENSE) were statistically significant, and their coefficient signs were the same in both models, while the attribute of FATALITY was statistically insignificant in both
models. The large p-values of the FATALITY variable in both models (0.97
and 0.88) imply that this attribute was almost totally ignored in decision-making on flood prevention measures when the ASCs and socio-economic factors were considered in the model.
All ASC coefficients were positive and statistically significant across all options in Model 1, but not in Model 2. ASCs can capture a mixture of sta-tus quo bias effects and the impacts of unobserved attributes in an
attribute-only model (Bateman et al., 2002). Thus, the different forms of the ASCs
80 G. Zhai
Table 6. Results for two multinomial logit models with choice as a dependent variable.
1.94 (6.39) ****
Prob[chi squared > value]
0.204
(attributes and constants) (full model)
0.044 (0.15)
Note: 1) t value in parenthesis
evaluation results mentioned above.
The effects of the socio-economic factors can be discussed in terms of their interaction with the ASCs, though the interpretation is complicated. First, the signs of all coefficients for the interaction terms with the socioeconomic variables, except for the AGE variable, were consistent with common knowl-edge. Second, the interaction terms with SEX and INCOME produced statis-tically significantly positive impacts on the utility, but the coefficients of the interaction terms with REGION, INFOENV, and AGE were statistically in-significant for all three non-status-quo options at the 0.05 level. Third, EXPE-RIENCE, INFOBUDG, EDUCATION, and DISTANCE were not significant for all three non-status-quo options at the 0.05 level. Here, we use the likeli-hood ratio test to discuss the effects of these variables on the models, based on the hypothesis that a certain factor is not significant in explaining the choice preferences for flood prevention measures. If the hypothesis is rejected by the likelihood ratio test (Eq. (6)), a factor’s effect is significant. The chi-squared values and the probabilities given by the likelihood ratio test for certain factors listed in Table 7 show that EXPERIENCE and DISTANCE were statistically significant, while EDUCATION and IFORBUDG were not, at the 0.05 level.
7.4 Implicit relationships between attributes from model results
Table 8 shows the matrix of MSRs obtained from the results for Model 2 listed in Table 7. The variable FATALITY, which had little impact on decision-making (i.e., a high p-value), is marked with an asterisk. For Model 2, to maintain the same utility if other conditions do not change, a 10% improve-ment in the river ENVIRONMENT should be proportional to a 9.8% increase in the flood occurrence probability, to a 15.167 cm increase in the inunda-tion depth, or to 413.6 yen per capita of addiinunda-tional annual expense. The last column in Table 8 lists point estimates of the marginal willingness to pay (MWTP) for each attribute.
82 G. Zhai
Table 7. Chi-squared values from the likelihood ratio test for certain factors.
Model 2
1) Probability in parentheses
2) *, **, ***, and **** refer to significance levels of 0.05, 0.01, 0.005, and 0.001, respectively.
Table 8. Marginal substitution ratios among the attributes in Model 2.
CHANCE (100%)
(100%) DEPTH(cm) (/10,000 persons)*FATALITY ENVIRONMENT(100%)
EXPENSE
* Statistically insignificant at 0.1 level
Table 9. Implicit prices (MWTPs; yen/person/year) and 95% confidence intervals for each model by Monte-Carlo simulation with 1,000 iterations.
CHANCE (100%)
DEPTH (cm)
FATALITY (/10,000)
ENVIRONMENT (100%)
Model 1 Model 2
-4,637
(1,387 to 7,098) (1,458 to 7,157)4,136
* Statistically insignificant at 0.1 level
in the flood occurrence probability, 270 yen/person/year for a 10 cm reduction in the inundation depth, and 422.7 yen/person/year for a 10% improvement in the river environment.
7.5 Result differences between regions
significant impact on the utility functions of Kita ward and Toki City. This does not necessarily mean, however, that the analysis results would have been the same in each region had we used regionally separated data. First, the dis-cussion with regard to the likelihood ratio test concerns the involvement of the various socio-economic variables in the model and the results evaluated for different regions. In a manner similar to the above analysis, the former was discussed in terms of Eq. (6), while the latter was examined with Eq. (7) (Greene, 2003). This equation tests the alternative hypothesis that the constant term and the coefficients of the attribute variables were the same whether RE-GION equaled 1 (Toki City) or 2 (Kita ward). As a result, four cases were examined, and the results are listed in Table 10.
Chi-squared=2(−lnL(pooled)+(lnL(model with a factor)
+lnL(model without a factor)))
>Chi-squared (degrees of freedom). (7)
The likelihood ratio tests on the model differences in the two regions showed that both models were significant at the 0.05 level. The tests on the differences in the two models, however, showed that the socio-economic fac-tors were statistically significant in affecting the decision-making in Toki City (less than 0.0001), but not in Kita ward (0.1086), at the 0.05 level.
In addition, the differences were examined in terms of the coefficients of the attribute variables in the four models, as listed in Table 11. At least three things can be observed from the table. First, there were great differences not only in the coefficients, but also in the t-values of two variables, CHANCE and ENVIRONMENT, with respect to REGION. In the Toki City model, EN-VIRONMENT was significant but CHANCE was not, while the opposite was true for Kita ward. Second, FATALITY was not statistically significant in any of the four models, which was consistent with the analysis results described above. Third, the coefficients for DEPTH and EXPENSE were nearly the same in all four models.
Finally, the degree of regional difference can be explained in terms of
Table 10. Significant probability for likelihood ratio tests between regions and models.
Between models 1 and 2
Model 1 (attributes and constants) Model 2 (full model)
Between regions Toki city Kita ward of Nagoya city
0.0001 0.1086
84 G. Zhai
Table 11. Coefficients andt-values of the attribute variables in the four models.
-1.2753
(full model) (attributes andModel 1 constants)
Model 2 (full model) Kita ward of Nagoya city Toki city
FATALITY
ENVIRONMENT
EXPENSE
1) t -value in parentheses
2) * Statistically insignificant at 0.05 level CHANCE
DEPTH
Table 12. Regional differences in MWTP (yen/person/year) for Models 1 and 2.
CHANCE (100%)
MWTP instead of MSR because of the complexities of the MSR matrices. Table 12 shows slight differences in the MWTPs between Toki City and Kita ward for both models. In the case of Model 2, as compared with those of Toki City, the MWTPs for Kita ward were 138.1 yen/person/year more for a 10% decrease in the flood occurrence probability, 83 yen/person/year less for a 10 cm reduction in the flood inundation depth, 383.3 yen/person/year less for a fatality reduction of 1/100,000, and 473.8 yen/person/year less for a 10% improvement in the river environment. Therefore, it seems that Nagoya City’s Kita ward pays more attention to disastrous flood occurrences, while Toki City focuses more on environmental protection and fatality reduction measures.
8 Concluding Remarks
of April, 2004. The main findings are summarized as follows.
• Most residents expect some flood control measures and have diverse
interests in river management.
• Nearly half of the respondents accept no flood risk at all.
• The WTP levels for different measures range from2,887 to4,861 in
terms of the mean and from1,000 to2,000 in terms of the median.
It is likely that there is zero marginal WTP for flood risk reduction in both Toki City and Nagoya City. This is because WTP for flood risk reduction must be determined within a multi-risk context.
• Among the five attributes of the flood prevention measures, four
attributes—specifically, the chance of reducing the number of disas-trous flood occurrences, the reduction of inundation depth, the rate of improving the river environment, and the additional expense of new flood prevention measures—were statistically significant.
• There was a statistically significant difference in the model results be-tween Toki City and Kita ward of Nagoya City.
How to apply CVM and the choice experiment approach the general cau-tions have been broadly discussed in environmental economics (e.g., Bate-man, 2002, p. 74). However, when they are applied to flood risk reduction, additional cautions are necessary.
First, WTP for flood risk reduction should be considered together with the risk curve. That is, the “scope effect” in economics may not be detected at a statistically significant level due to its very small changes in WTP. Flood risk, particularly in terms of fatality, is very small, usually at a level of less than 10−6. In the case of Japan, the number of annual fatalities due to floods
86 G. Zhai
additional socio-economic factors are included. It is important to clarify infor-mation regarding how the WTP is produced; for example, by checking what kind of question was asked, what kind of model was used, and how well the model performed.
Third and finally, WTP for moral satisfaction may be induced when CVM is used. Because the marginal WTP for flood risk reduction is close to zero, it would be better to understand that the estimated WTP may be regarded as the one for moral satisfaction.
References
Andreoni, J. (1989): Giving with Impure Altruism: Applications to Charity and Ricardian Equivalence,Journal of Political Economy,97(6), 1447–1458.
Arrow, K. J., P. R. Solow, E. E. Portney, R. Leamer, R. Radner, and H. Schuman (1993): Report of the NOAA panel on contingent valuation,Federal Register,58, 4601 (Jan. 15).
Bateman, L. J. and K. G. Willis (2001): Valuing Environmental Preferences, Oxford University Press.
Batemanet al.(2002): Economic Valuation with Stated Preference Techniques: A Manual, Edward Elgar Publishing Limited.
Carson, R. T. and R. C. Mitchell (1989): Using Surveys to Value Public Goods: The Contingent Valuation Method, Resources for the Future, Washington, DC.
Carson, R. T., R. C. Flores, and R. C. Mitchell (1999): The theory and measurement of passive-use value, I. Bateman and K. G. Willis eds., Valuing Environmental Preferences, Oxford University Press, pp. 109–123.
Champ, P. A., R. C. Bishop, T. C. Brown, and D. W. McCollum (1997): Using donation mech-anisms to value non-use benefits from public goods,Journal of Environmental Economics and Management,33(2), 151–162.
Chilton, S. M. and W. G. Hutchinson (1999): Some further implications of incorporating the warm glow of giving into welfare measures,Journal of Environmental Economics and Man-agement,37(2), 202–209.
Clark, D. E., V. Novotny, R. Grifin, D. Booth, A. Bartosova, M. C. Daun, and M. Hutchinson (2002): “Willingness to pay for flood and ecological risk reduction in an urban watershed”,
Water Science and Technology,45(9), 235–242.
Datascape & Communications Inc. (2004): Kurofune 2004 for Windows, Datascape & Com-munications Inc.
Daun, M. C. and D. Clark (2000): Flood Risk and Contingent Valuation Willingness to Pay Studies: A Methodological Review and Applied Analysis, Technical Report #6, Institute for Urban Environmental Risk Management, Marquette University, Milwaukee, WI.
Desvousgaes, W. H., F. R. Johnson, and H. S. Banzhaf (1998): Environmental Policy Analysis with Limited Information, Edward Elgar.
Greene, W. H. (2002): LIMDEP version 80, Reference Guide, Econometric Software, Inc. Greene, W. H. (2003): Econometric analysis, Prentice-Hall International, Inc.
Hidano, N. and T. Kato (2000): A comparison of tax and donation formats in contingent val-uation surveys: The case of Japan, Discussion Paper No. 00-1. http://www.soc.titech.ac.jp/ library/discuss/text/dp00-1.pdf (in Japanese with English abstract). Accessed on May 19, 2005.
Krzanowski, W. J. I. and F. H. Marriott (1998): Multivariate Analysis: Classification, Covari-ance Structures & Repeated Measurements, Oxford University Press.
Luce, R. D. (1959): Individual Choice Behaviour: A Theoretical Analysis, New York, Wiley. Mangione, T. W. (1995): Mail Surveys: Improving the Quality, SAGE publications.
Manski, C. (1977): The structure of Random Utility Models, Theory and Decision 8, 229–254. Mcfadden, D. (1973): Conditional logit analysis of qualitative choice behaviour, Frontiers in
Econometrics, P. Z. ed., New York, Academic Press.
Shabman, L. and K. Stephenson (1996): Searching for the Correct Benefit Estimate: Empirical Evidence for an Alternative Perspective,Land Economics,72(4), 433–49.
SPSS Inc. (1999a): SPSS 10.0J for Windows, SPSS Inc. (in Japanese). SPSS Inc. (1999b): Amos 4.0 for Windows, SPSS Inc. (in Japanese).
Thunberg, E. M. (1988): “Willingness to Pay for Property and Nonproperty Flood Hazard Reduction Benefits: An Experiment Using Contingent Valuation Survey Method”, Diss. Vir-ginia Polytechnic Institute and State University.
Thurstone, L. (1927): “A law of comparative judgement”,Psychological review,4, 273–286. Wakui, Y. and S. Wakui (2003): Covariance Structural Analysis, Nippon Jitsugyo Publishing
Co., Ltd. (in Japanese).
Zhai, G., T. Fukuzono, and S. Ikeda (2003): An Empirical Model of Efficiency Analysis on Flood Prevention Investment in Japan,Review of Urban & Regional Development Studies, 15(3), 238–254.
Zhai, G., T. Fukuzono, and S. Ikeda (2005): Modeling Flood Damage: Case of Tokai Flood 2000,Journal of the American Water Resources Association,41(1), 77–92.
Zhai, G., T. Fukuzono, and S. Ikeda (2006a): An Empirical Model of Fatalities and Injuries Due to Floods in Japan,Journal of the American Water Resources Association,42(4), 863–875. Zhai, G., T. Sato, T. Fukuzono, S. Ikeda, and K. Yoshida ( 2006b): Willingness to pay for