Drinking and Driving
Drinking and Driving: a road safety manual for decision-makers and practitioners ISBN 978-2-940395-00-2
Suggested citation:
Drinking and Driving: a road safety manual for decision-makers and practitioners.
Geneva, Global Road Safety Partnership, 2007.
© Global Road Safety Partnership 2007.
A hosted programme of the International Federation of Red Cross and Red Crescent Societies. All rights reserved.
Publications of GRSP can be obtained from www.GRSProadsafety.org
Permission to reproduce or translate GRSP publications – whether for sale or for non-commercial distribution – should be addressed to:
Global Road Safety Partnership
c/o International Federation of Red Cross and Red Crescent Societies PO Box 372
17 Chemin des Crêts CH-1211 Geneva 19 Switzerland
he designations employed and the presentation of the material in this publication do not imply the expression of any opinion whatsoever on the part of the Global Road Safety Partnership, the International Federation of Red Cross and Red Crescent Societies or the World Health Organiza-tion (WHO) concerning the legal status of any country, territory, city or area or of its authorities, or concerning the delimitation of its frontiers or boundaries. Dotted lines on maps represent approxi-mate border lines for which there may not yet be full agreement. he mention of speciic companies or of certain manufacturers’ products does not imply that they are endorsed or recommended by the Global Road Safety Partnership, the International Federation of Red Cross and Red Crescent Socie-ties, or WHO in preference to others of a similar nature that are not mentioned. Errors and omissions excepted, the names of proprietary products are distinguished by initial capital letters.
All reasonable precautions have been taken by the Global Road Safety Partnership, the International Federation of Red Cross and Red Crescent Societies and the authors to verify the information con-tained in this publication. However, the published material is being distributed without warranty of any kind, either express or implied. he responsibility for the interpretation and use of the material lies with the reader. In no event shall the Global Road Safety Partnership, the International Federation of Red Cross and Red Crescent Societies or the authors be liable for damages arising from its use.
Table of contents
Preface. . . .vii
Contributors and acknowledgements . . . .ix
Executive summary . . . .xi
Introduction . . . .xv
Background to the series of manuals . . . .xv
Background to the drinking and driving manual . . . .xvii
1. Why is a drinking and driving programme necessary? . . . .1
1.1 Crashes involving drinking and driving worldwide. . . .3
1.1.1 Variations in crashes involving drinking and driving by country. . . 4
1.1.2 The economic impact of crashes involving drinking and driving . . . 6
1.2 Why is drinking and driving a problem?. . . 6
1.2.1 The effects of alcohol on driving. . . 7
1.2.2 The effects of alcohol on risk of a crash . . . .7
1.2.3 The effects of alcohol in the post-crash phase. . . 9
1.2.4 How is alcohol measured?. . . .10
1.3 Who is most at risk of a crash involving drinking and driving?. . . .12
1.3.1 Demographic characteristics of drink-drivers. . . .12
1.3.2 Attitudinal characteristics of drink-drivers . . . .14
1.3.3 Patterns of alcohol use worldwide . . . 14
1.3.4 Characteristics of crash victims. . . 15
1.4 How can crashes involving drinking and driving be reduced?. . . .17
Summary . . . .19
References. . . .20
Drinking and Driving: a road safety manual
In
tr
od
uc
tio
n
iv
2. Assessing the situation and choosing priority actions. . . .23
2.1 Why do you need to assess the situation before deciding which measures to take? . . . .26
2.2 Collecting relevant data: where to begin . . . 26
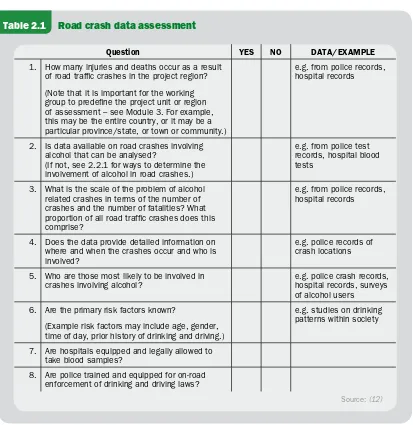
2.2.1 Assessing road crash and health data . . . .28
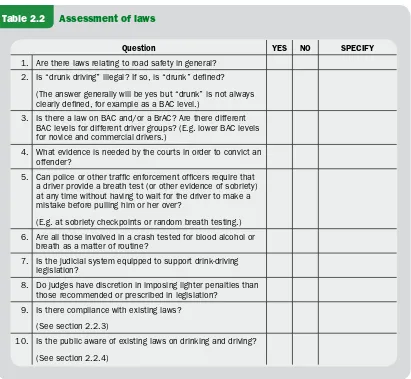
2.2.2 What laws exist? . . . .29
2.2.3 Is there compliance with existing laws? . . . 30
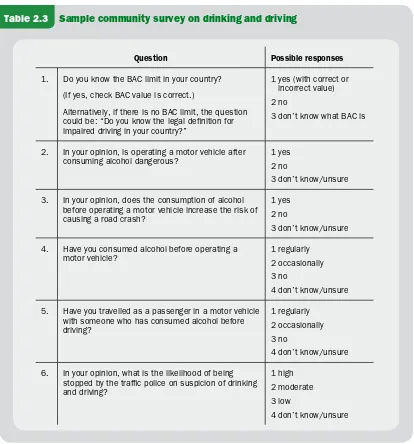
2.2.4 What does the public know about the existing laws? . . . 34
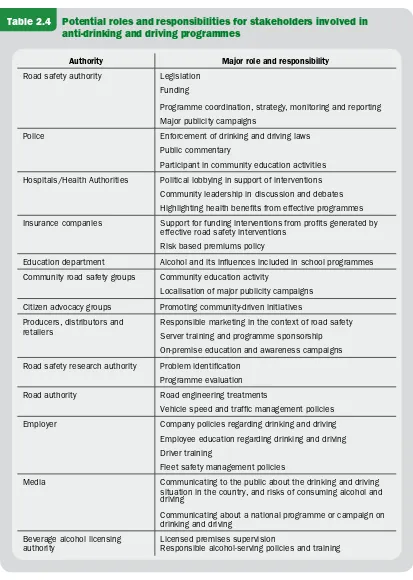
2.2.5 What is a stakeholder assessment and why is it necessary? . . . .34
2.2.6 How to identify community perceptions. . . .40
2.2.7 What other factors should be addressed as part of the situation assessment?. . . .40
2.3 Choosing priority actions. . . 41
2.3.1 Possible programme elements. . . 42
Summary . . . .43
References. . . .46
3. How to design and implement a drinking and driving programme . . . .47
3.1 Gaining political and community support for a drinking and driving programme.51 3.1.1 How to establish and coordinate a working group . . . 51
3.2 How to prepare a plan of action . . . 55
3.2.1 Identifying the problem . . . .57
3.2.2 Setting the programme’s objectives. . . 57
3.2.3 Setting clear targets. . . 58
3.2.4 Setting performance indicators . . . .60
3.2.5 Deciding on activities . . . .61
3.2.6 Piloting the programme in a community or region. . . 61
3.2.7 Setting a timeframe . . . 64
3.2.8 Estimating resource needs . . . .64
3.2.9 Promoting the programme. . . .66
3.2.10 Setting up a monitoring mechanism . . . .66
3.2.11 Identify capacity-building and training requirements. . . .68
3.2.12 Ensuring sustainability of the programme . . . .68
3.2.13 Celebrating success . . . .68
Drinking and Driving: a road safety manual
v
3.3 Interventions . . . 69
3.3.1 How to develop and implement laws on drinking and driving. . . 69
3.3.2 How to enforce drinking and driving laws. . . .79
3.3.3 Punishments and sanctions for drinking and driving offences. . . 92
3.4 Social marketing and public education . . . .97
3.4.1 How to raise public awareness and change attitudes through a mass media campaign . . . 99
3.4.2 Getting the campaign message to the target audience . . . .102
3.5 Community-based interventions. . . .107
3.6 Engineering countermeasures. . . .110
3.7 Ensuring an appropriate medical response. . . .113
3.7.1 Organization and planning of trauma care systems . . . .113
3.7.2 Crash-site care of alcohol-impaired casualties. . . 113
Summary . . . .116
References. . . .116
4. How to evaluate the programme. . . .119
4.1 Planning the evaluation . . . .121
4.1.1 Aims of evaluation . . . 122
4.1.2 Types of evaluation. . . 122
4.2 Choosing the evaluation methods . . . .123
4.2.1 Study types for formative and process evaluations . . . .124
4.2.2 Study types for impact and outcome evaluations. . . 124
4.2.3 Choosing the performance indicators . . . .128
4.2.4 Conducting an economic evaluation of a programme . . . .129
4.2.5 Determining sample size . . . .130
4.3 Dissemination and feedback . . . 132
Summary . . . .135
vi
Appendices and acronyms. . . 137
Appendix 1: Factors that impact blood alcohol concentration (BAC) . . . .139
Appendix 2: Hand-held breath-testing devices . . . 141
Appendix 3: Safe vehicle interception . . . .142
Appendix 4: Different types of publicity campaigns. . . .146
References. . . .148
Preface
Road traic injuries are a major public health problem and a leading cause of death and injury around the world. Each year nearly 1.2 million people die and millions more are injured or disabled as a result of road crashes, mostly in low-income and middle-income countries. As well as creating enormous social costs for individu-als, families and communities, road traic injuries place a heavy burden on health services and economies. he cost to countries, possibly already struggling with other development concerns, may well be 1%–2% of their gross national product. As motorization increases, road traic crashes are a fast-growing problem, particularly in developing countries. If present trends continue unchecked, road traic injuries will increase dramatically in most parts of the world over the next two decades, with the greatest impact falling on the most vulnerable citizens.
Appropriate and targeted action is urgently needed. he World report on road traf-ic injury prevention, launched jointly in 2004 by the World Health Organization (WHO) and the World Bank, identiied improvements in road safety management that have dramatically decreased road traic deaths and injuries in industrialized countries that have been active in road safety. he report showed that the use of seat-belts, helmets and child restraints has saved thousands of lives. he introduction of speed limits, the creation of safer infrastructure, the enforcement of blood alcohol concentration limits and improvements in vehicle safety, are all interventions that have been tested and repeatedly shown to be efective.
he international community must now take the lead in encouraging good practice in road safety management and the take up of these interventions in more countries, in ways appropriate to their particular settings. To speed up such eforts, the United Nations General Assembly passed a resolution on 14 April 2004 urging greater atten-tion and resources to be directed towards the global road safety crisis. Resoluatten-tion 58/289 on “Improving global road safety” stressed the importance of international collaboration in the ield of road safety. A further resolution (A58/L.60), passed in October 2005, reairmed the commitment of the United Nations to this issue, encouraging Member States to implement the recommendations of the World report on road traic injury prevention, and commending collaborative road safety initiatives so far undertaken towards implementing resolution 58/289. In particular, it encour-aged Member States to focus on addressing key risk factors, and to establish lead agencies for road safety.
To contribute to the implementation of these resolutions, the Global Road Safety Partnership (GRSP), the World Health Organization, the FIA Foundation for the Automobile and Society, and the World Bank, have collaborated to produce a series of manuals aimed at policy-makers and practitioners. his manual is one of them. Each provides step-by-step guidance to countries wishing to improve road safety and
Drinking and Driving: a road safety manual
to implement the speciic road safety interventions outlined in the World report on road traic injury prevention. hey propose simple, efective and cost-efective solu-tions that can save many lives and reduce the shocking burden of road traic crashes around the world. We would encourage all to use these manuals.
David Silcock Chief Executive
Global Road Safety Partnership
Etienne Krug Director
Department of Injuries and Violence Prevention World Health Organization
David Ward Director General
FIA Foundation for the Automobile and Society
Anthony Bliss
Lead Road Safety Specialist
Transport and Urban Development Department World Bank
Preface
Contributors and acknowledgements
his manual was drated under contract to GRSP by a team from ARRB Transport Research (Australia) and the Transport Research Laboratory (UK). Parts of the manual have also been taken from Helmets: a manual for decision-makers and practi-tioners, the irst manual in this series. Many people were involved in its preparation as authors, peer reviewers, workshop participants and technical editors. GRSP express-es sincere thanks to them all.
Advisory Committee
Anthony Bliss, Etienne Krug, David Silcock, David Ward
Editorial Committee
Kathleen Elsig, Andrew Downing, Margie Peden, Tami Toroyan
Principal Authors
Peter Cairney, Stephen Collier, Robert Klein, Allan Quimby, Ray Shuey, Tanya Styles, Ray Taylor
Contributors to Modules
Paul Graham, Jagadish Guria, Yvette Holder, Charlie Mock, Rebecca Ivers
Peer reviewers and workshop contributors
International reviews: Marilena Amoni, Mark Bane, Heidi Coleman, Brett Bivans, Ross Homel, Ian Johnston, Susan Kirinich, Margie Peden, Robin Room, G Gururaj, Vladimir Poznyak, Barry Sweedler, Eduardo Vasconcello, Maria Vegega.
Contributors to workshop in Bangalore: G. Gururaj, M.N.Reddi, Narayana Gowda, Bhaskar Rao, Prof Sreehari, Jai Prasad, M.T. Naik, Andrew Downing, B.H.Sanjeev Kumar, Mr. Vishveshwaran.
Contributors to workshop in Kerala: S. Anil Radhakrishnan, N. Mural, Stein Lun-debye, Paul Leslie, Dr. Anoop Lal, Subu Kamal, Jim Jarvis, Jacob George, Johnson J Edayaranmula, Dr. Mahesh Chand
Drinking and Driving: a road safety manual
Technical and style editing
Angela Burton
Reference support
Caroline Allsopp
Financial support
GRSP gratefully acknowledges the inancial support received from the World Bank Global Road Safety Facility that made the production of this manual possible.
x
Executive summary
he consumption of alcohol, even in relatively small amounts, increases the risk of being involved in a crash for motorists and pedestrians. Not only does alcohol impair processes critical to safe road use, such as vision and reaction time, it is also associated with impaired judgement and so is oten linked to other high-risk road use behav-iours such as speeding or not using seat-belts.
In many countries, research indicates that considerable proportions of drivers, motorcyclists and pedestrians have alcohol in their blood in suicient concentrations to impair their road use skills. While the proile of drink-drivers difers somewhat between regions, there are a number of factors that increase the risk of crashes involv-ing drinkinvolv-ing and drivinvolv-ing. For example, young male drivers are at a high risk of such crashes, and crashes involving alcohol are more frequent at night.
Unfortunately, in many countries, the scale of the problem is not well understood, there is little public awareness of the problem and legislation and enforcement are oten inadequate. he World report on road traic injury prevention identiies the efectiveness of programmes aimed at drinking and driving as a proven efective measure to reduce death and injury on the road.
he purpose of this manual is to inform readers of practical ways to develop coordi-nated and integrated programmes to reduce drinking and driving (including riding motorcycles) within a country. he manual is aimed at addressing drinking and driv-ing among drivers. Commercial drivers are an especially important group to address in terms of drinking and driving because of the large number of passengers they can carry and/or the number of kilometres they are likely to travel. While impaired pedestrians are acknowledged as a problem, this issue is not addressed here.
he manual is aimed at policy-makers and practitioners, and draws on experience from countries that have succeeded in reducing drinking and driving. It provides the background evidence to start a drinking and driving programme, and takes the user through the steps needed to undertake a problem assessment in a country. It then explains how to plan and implement a programme, including setting up a working group, developing a plan, examples of laws and enforcement needed, how to develop public education and publicity campaigns, and inally how to evaluate the programme.
In developing this manual the authors have drawn on case studies from around the world to illustrate “good practice”. Examples from low and middle-income countries are given wherever possible, but it is a relection on the lack of attention given to the issue in many countries that most examples are from highly motorized countries.
Drinking and Driving: a road safety manual
xii
Introduction
i
In
tr
o
d
u
ct
io
Introduction
Background to the series of manuals
he World Health Organization (WHO) dedicated World Health Day 2004 to the issue of road safety. Events marking the day were held in more than 130 countries to raise awareness about road traic injuries, stimulate new road safety programmes and improve existing initiatives. On the same day, the WHO and the World Bank jointly launched the World report on road traic injury prevention, highlighting the grow-ing pandemic of road traic injuries. he report discusses in detail the fundamental concepts of road traic injury prevention, the impact of road traic injuries, the main causes and risk factors for road traic crashes, and proven and efective intervention strategies. It concludes with six important recommendations that countries can fol-low to improve their road safety record.
he report stresses that any actions taken by countries to prevent road traic injuries need to be based on sound scientiic evidence, and should be culturally appropriate and tested locally. However, in its ith recommendation, the report makes it clear that there are several “good practices” – interventions already tried and tested – that can be implemented at low cost in most countries. hese include strategies that address some of the major risk factors for road traic injuries, such as:
setting laws requiring installation and use of seat-belts and child restraints for all occupants of motor vehicles;
requiring riders of motorcycles to wear helmets;
establishing and enforcing low blood alcohol concentration limits; setting and enforcing speed limits;
managing existing road infrastructure to increase safety. •
• • • •
Recommendations of the World report on road trafic injury prevention
1. Identify a lead agency in government to guide the national road trafic safety effort.
2. Assess the problem, policies, institutional settings and capacity relating to road injury.
3. Prepare a national road safety strategy and plan of action. 4. Allocate inancial and human resources to address the problem.
5. Implement speciic actions to prevent road trafic crashes, minimize injuries and their consequences and evaluate the impact of these actions.
6. Support the development of national capacity and international cooperation. Drinking and Driving: a road safety manual
In
tr
od
uc
tio
n
A week ater World Health Day, on 14 April 2004, the United Nations General Assembly passed a resolution calling for greater attention and resources to be direct-ed towards road safety eforts. he resolution recognisdirect-ed that the Unitdirect-ed Nations system should support eforts to tackle the global road safety crisis. At the same time, it commended WHO and the World Bank for their initiative in launching the World report on road traic injury prevention. It also invited WHO, working in close coop-eration with the United Nations Regional Commissions, to act as coordinator on road safety issues within the United Nations system.
Following the mandate conferred on it by the United Nations General Assembly, WHO has helped develop a network of United Nations and other international road safety organizations – now referred to as the “United Nations Road Safety Collabo-ration”. he members of this group have agreed common goals for their collective eforts, and are initially focusing attention on the six recommendations of the World report on road traic injury prevention.
A direct outcome of this collaboration has been the establishment of an informal consortium consisting of WHO, the World Bank, the FIA Foundation for the Auto-mobile and Society and the Global Road Safety Partnership (GRSP). his consor-tium is working to produce a series of “good practice” manuals covering the key issues identiied in the World report on road traic injury prevention. he project arose out of the numerous requests made to the WHO and the World Bank by road safety practitioners around the world, especially those working in low and middle-income countries, asking for guidance in implementing the report’s recommendations.
he manuals are aimed at governments, non-governmental organizations and road safety practitioners in the broadest sense. Written in an accessible manner, they pro-vide practical steps to implement each recommendation in a way identiied as good practice, while also making clear the roles and responsibilities of all those involved. he manuals are all based on a common format that was used in a similar document on increasing seat-belt use, developed by the FIA Foundation for the Automobile and Society in 2004. Although primarily intended for low and middle-income coun-tries, the manuals are applicable to a range of countries and adaptable to diferent levels of road safety performance. Each manual includes case studies from developed and developing countries.
he World report on road traic injury prevention advocates a comprehensive systems approach to road safety – one that addresses the road, the vehicle and the user. Its starting point is that to efectively tackle road traic injuries, responsibility needs to be shared between governments, industry, non-governmental organizations and international agencies. Furthermore, to be efective, road safety must have commit-ment and input from all the relevant sectors, including those of transport, health, policy-making and law enforcement. hese manuals also relect the views of the report; they too advocate a systems approach and – following the principle that road safety should be pursued across many disciplines – they are targeted at practitioners from a range of sectors.
XVI
Background to the drinking and driving manual
Why was the manual developed?
Road users who are impaired by alcohol have a signiicantly higher risk of being involved in a crash. A survey of studies conducted in low and middle-income countries found that alcohol was present in the blood of between 4% and 69% of injured drivers, 18% to 90% of crash-injured pedestrians and 10% to 28% of injured motorcyclists (1). Programmes addressing the issue of crashes involving drinking and driving have been efective in several countries where they have included legislation and enforcement. his manual seeks to provide practical advice to road safety practitioners on how to conduct such programmes. It follows on from the World report on road traic injury prevention, which describes how alcohol misuse contributes to injuries and fatali-ties among vehicle occupants, riders and pedestrians. he manual is one of a series providing, in an accessible form, practical advice on the steps necessary for improving road safety.
Target audience
he manual provides practical advice for countries that want to reduce the incidence of road crashes involving drinking and driving, locally or at a national level. It is tar-geted at governments, non-governmental organizations and road safety practitioners, particularly those in low and middle-income countries where alcohol is consumed by a large proportion of the population. he list of possible users will vary according to the country and its current situation with regard to alcohol consumption patterns and road safety activity, but will include:
policy-makers and decision-makers members of the judiciary
politicians police oicers
road safety professionals health professionals
manufacturers, suppliers and retailers of alcohol beverages; owners of licensed premises and hospitality venues
employers in the public and private sectors non-governmental organizations
insurance industry personnel school and college teachers
researchers on road safety and alcohol-related harm instructors in driving and road safety.
Although aimed particularly at low and middle-income countries with little legisla-tion and few intervenlegisla-tion programmes, it is intended to be useful for all countries. •
• • • • • •
• • • • • •
Drinking and Driving: a road safety manual
In
tr
od
uc
tio
n
What does the manual cover and how should it be used?
Achieving reductions in drink-drive road crashes will typically involve working sys-tematically through a series of steps. Exactly how many steps are needed will depend on how much is already in place in a particular country in terms of legislation and intervention programmes.
his manual helps users identify which steps are relevant to their country’s situation, and then provides the practical advice needed to implement the steps. As well as focusing strongly on technical measures, the manual also describes the institutional structures that need to be in place for a programme aimed at reducing crashes involv-ing drinkinvolv-ing and drivinvolv-ing to be successful.
While alcohol-impaired pedestrians are known to be involved in some crashes, there is little practical experience in dealing with this as a road safety issue. his manual is therefore restricted to drinking and driving, including riding motorcycles.
What is covered?
Module 1 explains why interventions to address alcohol-related road crashes are needed. It describes how alcohol afects driving performance and contributes to crashes and resultant injuries among drivers, riders and pedestrians.
Module 2 guides the user through the process of assessing a country’s situation in relation to patterns of alcohol consumption and its impact on road crashes. he section outlines the data needed for a good diagnosis of the problem and for identii-cation of gaps in the mechanisms in place to address it.
Module 3 is about designing and implementing a drinking and driving programme, including how to gain political and community support for a programme through establishing a stakeholder working group. It also describes how to draw up plan of action that identiies the problem, sets objectives, timeframes and targets, and estimates the necessary resources. Module 3 also looks at a range of interventions for reducing the impact of drinking and driving, including laws and law enforcement, publicity campaigns and appropriate medical responses for casualties of crashes involving drinking and driving.
Module 4 is about assessing the impact of a programme in terms of the speciied programme objectives. his includes identifying the data that need to be collected before beginning a campaign.
Case studies, in the form of boxed text, are included throughout the manual. hese examples have been chosen to illustrate processes and outcomes, with experiences from a wide range of countries, relecting regional, cultural and socio-economic diversity.
XVIII
How should the manual be used?
he manual is not intended to be prescriptive, but rather adaptable to a particular country’s current needs. Each module contains lowcharts and checklists to help readers determine where their country stands with regard to crashes involving drink-ing and drivdrink-ing, and to take those steps oferdrink-ing the greatest potential for improve-ment. he modular structure of the manual is intended to help this process of using only the relevant sections of the document.
Readers are encouraged to read the entire manual; however, the various sections may be more relevant to some countries than to others. Nonetheless, all users will prob-ably beneit from reading Module 2, enabling them to assess their own situation and then pick particular actions to undertake. he choices made at this point will deter-mine which of the remaining sections are most useful.
What are the limitations of this manual?
his manual is not meant to be comprehensive. It draws upon the experience of its contributors to identify practical and efective steps that can be taken to prevent crashes involving drinking and driving, and thus partly relects the views of those involved in its production. here may well be successful interventions that are not reported here. Similarly, the case studies – used to illustrate processes, good practice and practical constraints – are not exhaustive but merely illustrate ideas presented in the main text.
As the manual aims primarily to provide guidance to countries in the early stages of developing and implementing programmes to prevent alcohol-related crashes, it does not provide extensive information on general alcohol issues. he manual concen-trates on the three main topics of law regarding drinking and driving, enforcement and public education. Efective actions on these topics – taken together – will have a beneicial efect. Other possible interventions, such as “alcolocks” (devices built into vehicles to prevent drunk drivers from using the vehicle), which are under develop-ment and trial in some high-income countries, are not covered.
his manual is restricted to impairment due to alcohol. Other reasons for impair-ment, such as drugs or fatigue, are not considered here. It also focuses on drinking and driving (including riding motorcycles). Impaired pedestrians are known to be a problem, but there are few practical examples about how to address this.
How was the manual developed?
he manual was based on a standard format developed by the four partner organiza-tions, the GRSP, WHO, the World Bank and the FIA Foundation for the Automo-bile and Society and was reviewed externally. he format was not meant to be rigid, but to provide a lexible structure that, where possible, would unify the series of manuals in their form and approach.
Drinking and Driving: a road safety manual
In
tr
od
uc
tio
n
XX
An advisory committee of experts from the diferent partner organizations oversaw the process of developing each manual and provided guidance on its content. A small editorial committee for each manual then coordinated its technical content.
An outline of this manual was produced by GRSP, as the project leader, with addi-tional support provided by the World Bank and WHO. Drating was undertaken by a team from ARRB and TRL, under contract to GRSP. Technical sections of the document were prepared by organizations or individuals with particular expertise in an area. hese people further developed the outline of their sections, reviewed the relevant literature and contributed to the technical content, ensuring it relected the latest scientiic views on good practice. he manual was subject to two rounds of peer review, and a near inal drat was also discussed in depth at two workshops with practitioners in India that led to further modiications.
Dissemination of the manual
his manual is being translated into a number of major languages, and countries are encouraged to translate the document into local languages. he manual will be disseminated widely through the distribution channels of all four organizations involved in the series of manuals.
he manual is available in PDF format to be downloaded free from the websites of all partner organizations. Visit GRSP’s website at www.grsproadsafety.org
How to get more copies
Further copies of this manual can be ordered from: Global Road Safety Partnership
c/o International Federation of Red Cross and Red Crescent Societies PO Box 372
17 Chemin des Crêts CH-1211 Geneva 19 Switzerland
E-mail: [email protected]
References
1. Odero W, Zwi AB. Alcohol-related traic injuries and fatalities in developing countries: a critical review of literature. London, Health Policy Unit, Department of Public Health, London School of Hygiene and Tropical Medicine, 1995.
2. Peden M et al., eds. World report on road traic injury prevention. Geneva, World Health Organization, 2004.
1:
Ne
ed
fo
r
a
pr
og
ra
mme
?
Why is a
drinking and driving
programme necessary?
1
Why is a drinking and driving
programme necessary?
1.1 Crashes involving drinking and driving worldwide . 3
1.1.1 Variations in crashes involving drinking and driving by country. . . 4 1.1.2 The economic impact of crashes involving drinking
and driving . . . 6
1.2 Why is drinking and driving a problem? . . . 6
1.2.1 The effects of alcohol on driving . . . 7 1.2.2 The effects of alcohol on risk of a crash . . . 7 1.2.3 The effects of alcohol in the post-crash phase . . . 9 1.2.4 How is alcohol measured? . . . 10
1.3 Who is most at risk of a crash involving drinking and driving? . . . 12
1.3.1 Demographic characteristics of drink-drivers . . . 12 1.3.2 Attitudinal characteristics of drink-drivers . . . 14 1.3.3 Patterns of alcohol use worldwide . . . 14 1.3.4 Characteristics of crash victims . . . 15
1.4 How can crashes involving drinking and driving be reduced? . . . 17
Summary . . . 19
Drinking and Driving: a road safety manual
1
|
W
hy
is
a
d
rin
ki
ng
a
nd
d
riv
in
g
pr
og
ra
m
m
e
ne
ce
ss
ar
y?
3
T
his moduleprovides the user with background information on the problem of crashes involving drinking and driving worldwide, as well as the rationale for interventions aimed at reducing such crashes. he information and recommenda-tions provided in this module are important tools for persuading political leaders and the public to support a programme that deals with drinking and driving.he sections in this module are structured as follows:
1.1 Crashes involving drinking and driving worldwide: he module begins by describing the magnitude of the problem, and how alcohol-related crashes are a leading cause of death and disability.
1.2 Why drinking and driving is a problem: his section describes what alcohol is and how it impacts driving performance. It shows the relationship between alcohol consumption and road traic crashes. his section also discusses how alcohol afects the assessment, management and rehabilitation of those involved in a motor vehicle collision.
1.3 Who is most at risk? Briely this section discusses some of the major charac-teristics and risk factors for drinking and driving. It also highlights the extent and patterns of drinking worldwide.
1.4 How can crashes involving drinking and driving be reduced? he module concludes by looking at the leading interventions for addressing drinking and driv-ing. hese include legislation, education and advocacy. Each of these interventions will be discussed in detail in the following modules.
As mentioned in the Introduction, this manual is focused on drinking and driving only, although alcohol plays a signiicant role in pedestrian collisions as well. How-ever, many of the principles and technical guidance that are provided in this manual apply equally well to vehicle drivers, motorcyclists and bicyclists, as well as pedestrians.
1.1 Crashes involving drinking and driving worldwide
Apart from a few countries where alcohol is prohibited, impairment by alcohol is an important factor inluencing both the risk of a road traic crash as well as the severity and outcome of the injuries that result from it. he frequency of drinking and driving varies between countries, but decades of research have shown that drink-drivers have a signiicantly higher risk of being involved in a road crash than drink-drivers who have not consumed alcohol.
•
•
•
Module 1: Why is a drinking and driving programme necessary?
4
1.1.1 Variations in crashes involving drinking and driving by country
In most high-income countries about 20% of fatally injured drivers have excess alcohol in their blood (1), i.e. blood alcohol concentration (BAC) in excess of the legal limit. In contrast, studies in low- and middle-income countries have shown that between 33% and 69% of fatally injured drivers and between 8% and 29% of non-fatally injured drivers had consumed alcohol before their crash (1).
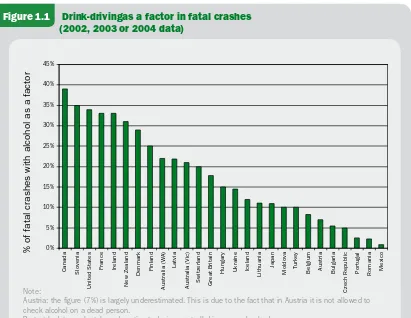
Figure 1.1 provides an overview of the role of alcohol in fatal crashes in selected countries.
Few countries have sophisticated surveillance systems to monitor the involvement of alcohol in all crashes. In addition, deinitions for what constitutes a drink-driving crash might difer between countries, as might the legal BAC limit or requirements for testing crash victims. For these reasons direct comparisons between countries are diicult to make. Bearing in mind some of these complications, studies from a selec-tion of countries indicate that:
Figure 1.1 Drink-driving as a factor in fatal crashes (2002, 2003 or 2004 data)
Note:
Austria: the igure (7%) is largely underestimated. This is due to the fact that in Austria it is not allowed to check alcohol on a dead person.
Portugal: data are largely underestimated, since not all drivers are checked.
Source: Unpublished data from: Working group on achieving ambitious road safety targets: responses to the survey on road safety performance, Joint OECD/ECMT Transport Research Centre, 2005.
% * &% &* '% '* (% (* )% )*
8VcVYV HadkZc^V
Jc^iZYHiViZh
;gVcXZ >gZaVcY
CZlOZVaVcY
9ZcbVg` ;^caVcY
6jhigVa^VL6
AVik^V
6jhigVa^VK^X Hl^ioZgaVcY <gZVi7g^iV^c
=jc\Vgn J`gV^cZ >XZaVcY
A^i]jVc^V
?VeVc
BdaYdkV Ijg`Zn 7Za\^jb 6jhig^V 7ja\Vg^V
8oZX]GZejWa^X
Edgij\Va GdbVc^V BZm^Xd
d[[ViVaXgVh]Zhl^i]VaXd]daVhV[VXidg
Drinking and Driving: a road safety manual
1
|
W
hy
is
a
d
rin
ki
ng
a
nd
d
riv
in
g
pr
og
ra
m
m
e
ne
ce
ss
ar
y?
5
between 26% and 31% of non-fatally injured drivers in South Africa have BAC levels exceeding the country’s limit of 0.08 g/100 ml (2);
in hailand, nearly 44% of traic injury victims in public hospitals had BAC levels of 0.10g/100ml or more (3), while an in-depth study of nearly 1000 motorcycle collisions revealed that alcohol was a factor in 36% of the collisions (4);
in Bangalore, India, 28% of crashes involving males over 15 years were attributable to alcohol (5);
in Colombia, 34% of driver fatalities and 23% of motorcycle fatalities are associ-ated with speed and/or alcohol (6);
in Sunsai and Dharari, Nepal, 17% of 870 road traic collisions were attributed to alcohol consumption. Of those drinking and driving, 50% were cyclists, 28% were motorcyclists, 17% bullock cart drivers and 5% truck drivers (7).
in the United States of America half a million people are injured and 17 000 killed every year in traic crashes involving drinking and driving. Almost 40% of all youth road traic fatalities are directly related to alcohol consumption (8).
in Sweden, the Netherlands and the United Kingdom, the proportion of fatally injured drivers with excess alcohol is around 20%, although the legal limits in these countries difer considerably, being 0.02 g/100 ml, 0.05 g/100 ml and 0.08 g/100 ml, respectively (9).
•
•
•
•
•
•
•
According to the South African national injury mortality surveillance system, there were 25 361 fatal injuries registered at 32 of the state mortuaries in 2001. This represents approximately 35% of all non-natural mortal-ity in South Africa in that year. Transport-related deaths accounted for 27% of all the fatal injuries.
Pedestrians were the group of road users most frequently killed (37.3%), followed by passengers of vehicles (17.4%), drivers (14.0%) and cyclists (3.1%).
Alcohol is a major risk factor for all types of fatal road trafic injury in South Africa. Tests for BAC level were conducted on 2372 (or 34.6%) of the 6859 transport-related deaths. More than half (51.9%) of all trans-port-related deaths had elevated levels of BAC, and of these positive cases, 91% recorded BAC levels of 0.05 g/100 ml or higher.
Pedestrians, followed by drivers, were most likely to be BAC-positive (see table below).
Pedestrian fatalities also had the highest mean BAC levels (0.20 g/100 ml). Over 50% of drivers killed had elevated BAC levels and the mean level for drivers – 0.17 g/100 ml – was more than three times South Africa’s current legal limit for driving (0.05 g/100 ml).
Source: (1)
BOX 1.1: Alcohol-related road trafic deaths in South Africa
Blood alcohol concentration (in g/100 ml)
Zero % 0.01–0.04 % 0.05–0.14 % 0.15–0.24 % ≥ 0.25 %
Pedestrians 37.5 5.4 12.0 20.5 24.7
Passengers 62.6 4.7 14.0 13.7 5.0
Drivers 48.2 5.3 18.2 18.8 9.5
Module 1: Why is a drinking and driving programme necessary?
6
1.1.2 The economic impact of crashes involving drinking and driving
Very little data is available on the costs of crashes involving drinking and driving. WHO has igures on the cost of chronic alcohol use for many countries (10), but the costs of road trauma are not presented separately. In the United States, the total economic cost of motor vehicle crashes in 2000 was estimated at US$ 230.6 billion, with drink-driving crashes accounting for US$ 51.1 billion or 22% of all economic costs (8). However, the United States and developing countries are not directly com-parable because of variables including transport infrastructure, diferences in safety standards, motorization growth rate and the economic demography of countries.
Applying recent data on the incidence of drink-driving crashes in developing coun-tries to estimates of the total cost of road crashes in those councoun-tries (as outlined in
the World report on road traic injury prevention) can establish robust estimates (1).
For example, in South Africa it has been estimated that alcohol is a factor in 31% of non-fatal crashes. Applying this igure to the estimated hospital costs attributed to road crashes for South Africa in the WHO report of US$ 46.4 million would give a total cost to the health system of around US$ 14 million for crashes involving drink-ing and drivdrink-ing.
In hailand, the total cost of road crashes has been estimated at $US 3 billion (11).
Recent estimates of alcohol involvement in that country indicate at least 30% of crashes are linked to alcohol, which means alcohol is a factor in costs to hailand of about $US 1 billion.
1.2 Why is drinking and driving a problem?
Drinking and Driving: a road safety manual
1
|
W
hy
is
a
d
rin
ki
ng
a
nd
d
riv
in
g
pr
og
ra
m
m
e
ne
ce
ss
ar
y?
7
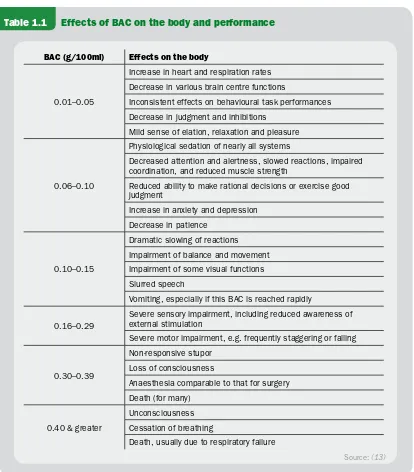
1.2.1 The effects of alcohol on drivinghe immediate efects of alcohol on the brain are either depressing or stimulating in nature, depending on the quantity consumed (see Table 1.1). Either way, alcohol results in impairment which increases the likelihood of a crash since it produces poor judgement, increased reaction time, lower vigilance and decreased visual acuity. Physiologically, alcohol also lowers blood pressure and depresses consciousness and respiration. Alcohol also has analgesic and general anaesthetic properties.
Alcohol can impair judgement and increase crash risk even at relatively low BAC levels. However, the efects become progressively worse as the BAC increases. Not only do judgement and reaction time sufer, but vision also deteriorates. Apart from its direct impact on crash outcomes, alcohol is believed to afect other aspects of driver safety such as seat-belt wearing, helmet use, and speed choice. Although detailed consideration of drugs other than alcohol has been deliberately omitted from this manual, the consumption of alcohol, due partly to its tendency to reduce inhibition, is oten associated with the use of other drugs which can impact upon driving performance (12).
1.2.2 The effects of alcohol on risk of a crash
Alcohol impairment has a signiicant efect on the crash risk of drivers, riders and pedestrians; it is routinely reported as one of the most serious contributing factors to road crashes in motorized countries.
Drivers who have been drinking have a much higher risk of involvement in crashes than those with no alcohol in their blood, and this risk grows rapidly with increas-ing blood alcohol concentration (see Box 1.1). For motorcyclists, havincreas-ing a BAC over 0.05 g/100 ml has been estimated to increase crash risk by up to 40 times compared to having a zero BAC (14).
What is alcohol?
The term “alcohol” in its purest sense denotes “ethyl alcohol or ethanol”, a liquid which is obtained from the action of yeast on sugar, but in colloquial terms it usually refers to “a drink such as beer, wine and whiskey that can make people drunk”.
Module 1: Why is a drinking and driving programme necessary?
8
Table 1.1 Effects of BAC on the body and performance
BAC (g/100ml) Effects on the body
0.01–0.05
Increase in heart and respiration rates Decrease in various brain centre functions
Inconsistent effects on behavioural task performances Decrease in judgment and inhibitions
Mild sense of elation, relaxation and pleasure
0.06–0.10
Physiological sedation of nearly all systems
Decreased attention and alertness, slowed reactions, impaired coordination, and reduced muscle strength
Reduced ability to make rational decisions or exercise good judgment
Increase in anxiety and depression Decrease in patience
0.10–0.15
Dramatic slowing of reactions Impairment of balance and movement Impairment of some visual functions Slurred speech
Vomiting, especially if this BAC is reached rapidly
0.16–0.29
Severe sensory impairment, including reduced awareness of external stimulation
Severe motor impairment, e.g. frequently staggering or falling
0.30–0.39
Non-responsive stupor Loss of consciousness
Anaesthesia comparable to that for surgery Death (for many)
0.40 & greater
Unconsciousness Cessation of breathing
Death, usually due to respiratory failure
Drinking and Driving: a road safety manual
1
|
W
hy
is
a
d
rin
ki
ng
a
nd
d
riv
in
g
pr
og
ra
m
m
e
ne
ce
ss
ar
y?
9
1.2.3 The effects of alcohol in the post-crash phaseIt is clear from the previous section that alcohol compromises driving performance and thus increases the risk of a road traic collision. But alcohol also has signiicant efects in the post-crash phase which should be borne in mind. hese are summarised in Box 1.3.
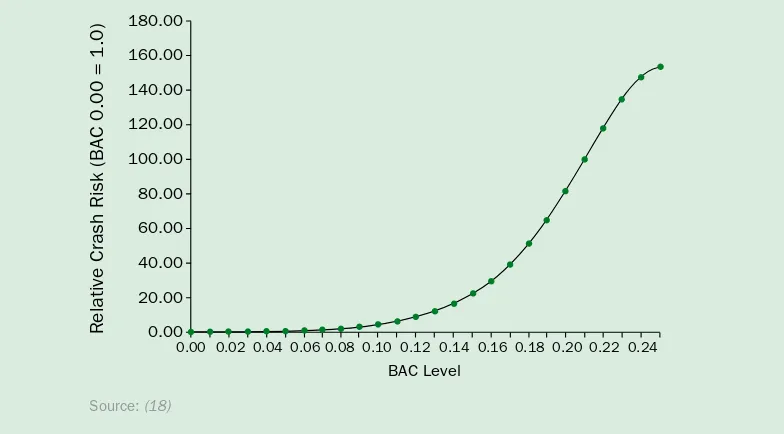
In 1964 a case-control study was carried out in Michigan in the United States known as the Grand Rapids study (15). It showed that drivers who had consumed alcohol had a much higher risk of involvement in crashes than those with a zero BAC, and that this risk increased rapidly with increasing blood alcohol levels. These results were corroborated and improved upon by studies in the 1980s, 1990s and in 2002 (16–18). These studies provided the basis for setting legal blood alcohol limits and breath content limits in many countries around the world.
[image:30.595.105.497.356.573.2]The studies found that the relative risk of crash involvement starts to increase signiicantly at a blood alcohol concentration level of 0.04 g/dl and that at 0.10 g/100 ml the crash risk relative to a zero BAC is approxi-mately 5, while at a BAC of 0.24 g/100 ml the crash risk is more than 140 times the risk relative to a zero BAC (see Figure 1.2).
Figure 1.2: Estimated relative fatality risk for drinking drivers by age and sex in single-vehicle crashes
BOX 1.2: Risk of drink-driver involvement in police-reported crashes
&-%#%% &+%#%% &)%#%% &'%#%% &%%#%% -%#%% +%#%% )%#%% '%#%% %#%%
GZaVi^kZ8gVh]G^h`768%#%%2&#%
%#%% %#%' %#%) %#%+%#%- %#&% %#&' %#&) %#&+ %#&- %#'% %#'' %#')
768AZkZa
Module 1: Why is a drinking and driving programme necessary?
10
1.2.4 How is alcohol measured?
Blood alcohol concentration is central to establishing a link between alcohol and road traic crashes. Investigations into the role of alcohol in road crashes require that those where alcohol played a causal role be diferentiated from those where it didn’t. Although it is oten diicult to attribute a crash to a particular cause or causes, deci-sions as to whether or not a crash was alcohol-related are oten based on how much, if any, alcohol was present in the bloodstream of the road users involved.
he amount of alcohol that is contained within the bloodstream can be measured by testing a small sample of blood or urine, or through analysis of exhaled breath. he amount of alcohol within the bloodstream is described in terms of BAC. BAC is usu-ally measured as:
grams of alcohol per 100 millilitres of blood (g/100 ml)
milligrams of alcohol per 100 millilitres of blood (mg/100 ml)
grams of alcohol per decilitre (g/dl)
milligrams of alcohol per decilitre (mg/dl) or other appropriate measure.
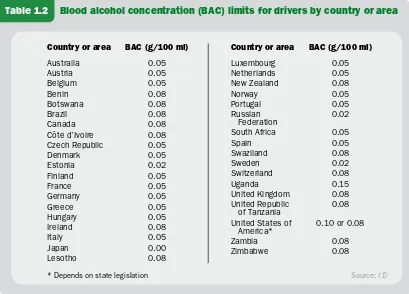
Legal BAC levels for driving vary from country to country, or state to state, through-out the world – ranging from 0.02 g/100 ml to 0.10 g/100 ml (see Table 1.2).
For the remainder of this manual, BAC is described in terms of grams of alcohol per 100 millilitres of blood.
• • • •
•
Alcohol intoxication complicates the assessment and management of patients. The effects of alcohol can mimic the symptoms of a head injury.
Alcohol intoxication predisposes the patient to more severe injuries. Intoxicated patients may not report pain or tenderness.
Alcohol may interact with medications, particularly those used for pain relief and sedation.
Alcohol intoxication can complicate surgery and can influence the anaesthetist’s choice of anaesthetic drug.
Alcohol exacerbates underlying chronic diseases.
Patients with alcohol problems may have underlying medical and/or psychiatric conditions which can complicate their management.
Alcoholism intoxication may exacerbate pre-existing conditions such as cardiac disease, impaired blood clotting and infectious diseases.
Alcohol increases recidivism.
Patients who are alcohol positive at the time of their injury are greatly at risk for subsequent re-injury. Among drink-driving offenders, many repeatedly re-offend.
Alcohol complicates outcome.
Intoxicated patients have an increased likelihood of sustaining some type of complication during their recovery phase – most notably an infection such as pneumonia.
•
▷ ▷ ▷ ▷ ▷
•
▷ ▷
•
▷ ▷
•
▷
Drinking and Driving: a road safety manual
1
|
W
hy
is
a
d
rin
ki
ng
a
nd
d
riv
in
g
pr
og
ra
m
m
e
ne
ce
ss
ar
y?
11
Breath alcohol concentration (BrAC), in contrast, is expressed as the weight of alcohol, measured in grams, in 210 litres of breath, or, measured in milligrams, in 210 millilitres of breath. here are known relationships between BrAC and BAC, which are used to relate breath alcohol tests to BAC and hence impairment levels.
Alcohol content in blood can be directly measured by a hospital laboratory. More commonly in law enforcement investigations, BAC is estimated from breath alcohol concentration (BrAC) measured with a machine commonly referred to as a breatha-lyser (note that diferent machines may have diferent conversion factors applied to relate BrAC to BAC).
here is accurate correspondence between blood alcohol and breath alcohol levels
(20). Because of the ease of administration, breath alcohol is more commonly meas-ured in the road safety context.
[image:32.595.98.507.120.414.2]Alcohol intoxication may also be assessed by trained medical staf in emergency units using clinical signs and symptoms.
Table 1.2 Blood alcohol concentration (BAC) limits for drivers by country or area
Country or area BAC (g/100 ml)
Australia 0.05 Austria 0.05 Belgium 0.05 Benin 0.08 Botswana 0.08 Brazil 0.08 Canada 0.08
Côte d’Ivoire 0.08 Czech Republic 0.05
Denmark 0.05 Estonia 0.02 Finland 0.05 France 0.05 Germany 0.05 Greece 0.05 Hungary 0.05 Ireland 0.08 Italy 0.05 Japan 0.00 Lesotho 0.08
Country or area BAC (g/100 ml)
Luxembourg 0.05
Netherlands 0.05
New Zealand 0.08
Norway 0.05
Portugal 0.05
Russian
Federation 0.02
South Africa 0.05
Spain 0.05
Swaziland 0.08
Sweden 0.02
Switzerland 0.08
Uganda 0.15
United Kingdom 0.08 United Republic
of Tanzania 0.08 United States of
America* 0.10 or 0.08
Zambia 0.08
Zimbabwe 0.08
Source: (1)
Module 1: Why is a drinking and driving programme necessary?
12
1.3 Who is most at risk of a crash involving drinking
and driving?
Road users, who are either repeat “ofenders” or irst time “ofenders” with a very high BAC, constitute the highest risk groups for drinking and driving. Research on high risk road user groups has typically classiied them in terms of their demographic characteristics or attitudinal variables.
1.3.1 Demographic characteristics of drink-drivers
In terms of demographic characteristics, a consistent picture of drink-drivers emerges across a number of studies (22). hese drivers are characterised as being:
male
aged 18–24 years old
from a low socio-economic grouping single or divorced
in a blue collar occupation
of low education and limited literacy of low self-esteem.
• • • • • • •
Evidence of alcohol involvement determined by level of intoxication
The International Classiication of Disease (version 10) classiies the levels of alcohol intoxication as:
• mild alcohol intoxication – smell of alcohol on breath, slight behavioural disturbance in functions and responses, or slight dificulty in coordination.
• moderate alcohol intoxication – smell of alcohol on breath, moderate behavioral disturbance in functions and responses, or moderate dificulty in coordination.
• severe alcohol intoxication – severe disturbance in functions and responses, severe dificulty in coordination, or impaired ability to cooperate.
• very severe alcohol intoxication – very severe disturbance in functions and responses, very severe dificulty in coordination, or loss of ability to cooperate.
Drinking and Driving: a road safety manual
1
|
W
hy
is
a
d
rin
ki
ng
a
nd
d
riv
in
g
pr
og
ra
m
m
e
ne
ce
ss
ar
y?
13
In comparison, motorcyclists with BAC levels above the legal limit of 0.05 g/100 ml in the state of Victoria in Australia, compared with those below the alcohol limit
(21) were found to be: male
26–40 years old
10–20 years licence experience riding without a helmet unlicensed
In the same study, the Australians found that intoxicated pedestrians were more likely to be male and between 31 and 59 years of age (23). No other characteris-tics appear to diferentiate well between intoxicated and non-intoxicated crash-involved pedestrians.
• • • • •
Who is most at risk of a drink-drive crash?
Drivers and motorcyclists with any level of blood alcohol content (BAC) greater than zero are at higher risk of a crash than those whose BAC level is zero.
For the general driving population, as the BAC level increases from zero the risk of being involved in a crash starts to rise signiicantly at a BAC level of 0.04 g/100 ml.
Inexperienced young adults driving with a BAC level of 0.05 g/100 ml have a 2.5 times higher risk of a crash compared with more experienced drivers.
Young adults in the 20–29 years age group were estimated to have three times the risk compared with drivers aged 30 years and above, at all BAC levels.
Teenage drivers had more than ive times the risk of a fatal crash compared with drivers aged 30 and above, at all levels of blood-alcohol content.
Teenage drivers with a BAC of 0.03 g/100 ml carrying two or more passengers
were 34 times more at risk of a crash compared with drivers aged 30 years or more, with no alcohol, driving with one passenger.
Alcohol consumption by drivers puts pedestrians and riders of motorized two-wheelers at risk.
Module 1: Why is a drinking and driving programme necessary?
14
1.3.2 Attitudinal characteristics of drink-drivers
Australian research has found that the population can be divided into four groups based largely on three key factors:
their fear of being detected driving while impaired by alcohol; their fear of crashing;
their acceptance of the 0.05 g/100ml BAC limit (24).
he four groups were characterised as:
“believers”, who had high fear of being caught or crashing, and who had the high-est level of acceptance of a 0.05 BAC and associated countermeasures. hey drank least on their last “drinking occasion”;
“pressured”, who also had high fear, but had lower acceptance of the 0.05 BAC limit and enforcement. hey experienced social pressure to keep up with the group while drinking.
“deterred”, who had lower levels of fear, but accepted the need for the 0.05 BAC limit and countermeasures;
“opposers” who had low levels of fear of detection and of crashing, and low levels of acceptance of the 0.05 BAC and countermeasures. hey drank most on the last “drinking occasion”, and reported driving while impaired by alcohol more fre-quently than other groups.
he study concluded that “opposers” may well be the group with the highest risk of being involved in a drink-driving crash and are also likely to be those whose behav-iour is most diicult to change.
1.3.3 Patterns of alcohol use worldwide
Patterns of alcohol use and the incidence of drink-driving vary considerably world-wide. In many countries where alcohol is consumed, those who drink also drive. Understanding drinking patterns and preventing hazardous and harmful alcohol consumption is a key component in reducing alcohol-related harm overall, including harm resulting from road crashes. Factors inluencing the level of alcohol consump-tion in a country include environmental, socio-economic, religious, personal and behavioral issues.
he WHO Global status report on alcohol 2004 examined the rates of abstainers, heavy drinkers and binge drinkers across countries and found considerable variations
(10). For example, the proportion of abstainers among the total adult population reported across countries ranged from a low of 2.5% in Luxembourg to a high of 99.5% in Egypt. Heavy drinkers (those who exceed a certain daily volume or quantity per occasion, or who drink every day) ranged from a low of 1.4% in India to a high of 31.8% in Colombia.
• • •
•
•
•
Drinking and Driving: a road safety manual
1
|
W
hy
is
a
d
rin
ki
ng
a
nd
d
riv
in
g
pr
og
ra
m
m
e
ne
ce
ss
ar
y?
15
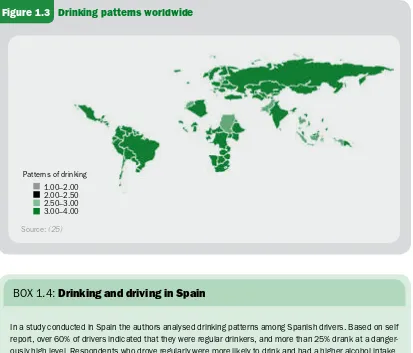
Apart from overall levels of consumption, drinking patterns are also relevant to the incidence of drinking and driving. Figure 1.3 shows the diference in drinking pat-terns in the world, ranging from 1 (least risky) to 4 (most risky). A large portion of risky drinking patterns appear to occur in many low or middle-income countries.
1.3.4 Characteristics of crash victims
Crashes involving drinking and driving oten exhibit a number of characteristics.
Single vehicle crashes and high speed – drink-driving crashes oten involve high speed and a single vehicle running-of the road. Many of these crashes also result in the vehicle hitting a ixed roadside object. In urban areas these can be signs or electricity poles, while in rural areas it is usually trees, culverts, bridge ends and fence posts.
In a study conducted in Spain the authors analysed drinking patterns among Spanish drivers. Based on self report, over 60% of drivers indicated that they were regular drinkers, and more than 25% drank at a danger-ously high level. Respondents who drove regularly were more likely to drink and had a higher alcohol intake. Most drinkers reported driving after drinking and 145 acknowledged having driven “in a drunken state” during the previous year. Those who drank were more likely to have been involved in crashes.
Source: (26)
[image:36.595.99.512.204.557.2]BOX 1.4: Drinking and driving in Spain Figure 1.3 Drinking patterns worldwide
Source: (25)
Module 1: Why is a drinking and driving programme necessary?
16
Night and/or weekend crashes – drink-driving crashes occur more oten at night (when more alcohol is consumed) and generally on weekends or periods of high leisure activity.
Increased severityof injury – this is partly because once a crash and the injury-causing impact has occurred, the existence of alcohol in the body of the crash victims works to limit the extent and level of recovery from injury.
Although much of the research on alcohol-related crashes has focused on car crash-es, many of the characteristics of alcohol-related motorcycle crashes are the same. A recent study in hailand (4) indicated that compared to non-drinking riders, drinking riders tended to crash at night, to have more non-intersection crashes and more crashes on curves, were more likely to lose control, run of the road, violate a red signal, be inattentive, and for rider error to be a contributing cause of the crash. Drinking riders were ive times more likely to be killed as non-drinking riders.
Compared to collisions involving non-impaired pedestrians, those involving alco-hol-impaired pedestrians have been shown to be more likely to occur:
during hours of darkness in business or commercial areas
on roads of greater than 50 km/h speed limit at mid-block locations
as a result of the pedestrian disobeying traic laws (28).
• • • • •
Alcohol and injury severity in Bangalore, India
The National Institute of Mental Health and Neurosciences, Bangalore [NIM-HANS] estimated that 21% of people who sustained brain injuries during a crash were under the inluence of alcohol (physician conirmed diagnosis) at the time and 90% had consumed alcohol within three hours prior to the crash. Patients with injuries subsequent to alcohol intoxication sustained a more injuries that were more severe than the non-intoxicated group. Compared to the non-intoxi-cated group, more of the intoxinon-intoxi-cated group required surgical interventions (8% and 5% respectively), more died (6.5% and 4% respectively) and more sustained neurological disabilities at discharge from hospital (13% and 9%).
Drinking and Driving: a road safety manual
1
|
W
hy
is
a
d
rin
ki
ng
a
nd
d
riv
in
g
pr
og
ra
m
m
e
ne
ce
ss
ar
y?
17
1.4 How can crashes involving drinking and driving
be reduced?
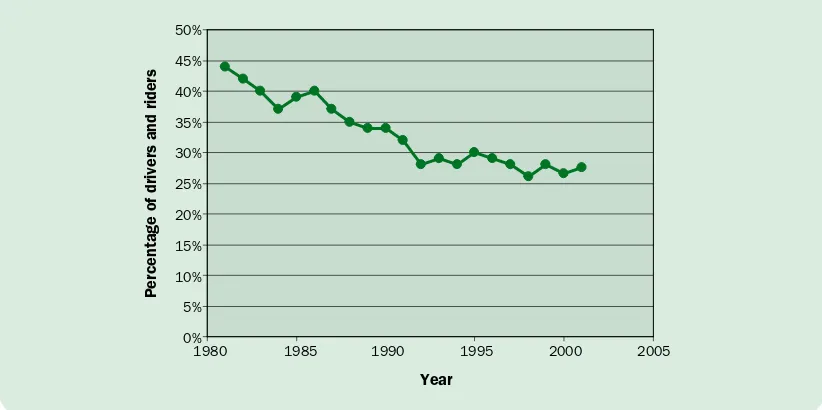
Over the past few decades many industrialised countries have been successful in reducing the number of crashes caused by drink-drivers (see Box 1.5). Information about these experiences can be used to guide programmes in low and middle-income countries where alcohol is oten an important risk factor for road traic crashes. However, it must be recognised that low and middle-income countries today face additional problems on their roads, meaning that these lessons cannot be simply transferred between countries, but will need to be adapted to suit diferent contexts.
Australia embarked on a sustained programme to tackle crashes involving drinking and driving from the mid-1970s onwards. Substantial research information on the impairment effects of alcohol was collected, and this led to support for legislation setting out a maximum BAC level for drivers. In Australia the individual states, operating under the federal system of government, are responsible for most road safety issues. Consequently, the legal level adopted was not uniform across all states. Some adopted 0.05 BAC and oth-ers adopted 0.08 BAC.
Following the adoption of legal limits, large-scale police enforcement of these limits was undertaken in the 1980s. This was supported by a range of other interventions, including publicity, community announcements, community activity programmes, variations in alcohol licensing and distribution arrangements for alcohol. There was also ongoing monitoring of performance involving blood tests on drivers involved in crashes.
[image:38.595.97.508.545.750.2]Over this 30-year period, alcohol as a factor in crashes has been almost halved in Australia (see Figure 1.4), and community attitudes to drink-driving have changed substantially so that currently there is a strong com-munity view that such behaviour is socially irresponsible.
Figure 1.4 Percentage of fatally injured drivers and motorcycle riders with a BAC of 0.05 gm/100 ml or greater, Australia 1981–2001
BOX 1.5: Australia reduces drink-driving
EZgXZciV\Zd[Yg^kZghVcYg^YZgh
NZVg
&.-% &.-* &..% &..* '%%% '%%*
*%
)*
)%
(*
(%
'*
'%
&*
&%
*
Module 1: Why is a drinking and driving programme necessary?
18
Road crashes involving drinking and driving are a feature of the road-injury proile in many countries, and alcohol consumption appears to be an element of road user behaviour that is very diicult to address. Apart from the adverse inluence of alcohol as a contributor to road crashes, the presence of alcohol in the body of a road crash victim adversely afects the diagnosis, management, and treatment of injuries. Coun-tries looking to tackle this problem should consider the experiences of other coun-tries where crashes involving drinking and driving have been reduced substantially. heir success generally rests on six pillars:
strong political commitment to prevent drink-driving (see Box 1.5);
legislation that clearly deines illegal (for driving) levels of BAC and penalties for drinking and driving ofences;
implementing “good practice”;
strong and well-publicised enforcement campaigns;
public education to change attitudes to drinking and driving;
strict and switly enforced penalties for those caught breaking the law.
he public must know why drinking and driving is both unsafe and anti-social, be aware that there are laws in place, perceive a high risk of being caught if they break the law, and know that if they are caught, there will be a heavy price to pay.
Even where the problem of crashes involving drinking and driving is considered to be relatively minor, for example, where motorization levels are low, countries should be proactive in monitoring the situation so that it can be managed and prevented from escalating.
• •
• • • •
In 2002, French President Jacques Chirac declared publicly that road safety would be one of the three major priorities of his presidential mandate. This political leadership is essential if dificulties with new, harsher, legislation are to be overcome. Penal-ties for driving under the inluence of alcohol were increased and new laws were introduced.
France’s road safety performance over the period 2002–2004 is spectacular – road deaths decreased by 32%. This is attributed to a combination of meas-ures, but focusing particularly on speeding and alcohol-impaired driving (27). With respect to alco-hol-related crashes, measures included reducing
the permitted BAC level from 0.08 (set in 1978) to 0.05, and 0.02 for bus drivers. Enforcement was increased – for example breath tests were increased by 15%. Stricter sanctions were introduced, increas-ing penalty points from 3 to 6 for a BAC between 0.05 and 0.08 (12 points lead to disqualiication). As a result, alcohol-impaired driving decreased dra-matically – almost 40% fewer incidents in 2004 compared with 2003. One researcher attributes 38% of the lives saved between 2003 and 2004 to improved behavior in terms of alcohol-impaired driving (29).
Drinking and Driving: a road safety manual
1
|
W
hy
is
a
d
rin
ki
ng
a
nd
d
riv
in
g
pr
og
ra
m
m
e
ne
ce
ss
ar
y?
19
Summary
Drink-driving is a major road safety problem in many countries, although the extent of the problem is oten unclear – especially in low and middle-income countries.
Even in quite modest amounts, alcohol impairs the functioning of several proc-esses required for safe road use, including vision and motor skills.
Alcohol impairment increases the chance that all road user groups, including driv-ers, riders and pedestrians, will be involved in a crash.
Research indicates that crashes involving drinking and driving have a number of characteristics, but these may difer considerably between regions.
Experiences of both Australia and France show that concerted efort to implement efective interventions can have substantial efects on the level of injuries sustained in drink-drive crashes.
A number of countermeasures to reduce drinking and driving have been systemati-cally evaluated and shown to have a positive efect on reducing the occurrence of drink-driving.
•
•
•
•
•
•
What works to reduce drink-driving?
The following prac
![Seat-belts and child restraints : a road safety manual for decision-makers and practitioners - [ BUKU ]](data:image/gif;base64,R0lGODlhAQABAIAAAP///wAAACH5BAEAAAAALAAAAAABAAEAAAICRAEAOw==)