Genetics Algorithm for 2D-MFCC Filter Development
in Speaker Identification System Using HMM
Agus Buono'" , WisnuJatmiko", Benyamin Kusumoputro''
'Computational Intelligence Research Lab, Dept. of Computer Science, Bogor Agriculture University Drarnaga Campus, Boger-West Java, Indonesia
bCornputational Intelligence Research Lab, Faculty of Computer Science, University ofIndonesia, Depok Campus, Depok 16424, PO.Box 3442, Jakarta, Indonesia
[email protected], [email protected], [email protected]
zyxwvutsrqponmlkjihgfedcbaZYXWVUTSRQPONMLKJIHGFEDCBA
Abstract-In this paper, we introduced the using of Genetics Algorithm to optimize the construction of a 2D filter in 2D-MFCC technique for speaker identification system. The 2D filter construction was very essential for processing the bispectrum data which is represented in 2D space instead of the usual 1D power spectrum. By using the 2D filter, the conventions; ;~;dden· Markov Model could be used as ih~ speaker classifier for processing 2D bispectrum data that was robust to noisy environment. The experimental comparison with ID-MFCC technique and 2D-MFCC without GA optimization shows that a comparable high recognition for original uttered voice. However, when the uttered voice buried in Gaussian noise at 20 dB, the developed 2D-MFCC shows in higher recognition of 88.5% whilst only 59.4% and 70.5% for 1D-MFCC and 2D-MFCC without GA, respectively.
Index Terms-Mel-Frequency Cepstrum Coefficients, Bispectrum, Hidden Markov Model, Genetics Algorithm.
1. Introduction
We have developed a 2D filter construction method for processing bispectrum data for speaker identification system based on Hidden Markov Model. This 2D-MFCC method was developed base on the conventional ID-MFCC that was reliable method for processing power spectrum data, but shows lower recognition rate when applied to identify speaker under noisy environment. Our experimental result shown that the used of2DMFCC method in speaker identification system gave high recognition rate, i.e. 99.4% for speech signal without addition by noise [1].
Since the bispectrum value is theoretically robust to Gaussian noise [2], which can be empirically proved by researchers such as in [3][4][5], the developed 2D-MFCC should also be robust to Gaussian noise, that could lead to a robust speaker recognition system under noisy environment. The filter development in MFCC method was derived by mimicking the behavior of human ear. In this scheme, the acoustic frequency is spaced by two
category, i.e. linearly spaced in low frequency «I KHz) and logarithmically spaced for higher frequency (>1 KHz). As we have shown in the previous paper, that the 2DMFCC shown high recognition rate for speech signal without noise addition, however, when it is used for processing a speech signal buried in 20 dB of Gaussian noise, the recognition rate drop significantly, i.e. 70.4%.
In order to increase the performance of 2D-MFCC under harsh noisy condition, we then developed the filter construction that is driven by the dynamic change of the data. Genetics algorithm is used to optimized the filter characteristics in such that the distance between the feature vector for the speech signal without noise addition with the feature vector for the speech signal with Gaussian noise addition will be as small as possible. The remainder of this paper is organized as follows: In section 2, we formulate the genetics algorithm for 2D-MFCC filter development. Section 3 present the experimental setup and results for a data set consisting 10 speakers with 80 utterances of each to demonstrate the effectiveness of the proposed method. Finally, section 4 is dedicated to a summary of this study and suggestions for future research directions ..
2. Filter Development of 2D-MFCCzyxwvutsrqponmlkjihgfedcbaZYXWVUTSRQPONMLKJIHGFEDCBA
-. ....,.•...
-.-~7"'>•• '
2.1. Filter Development
Filters are essential in processing the uttered speech signal, in which M filters are necessary in processing signal in 1D-MFCC method and MxM filters for 2D-MFCC, respectively. These filters are used to transform the power spectrum (1D) or bispectrum (2D) speech signal into their mel spectrum. The standard ID-MFCC used a triangular filter with height of I and three vertex
at point (!i.J,O),
zyxwvutsrqponmlkjihgfedcbaZYXWVUTSRQPONMLKJIHGFEDCBA
if.
1), and (/i+J,O) for the lh filter which can be shown in Figure 1. In order to develop M filters,we have to determine M+1 center points. The distance between two adjacent center point of filters is determined by mimicking the behavior of human ear's perception, in which a series of psychological studies have shown that the human perception of the frequency contents of
Figure 1. A triangular filter with height I
Thus for each tone ofzyxwvutsrqponmlkjihgfedcbaZYXWVUTSRQPONMLKJIHGFEDCBAII voice signalwith an actual
frequency
zyxwvutsrqponmlkjihgfedcbaZYXWVUTSRQPONMLKJIHGFEDCBA
f( measut~d inHz),can also be represented as a subjective pitch in another frequency scale, called the'mel' (from Melody) scale [6]. The actual frequency scale and its mel frequency scale have two different relationships according to a certain level of the actual
frequencyzyxwvutsrqponmlkjihgfedcbaZYXWVUTSRQPONMLKJIHGFEDCBAf When the actual frequencyfis below 1kHz,
then the relationship is linear, and when thef is above
1kHzthe relationship become logarithmic [6J, which can be written as:
I."
=2595*log(1+1-)
(1)m,1 10 700
These relationships can be illustrated by Figure 2 below:
••
zyxwvutsrqponmlkjihgfedcbaZYXWVUTSRQPONMLKJIHGFEDCBA
1500] III
"ii 1000
::E
500
c
0 1000 2000 3000 4000 5000
Frequency
Figure 2. Curve relationship between the actual frequency scale and its mel frequency scale
Detail 'algorithm for develop those M filters is presented in [IJ.
2.2. Genetics Algorithm
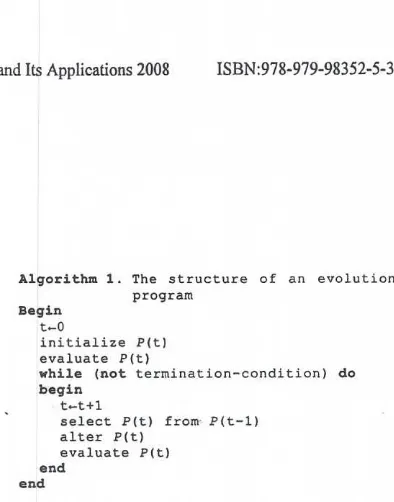
Genetics algorithm is one class of an evolution programming. It is defined as a technique for searching the optimum parameters through a space domain by imitating the principles of natural evolution [7]. Algorithm 1 gives the structure of an evolution program that usually used in GA.
Algorithm 1. The structure of an evolution program
Begin t~O
initialize pet) evaluate pet)
while (not termination-condition) do begin
t~t+I
select pet) from P(t-I) alter pet)
evaluate pet) end
end
It is a probabilistic algorithm which maintains a
population of individuals,
P(t):::; {x;, x~,...,x:}
foriteration of t.Each individual represents a potential
solution to the problem at hand. Each solution
x:
isevaluated to give some measure of its "fitness". Then, a new population (iteration t+1) is formed by selecting the more fit individuals (select step). Some members of the new population undergo transformations (alter step) by means of "genetic" operators to form new solutions. There are unary transformations m,(mutation type), which create new individuals by a small change in a single individual
(mi:S-7S ), and higher order transformations C j
(crossover type), which create new individuals by combining parts from several (two or more) individuals (C j:S xS x ... xS -7S ). After some number of generations the program converges - it is hoped that the best individual represents a near-optimum (reasonable) solution [6J .
2.2. Filter Optimization by Genetics Algorithm In 2D-MFCC process, we need a set of 2D filters to transform bispectrum data value of a certain frame into the mel-spectrum data value through domain space FJxF2, where FJ> F2 are frequency on their 2
dimensions, respectively. Considered the triangular filter for each dimension (FI and F2), and the 2D
filter for the same center point can be constructed by those two filters to be a pyramid-filter with its centered at(fj,h ), with fiC FJ and h C F2• Then it is
center with the next
zyxwvutsrqponmlkjihgfedcbaZYXWVUTSRQPONMLKJIHGFEDCBA
(i+ 1)'h filter center, withi=2.3,4 ... M
Chromosome Representation
As already written above, a set of filters for a certain
axis
zyxwvutsrqponmlkjihgfedcbaZYXWVUTSRQPONMLKJIHGFEDCBA
(F I or F }) can be identify by determine their consecutive distance X I, X }, X j, ... , and X M + !' Forrepresenting the optimized set of these filters that will be used in the 2D-MFCC, the distance between two filters center is coded by using binary digit. To that purpose, each distance X is coded by 7 binary digit, and the chromosome that represents a set of filter is coded by binary digit with length of7*(M+ 1)
digit. The first seven digits for X I, the second of
seven digits for X }, and so on. Figure 3 gives an
illustration of this filter coding.
As can be seen in this figure, suppose we have four triangular filters for a certain axis. wi.h its center 2.5, 4.5, 6.5 and 0,respectively, with the maximum frequency F ie 10. Then xI=2.5, x}=4.5-2.5=2, xj=6.5-4.5=2, x4=8-6.5=J.5, and x5=JO-8=2. The chromosome in our GA system then consist of 5 locus, i.e.X I. X }, xi, X 4 , and X 5 , in which each locus is
coded by binary digit with length of 7, to be 7*5=35 digit, as show in the figure.
The goal of optimizing the filtering process is to have the optimized filter design so that the output of feature extraction process after filter process for a uttered speech signal buried within a Gaussian noise is similar with the one without noise addition. This filter design can be illustrated as:
zyxwvutsrqponmlkjihgfedcbaZYXWVUTSRQPONMLKJIHGFEDCBA
I
zyxwvutsrqponmlkjihgfedcbaZYXWVUTSRQPONMLKJIHGFEDCBA
Distance of two consecutive filter centers:
x1=2.S x2=2 x3=2 x4-1.S x5=2
I
o ()0 0 I o
0 " 00001
o 0 0 0 0
o I 2J
I I C;;]l
o o 2
o ( 0 0 I
I
chromosome:I
0000101000010000001010000011000010
Figure 3. Illustration of coding a set of filter intQ chromosome with binary representation .. ,..
Fitness Function
The Fitness function is developed so that for any speech signal input (with or without noise), the output offeature extraction process after filtering process will be similar to the one without noise. The develop set of filter is then bounded by:
a. The distance between the feature vector of the original signal (without noise addition) with the feature vector of signal buried by noise is determined to be as small as possible.
.b, The distance between the feature vector of original signal (without addition by noise) with the feature vector of addition noise signal is determined to be as high as possible.
This fitness function can be mathematically formulated as follow:
f(i) =d(sl,s3) *d(s2,s4)
d(sl,s2)
*
d(s3,s3) (2) where:s 1: bispectrum signal without noise addition s2 : bispectrum signal buried by noise of 20 dB s3 : s2 subtracted by sl
s4: bispectrum of noise signal of 20 dB
dta.b)distance between feature vector ofbispectrum 0
with feature vector ofbispectrum b
Selection
In order to select the winning chromosome in population t,P (t), a roulette wheel is used. Chance for any chromosome have to be selected is proportional to their fitness value.
Crossover
Crossover technique was used to alter two chromosomes into their offspring, and in this research, an arithmetic crossover technique is utilized. SupposeX and Yare the two parents, that can be written as:
X=(X"XZ,X3,"" XM+I) Y=(y"YZ.Y3, ... , YM+l)
then, by using an arithmetic crossover technique, their offspring are:
X'= [ax,+(l-a)y,Uax, +(l-a)y,1[ax, +(I-a)y,l ,[ax"+(\-a)y"
II
Y'= [ay,+ (1-a)x,l[ay, + (\ -a)x,1[ay,+ (1-a)x,l ,[ay"+(1- a)x"
II
where oC(O,1) Mutation
process is called inversion technique, which is used in this research. The inversion technique begin with a selection of certain chromosome to be mutated. Then,
generate two integer numbers
zyxwvutsrqponmlkjihgfedcbaZYXWVUTSRQPONMLKJIHGFEDCBA
p and q randomly, withp .zyxwvutsrqponmlkjihgfedcbaZYXWVUTSRQPONMLKJIHGFEDCBA
qC[O.M+ 1], and M the number of the filter used. The mutation process is done by inverting the order of locus between selected points. The inversion process can be
illustrated in Figure 4.
zyxwvutsrqponmlkjihgfedcbaZYXWVUTSRQPONMLKJIHGFEDCBA
X = (X l,X :z,X 3t ... , X l-1
X '= (X l,X 2,:K 3, ... , X i-l
Figure 4.. Inversion process to alter chromosome X into its offspring X'
After filter design is optimized by using genetic algorithms, a set of filter is then selected. Figure 5 presents a comparison of a set of filter that was constructed by a standard filter design (a)and by the
proposed filter design (b).
zyxwvutsrqponmlkjihgfedcbaZYXWVUTSRQPONMLKJIHGFEDCBA
(a)
Figure 5. A comparison between standard filter (a) with filter developed by GA (b)
3. Experimental Setup end Re~ult
3.1. Experimental Setup
The proposed method was then used for speaker identification system to classify a set of data that consists of ten speakers. Speech data and experimental setup is
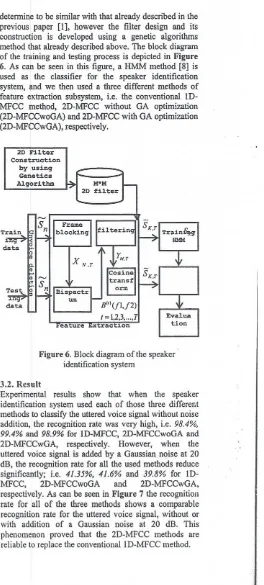
determine to be similar with that already described in the previous paper [I], however the filter design and its construction is developed using a genetic algorithms method that already described above. The block diagram of the training and testing process is depicted in Figure " 6. As can be seen in this figure, a HMM method [8] is
used as the classifier for the speaker identification system, and we then used a three different methods of feature extraction subsystem, i.e. the conventional ID-MFCC method, 2D-MFCC without GA optimization (2D-MFCCwoGA) and 2D-MFCC with GA optimization
(2D-MFCCwGA), respectively.
zyxwvutsrqponmlkjihgfedcbaZYXWVUTSRQPONMLKJIHGFEDCBA
20 Filter Construction
[image:4.597.304.568.185.770.2]by using Genetics Algorithm
Figure 6. Block diagram ofthe speaker identification system
3.2. Result
Experimental results show that when the speaker identification system used each of those three different methods to classify the uttered voice signal without noise addition, the recognition rate was very high, i.e. 98.4%. 99.4% and 98.9% for 1O-MFCC, 2D-MFCCwoGA and 2D-MFCCwGA, respectively. However, when the uttered voice signal is added by a Gaussian noise at 20 dB, the recognition rate for all the used methods reduce significantly; i.e. 41.35%, 41.6% and 39.8% for
10-MFCC, 2D-MFCCwoGA and 2D-MFCCwGA,
98.38
no
zyxwvutsrqponmlkjihgfedcbaZYXWVUTSRQPONMLKJIHGFEDCBA
~.
90~
80 70
e 60 ~ 50 C 40 a! 30 0 20 u II> o
II:: 0
"o-MFCC 20- 20-M FCCwGA
MFCCwoGA
[image:5.605.30.546.8.842.2]• without addition bynoise Il with addition bynoise
Figure 7. Recognition rate for signal with and without addition by noise for the three methods
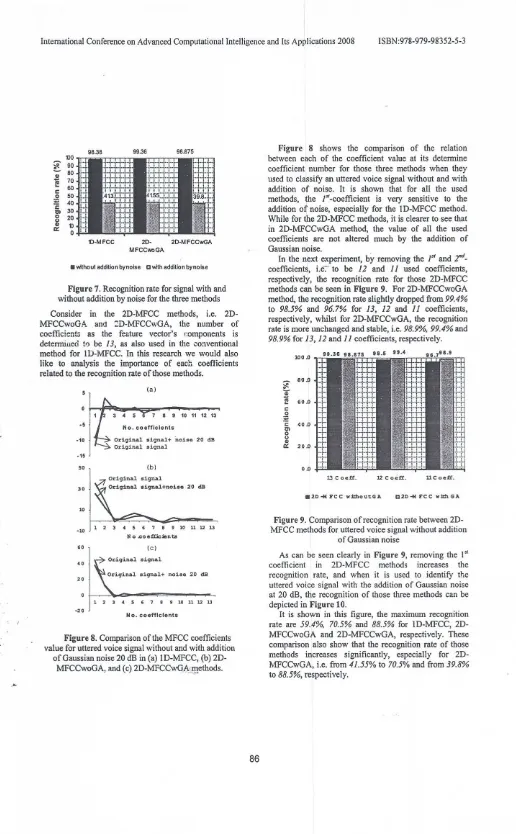
Consider in the 20-MFCC methods, i.e. 20-MFCCwoGA and :D-MFCCwGA, the number of coefficient; as the feature vector's components is
determined to bezyxwvutsrqponmlkjihgfedcbaZYXWVUTSRQPONMLKJIHGFEDCBA13, as also used in the conventional method for ID-MFCC. In this research we would also
like to analysis the importance of each coeflicients related to the recognition rate of those methods,
(a)
· 5
7 8 9 10 11 12 13
-10
zyxwvutsrqponmlkjihgfedcbaZYXWVUTSRQPONMLKJIHGFEDCBA
O riq in a.l. sign al+ 'n oise 20 d BO rig in a l sig n a l
· 15
50 (b)
10 30
O rig in a l sig n a l
O riq in al sign al+ n oise 20 d B
-10 123 C 5' 78910111213
N o.ceefflcien ts
zyxwvutsrqponmlkjihgfedcbaZYXWVUTSRQPONMLKJIHGFEDCBA
60 (c)
40 O rigin al sig n a l.
20 O rig in a l sig n a l+ n o ise 2 0 d B
1 2 3 .• S 6 7 8 9ro 11 U U
-20
N0_coefficients
..1:'''< " Figure 8. Comparison of the MFCC coefficients value for uttered voice signal without and with addition
of Gaussian noise 20 dB in (a) lD-MFCC, (b) 20-MFCCwoGA, and (c) 2D-MFCCwQA~g!ethods.
.e-Figure 8 shows the comparison of the relation between each of the coefficient value at its determine coefficient number for those three methods when they used to classify an uttered voice signal without and with addition of noise. It is shown that for all the used methods, the I't-coefficient is very sensitive to the addition of noise, especially for the lD-MFCC method. While for the 20-MFCC methods, it is clearer to see that in 20-MFCCwGA method, the value of all the used coefficients are not altered much by the addition of Gaussian noise.
In the next experiment, by removing the I" and
r'.
coefficients, i.e-:-·to be 12 and
zyxwvutsrqponmlkjihgfedcbaZYXWVUTSRQPONMLKJIHGFEDCBA
II used coefficients, respectively, the recognition rate for those 2D-MFCCmethods can be seen in Figure 9. For 20-MFCCwoGA method, the recognition rate slightly dropped from 99.4% to 98.5% and 96.7% for 13, 12 and II coefficients, respectively, whilst for 2D-MFCCwGA, the recognition rate is more unchanged and stable, i.e. 98.9%, 99.4% and 98.9% for 13, 12and II coefficients, respectively.
100.0
-
80.0;!.
]"
E 60.0
C ~
·c
40.0a!
0
o
II>
II:: 20.0
0.0
.20 ~ F C C w ith ou tG A 02D-* FCC "jjhGA
Figure 9. Comparison ofrecognition rate between 20-MFCC methods for uttered voice signal without addition
of Gaussian noise
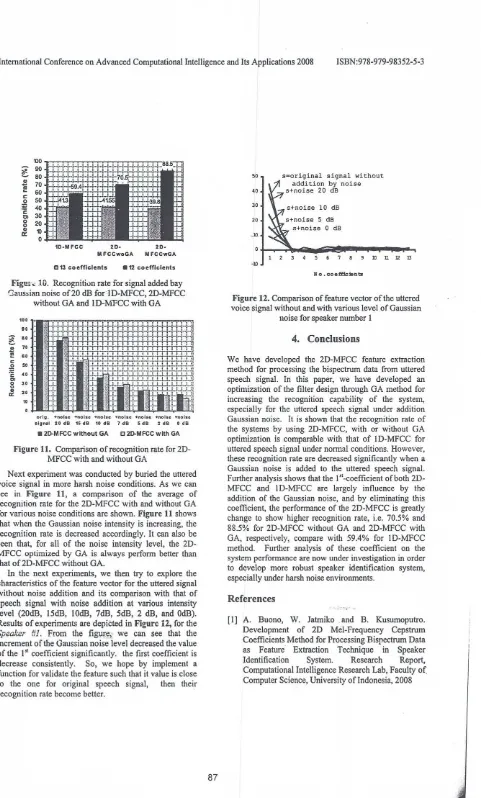
As can be seen clearly in Figure 9, removing the l" coefficient in 2D-MFCC methods increases the recognition rate, and when it is used to identify the uttered voice signal with the addition of Gaussian noise at 20 dB, the recognition of those three methods can be depicted in Figure 10.
tlO
:>!1 90
~G>zyxwvutsrqponmlkjihgfedcbaZYXWVUTSRQPONMLKJIHGFEDCBAeo
70
f
e 60 .2 50
~ 40 e
30 I:n
0 20
u
G> tl
Q: 0
10· MFCC 20. 20·
MFCCwoGA MFCCwGA
[] 13 co .fflclonts
zyxwvutsrqponmlkjihgfedcbaZYXWVUTSRQPONMLKJIHGFEDCBA
.1 2coefficientsFigure lG. Recognition rate for signal added bay
'3aussian noise of20 dB forlD-MFCC, 2D-MFCC
without GA and lD-lViFCC with GA
10.
go
~ 10
~
7.
60
I: 5.
~
C
••
'"
0 3'
u
..
2. 0:10
zyxwvutsrqponmlkjihgfedcbaZYXWVUTSRQPONMLKJIHGFEDCBA
o r lg . + n o ls e + n o J a e + n o l •• + n o ls e + n o l •• + n c llie + n o ls e
s ig n a l 2 0 d B 1 5 d B 1 0d B 7 d B 5 d B 2 d B II d B
• 2()'MFCC without GA C 2()'MFCC with GA
Figure 11. Comparison of recognition rate for 2D-MFCC with and without GA
Next experiment was conducted by buried the uttered voice signal in more harsh noise conditions. As we can
see in Figure 11, a comparison of the average of
recogrunon rate for the 2D-MFCC with and without GA for various noise conditions are shown. Figure 11 shows that when the Gaussian noise intensity is increasing, the recognition rate is decreased accordingly. It can also be seen that, for all of the noise intensity level, the 2D-MFCC optimized by GA is always perform better than
that of2D-MFCC without GA.
In the. n~xt experiments, we then try to explore the
characteristics of the feature vector for the uttered signal without noise addition and its comparison with that of
speech signal with noise addition at various intensity
level (20dB, 15dB, 10dB, 7dB, 5dB, 2 dB, and OdB).
Results of experiments are depicted in Figure 12,for the
zyxwvutsrqponmlkjihgfedcbaZYXWVUTSRQPONMLKJIHGFEDCBA
Speaker iil, From the fig\lre;, we can see that the
increment of the Gaussian noiselevel decreased the value
of the 1stcoefficient significantly. the first coefficient is
decrease consistently. So, we hope by implement a
function for validate the feature such that it value is close
to the one for original speech signal, then their
recognition rate become better.
50 s=original signal without
addition by noise s+noise 20 dB
40
30 s+noise 10 dB
s+noise 5 dB s+noise 0 dB
20
.10
123456789lDl11213 OlD
N o .c o e .f:f:J .c .te n ta
Figure 12. Comparison of feature vector of the uttered voice signal without and with various level of Gaussian
noise for speaker number I
4. Conclusions
We have developed the 2D-MFCC feature extraction
method for processing the bispectrum data from uttered
speech signal. In this paper, we have developed an
optimization of the filter design through GA method for
incre~ing the recognition capability of the system,
especially for the uttered speech signal under addition
Gaussian noise, It is shown that the recognition rate of
the systems by using 2D-MFCC, with or without GA optimization is comparable with that of ID-MFCC for uttered speech signal under normal conditions. However these recognition rate are decreased significantly when a Gaussian noise is added to the uttered speech signa\. Further analysis shows that the I"-coefficient of both
2D-MFCC and ID-MFCC are largely influence by the
additio? of the Gaussian noise, and by eliminating this coefficient, the performance of the 2f)-MFCC is greatly change to show higher recognition rate, i.e, 70,5% and 88.5% for 2D-MFCC without GA and 2D-MFCC with
GA, respectively, compare with 59.4% for ID-MFCC
method, Further analysis of these coefficient on the
system performance are now under investigation in order
to de~elop more robust speaker identification system,
especially under harsh noise environments.
References
'.:'-~ ;...•
[1] A. Buono, W. Jatmiko and B. Kusumoputro.
Development of 2D Mel-Frequency Cepstrum
Coefficients Method for Processing Bispectrum Data
as Feature Extraction Technique in Speaker
Identification System. Research Report,
Computational Intelligence Research Lab, Faculty of.
[image:6.617.95.576.44.842.2][2] C.L. Nikeas dan A.P. Petropulu.
zyxwvutsrqponmlkjihgfedcbaZYXWVUTSRQPONMLKJIHGFEDCBA
Higher Order Spectra Analysis : A Nonlinear Signakl ProcessingFramework. Prentice-Hall, Inc. New Jersey, 1993. [3] M.l. Fanany dan Benyamin Kusumoputro. 1998.
Bispectrum Pattern Analysis and Quantization to Speaker Identification. Thesis Master in Computer Science, Faculty of Computer Science University of Indonesia, 1998.
[4] N. Hidayat, Trispectrum Estimation and Scalar Quantization for Speaker Recognition System Development. Thesis Master in Computer Science, Faculty of Computer Science University of Indonesia, 1999.
[5] Adi Triyanto Feature Extraction on Speech Data Using Higher Order Spectra and Vector Quantization for Speaker Identification with Neural Network as Classifier. Thesis Master in Computer Science, Faculty of Computer Science University of
!rrdonesia,~OOO:
zyxwvutsrqponmlkjihgfedcbaZYXWVUTSRQPONMLKJIHGFEDCBA
[oj M. Nilsson dan M. Ejnarsson. Speech Recognition using Hidden Markov Model: Performance Evaluation in Noisy Environment. Master Thesis, Departement of Telecommunications and Signal Processing, Blekinge Institute of Technology, Maret 2002.
[7] Zbigniew M. Genetic Algorithms+Data structures =EvolutionPrograms .3thEd.Springer, 1996. [8] L. Rabiner. A Tutorial on Hidden Markov Model and Selected Applications in Speech Recognition.