IJCRR
Vol 06 issue 13 Section: General Sciences Category: Research Received on: 11/05/14 Revised on: 09/06/14 Accepted on: 27/06/14
DETERMINANTS OF SUSTAINABLE VEGETABLE FARMING
AMONG SMALLHOLDER FARMERS IN BOGOR REGENCY
Wahid Ullah1, Sri Mulatsih2, Sahara2, Syaiful Anwar3
1
Department of Natural and Environmental Resource Management, Bogor Agriculture University, Indonesia
2
Department of Economics, Bogor Agriculture University, Indonesia 3
Department of Soil Science and Land Resources, Bogor Agriculture University, Indonesia
E-mail of Corresponding Author: [email protected]
ABSTRACT
The agricultural sector plays a significant role in the Indonesian economy and local’s livelihood. One
of the major stakeholders in agriculture is the smallholder farm sector. Large number of these smallholder farmers (SHF) produces vegetables for commercial and subsistence purposes but they have limited access to agriculture resources including labor, technology and other inputs. The purpose of this study is to identify socio-economic characteristics, agricultural farming practices and environmental variables influencing smallholder’s sustainable vegetable production in the villages of Situdaun and Cinangneng located in the sub-district of Tinjolaya, Bogor regency, West Jawa. The study uses descriptive and ordinal logistic regression analysis. Drawing on a sample of 96 households, the study shows that sustainable production of vegetables is mainly affected by the low quality of agriculture inputs, excessive rainfalls and lack of financial resources. The findings in the paper reveal that, based on the output from logistic regression; crop rotation, agriculture training, member of a farmer’s group and land size are the significant variables influencing SHF production. Crop rotation and agriculture training are dominant variables that positively influenced SHF. Member of a farmer’s group and land size negatively influenced SHF vegetable production. The study also established that by providing institutional requirement such as infrastructure improvement, subsidized fertilizers, pesticides, seeds, soft loans and other necessary services for vegetable farming to ensure constant and sustainable production. Given the dominance of smallholder sector in the economy, the effective utilization of these resources will hinge on the implementation of a set of policies that would allow smallholders to seek greater specialization and improve their produce.
Keywords: smallholder farmers, sustainable vegetable production, socio-economic,agricultural and environmental constraints, logit analysis
INTRODUCTION
Indonesia has a large smallholder agriculture sector as in many other developing countries in Asia and the pacific. Agriculture contributes the Indonesian national economy, accounting for 15% of gross national product (Statistic Agency, 2012). Contribution of agriculture sector to exports was
staples (Roshetko et. al. 2012). Many smallholders face challenges related to crop production. These include lack of access to sufficient and productive land for expansion, sufficient water, modern irrigation system, mechanization, cheaper and good quality inputs, transport logistics and market information (Hazell, 2011; Sahara, 2012; Wickramasinghe, 2012, Thapa, et. al. 2011). Because of these conditions they are unable to take advantage of the opportunities offered by markets and it is also a reason that although they feed the world but their own households are amongst the poorest of the poor. Smallholder farmers choose crops that grow faster and require less investment (Gabre-Madhin,2009). In this regard vegetables are one of the best choices to grow but it needs best management and care to store and sell it. This study will steam the need for awareness among smallholder farmers towards sustainable agriculture with a focus on identifying the possible solution(s) for the constraints (socio-economic, agricultural and environmental) affecting small
holder farmers’ production and possible
suggestions through which they can further improve their yield sustainability.
Justification of the Study
Indonesia has a 246 million total population of which nearly 17 million are smallholders, most of which are often vulnerable to external shocks emerging from weather and access to other agricultural inputs (labor, technology, finance, fertilizers, pesticides and best management practices etc.), which keeps them in perpetual poverty. The contribution of smallholder farmers into Indonesian economy is fairly good which needs to be improved by providing the basic needs to the smallholder farmers to assure sustainable use of land. They cannot be ignored because of their huge number and contribution to agricultural.
Research Objectives
The overall research objective of the study is to identify the characteristics of smallholder agriculture practices related to sustainability, what constraints they are facing and how to cope with
those hurdles in order to assure sustainable production from their lands?
The specific research objectives are as follows; 1. To identify agricultural sustainability related
farming practices of vegetable growing smallholder farmers
2. To identify factors (social, economic, and environmental) that influence smallholder’s vegetable production?
RESEARCH METHODOLOGY Study Area and Sample Size Selection
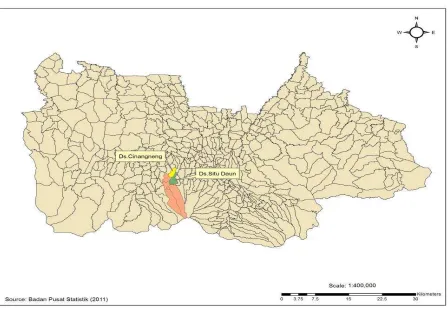
The survey was conducted in two sample villages namely Situdaun and Cinangneng located in sub-district Tinjolaya of Bogor Regency. A sample household survey technique was selected to accomplish the study and was carried out in July-August 2013. Villages were chosen purposively and respondents were randomly selected according to their potential for vegetable production. A total of 96 households were selected in two sample villages for interview (Figure 1; Appendix 2).
Data Analysis
Data was analyzed in two sections i.e. descriptive data analysis and logistic regression analysis. From the survey, descriptive statistics on demographic information including age, gender, and marital status, size of the household and landholding sizes of the smallholder farmers is provided.
RESULTS AND DISCUSSION
Socio-economic Profile of Smallholder Farmers
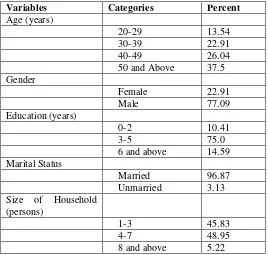
In this study information on socio-economic profile (Table 2) of the smallholder farmers were collected. Indicators used for percentage analyses of those indicators were age, gender, education level, marital status and size of the household. Out of total 96 smallholder farmers that were The traditional gender imbalance dominated by males associated with farming was present in smallholders growing vegetables. In terms of education, the findings showed that of the stallholders, 10.41% had 0-2 years of education, followed by 75.0% with 3-5 years of education and 14.59% had 6 or above years of education. The survey also investigated that 96.87% smallholders were married and 3.13% unmarried. For household size, 45.83% smallholders were in
1-3 people’s category, 48.95% in 4-7 following by
5.22% in 8 or more people living in one household category. The survey discovered that 34.37% smallholder were involved in farming (both agriculture and horticulture) for less than 10 years, 26.04% of the sampled respondents were involved in farming between 11-20 years, followed by16.67% of them between 21-30 years and 22.92 in the age category of 31 or above.
Landholding Sizes of the Smallholders
The landholding size in the study area is less than average farm size in Indonesia as reported in the smallholders interviewed, 14.58% have the land size of less than 1000m.square, 68.75% have land size between 1000-5000m.square, 15.62% have
more than 5000m.square while 1.04% respondents did not know his agricultural land size. The average holding size of the farmers in the survey area was 4466.15m^2 or (+ 0.45ha).
Environmental Characteristics of Smallholder
Farmer’s Agriculture Practices
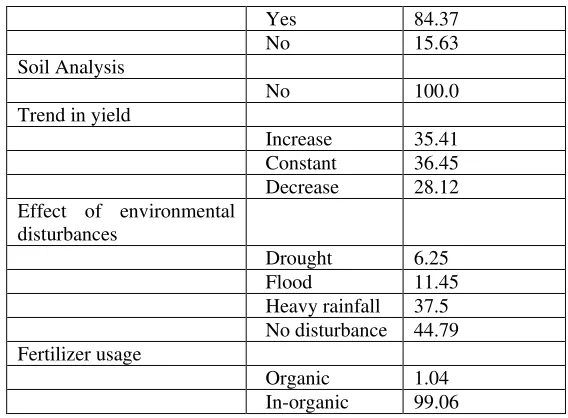
The study (Table 3) also comprises of farming practices vegetable growing smallholders do related to agricultural sustainability which is one of the main concerns of smallholder farming. From the survey, it was observed that 87.5% farmers were satisfied with the quality of their vegetables while 12.5% were not because of its bad taste and reduced size problems as a major problem. The smallholders believed those problems could be controlled by disease control and its vector. Out of total farmers interviewed, 95.83% sampled respondents were using pesticides to control diseases following by 4.17% that were not using any kind of pesticides. Crop rotation is considered to one of the important technique of modern sustainable agriculture because it gives soil time to use its nutrients in a sustainable manner. In our sampled farmers 84.37 respondents were rotating crops each time they wanted to do agriculture while 15.63% were growing the same kind of vegetables without rotating it to another crop type.
production because of their weak management skills. In this regard, they prefer inorganic agriculture because it needs less energy, money and labor compare to organic agriculture
Ordinal Logistic Regression Model Explanation
The logistic regression analysis (Table 4) was used to estimate the extent to which socio-economic or demographic characteristics influence smallholders yield. The estimated factor scores were then used in an ordinary logistic regression analysis along with selected socio-economic agricultural factors, such as crop rotation, pesticide usage, fertilizer usage, agricultural training, member of a farmer’s group, access to market information, age, gender, education level, size of household, time spent in agriculture and land size. The estimated Logit model was statistically significant with a likelihood ratio test probability of P-Value = 0.236, overall percentage of right prediction was 69.6%, Chi-Square was -97.307, degrees of freedom were 12 which indicates joint significance of all coefficient estimates. The estimated coefficients are tested by using standard errors, t-ratios and P-values. A positive sign on the statistically significant parameter estimates of one variable indicates the likelihood of the response increasing, holding other variables constant, and vice versa. The model output reveals that out of twelve variables seven positively and five negatively influenced the dependent variable. However two out of twelve variables were statistically significant on 90% confidence interval and influencing the production of smallholders. Both these variables were negative namely: member of farmer’s group and land size were ordered properly and influencing the dependent variable negatively which was unexpected. Thus, the smallholder characteristics in the ordered model for equation are relevant in explaining the importance of yield towards participation in supermarkets. The results indicated that, the farmers’ characteristics play an important role when explaining the importance of education level for their participation in supermarkets.
Many studies in the literature reveal that crop The results expectedly showed positive response. Smallholders rotating their crops were more likely to increase yield. This value was significant on 77% confidence interval. Trained smallholders with knowledge of agriculture were assumed to be having increased yield from their lands. The logistic regression model showed significant and an expected result. Farmers working in groups had easy access to inputs because of the resource sharing among the groups. The result was significant but unexpected. Farmers groups were only active to attract aid (agricultural inputs) from government. The aid is usually divided equally among all the members of group but they work on their individual lands. Access to market information or any other social media was another variable used in the model. It was expected that smallholders having access to social media will be more aware of the market situation i.e. prices of agricultural inputs, good quality fertilizers, pesticides and other agriculture related news. The results showed unexpected results meaning that access to market information have no significance over yield. It was expected that smallholders having large land will have increased yield but results showed negative response. Smaller lands were easy to manage for them based on their economically marginalized condition. It also needs labor, money, time and energy. Lack of finance was the main constraint that smallholders were facing. Pesticide and fertilizers use, gender, age, education level, time spent in agriculture and size of the household unexpectedly showed insignificant and unexpected results.
which is significant at 0.202 willingness level have 2.23 times more yield than those who do not do crop rotation. Agricultural training was significant at 0.211 willingness level and trained farmers have more 2.58 times more yield than untrained smallholders. Results of logistic regression model indicate a negative response for working in farmer’s groups. Estimated coefficient for member of a farmer’s group is negative and 0.24 less likely meaning that smallholders working individually on their lands have 0.24 times more yield than those working in groups. Respondents who indicated no access to market information have 0.60 times higher yield than those who can access market information. The response land size negatively influences the probability of smallholders having higher yields i.e. 0.68 less likely. Land size is also significant but coefficient value is negative. According to the result smallholders with fewer land sizes are more likely to have higher yield and vice versa because lack of access to good quality inputs including seeds, fertilizers, pesticides, modern technology and other financial resources to manage large lands. In order to assess how well the model fits the data, Goodness of fitness test statistic was developed and a chi-square test from observed and expected smallholder’s farming practices related to sustainability in Bogor Regency of Indonesia. Information has also been provided on the requirements of smallholders to produce vegetables sustainably. The results suggest that most farmers view increase in production favorably. Smallholders strongly identify the small sizes of their lands and lack of purchasing power to buy good quality agricultural inputs for farming as the main area of interest. They demanded inputs from government including trainings, soft loans,
good quality fertilizers, pesticides, and seeds. Smallholders emphasized on lack of support from both public and private sector. The results also indicates that small farms need to raise their productivity through access to better technologies, good quality agricultural inputs, improvement in infrastructure facilities, external shocks emerging from weather and improved management practices, while at the same time achieving more environmentally sustainable patterns of production. There is urgent need for the kinds of sustainable intensification that significantly raise farming produce. This will require the best of modern science, the best of indigenous knowledge and ecological literacy. This kind of knowledge intensive farming requires new approaches to research and extension, as well as an enabling policy environment. The both public and private sector has little incentive to invest in this kind of for small farms, and the public sector has to play a bigger role to keep the farmers in the equation.
ACKNOWLEDGEMENT
Authors acknowledge the immense help received from the scholars whose articles are cited and included in references of this manuscript. The authors are also grateful to authors / editors / publishers of all those articles, journals and books from where the literature for this article has been reviewed and discussed.
REFERENCES
1. [IFAD] International Fund for Agricultural Development. 2010. Smallholder Farmers can be Part of the Solution. International Fund for Agricultural Development.
2. Altieri, MA, Funes-Monzote, FR, & Petersen, P. 2012. Agro ecologically efficient agricultural systems for smallholder farmers: contributions to food sovereignty. Agronomy for Sustainable Development, 32(1): pp. 1-13. 3. Bajracharya, RM. 2002. Fertility and
of international seminar on Mountains, Royal Nepal Academy of Science and Technology, Kathmandu, Nepal
4. Gabre-Madhin, ME. 2009. A market for all farmers: Market institutions and smallholder participation. Agriculture for Development, Center for Effective Global Action, UC Berkeley
5. Hazell, P. 2011. Five big questions about five hundred million small farms. Rome: International Fund for Agricultural Development.
6. http://www.uncapsa.org/LIBRARYJournal_de tail.asp?VJournalKey=886
7. Karki, KB. 2006. Impact of cropping intensification on nutritional balance in Nepalese soils, In: Proceedings of International Seminar on Environment and Social Impacts of Agricultural Intensification in Himalayan Watersheds. Kathmandu, Nepal. 8. Nkamleu, GB. & Adesina, AA. 2000. Determinants of chemical input use in peri-urban lowland systems: Bivariate Probit Analysis in Cameroon. Agricultural Systems, 63(2): pp. 111-121.
9. Raut, N, Sitaula, BK., Vatn, A, &Paudel, GS. 2011. Determinants of Adoption and Extent of Agricultural Intensification in the Central Mid-hills of Nepal. Journal of Sustainable Development, 4(4).
10. Roshetko, JM, Kurniawan, I.& Budidarsono, S. 2012. 17. Smallholder Cultivation of katuk (Sauropusandrogynous) and kucai (Allium odorum): Challenges in Sustaining Commercial Production and Market Linkage. 11. Sahara, 2012. The transformations of modern
food retailers in Indonesia: opportunities and challenges for smallholder farmers
[dissertation]. Adelaide: School of Agriculture, Food and Wine, Faculty of Sciences, the University of Adelaide.
12. Statistic Agency of Indonesia, 2012. Overview of Indonesian Agriculture Sector. http://www.gbgindonesia.com/en/agriculture/s ector_overview.php.
13. Statistic Agency of Indonesia. 2004. Agricultural Censuses. Indonesian Statistic Agency, Jakarta
14. Thapa, G. & Gaiha, R. 2011. Smallholder farming in Asia and the Pacific: Challenges and opportunities. IFAD conference on New Directions for Smallholder Agriculture, pp. 24-25.
15. Tiwari, KR. Sitaula, BK., Nyborg, IL. & Paudel, GS. 2008a. Determinants of farmers’ adoption of improved soil conservation technology in a Middle Mountain Watershed of Central Nepal. Environmental Management, 42(2): 210-222.
16. Wickramasinghe, U. 2012. Towards Promoting the Participation of Smallholders in Agricultural Markets in Papua New Guinea. Vol. 29(3). Palawija newsletter.
Table 1: Coding approach of dependent and independent variables used for logistic regression analysis
Variable Coding
Yield Increase in yield = 3, Constant = 2 and
Decrease = 1
Crop Rotation If yes 1, otherwise 0
Pesticide Use If yes 1, otherwise 0
Fertilizer Use If yes 1, otherwise 0
Agriculture Training If yes 1, otherwise 0
Member of a farmer’s Group If yes 1, otherwise 0
Access to supermarket Information If yes 1, otherwise 0
Gender If male 1, otherwise 0
Education Level (years) Original data from survey was used
Age (years) Original data from survey was used
Farming time (years) Original data from survey was used
Size of Household (persons) Original data from survey was used
Land Size (m2 or ha) Original data from survey was used
Table 2: Socio-economic Profile of Smallholder Farmers
Variables Categories Percent
Age (years)
20-29 13.54
30-39 22.91
40-49 26.04
50 and Above 37.5 Gender
Female 22.91
Male 77.09
Education (years)
0-2 10.41
3-5 75.0
6 and above 14.59
Marital Status
Married 96.87
Unmarried 3.13
Size of Household (persons)
1-3 45.83
4-7 48.95
8 and above 5.22
Table 3: Smallholder farmers Agricultural Sustainability Related Practices
Question Response Percent
Satisfaction with the quality vegetables
Satisfied 87.5
Un-satisfied 12.5 Pesticide Usage
Yes 95.83
No 4.17
Yes 84.37
No 15.63
Soil Analysis
No 100.0
Trend in yield
Increase 35.41
Constant 36.45
Decrease 28.12
Effect of environmental disturbances
Drought 6.25
Flood 11.45
Heavy rainfall 37.5 No disturbance 44.79 Fertilizer usage
Organic 1.04
In-organic 99.06
Table 4: Ordinal Logistic Regression analysis of smallholder farming practices related to agricultural sustainability
Variable Coefficient Standard
Error
P- Value
Odd Ratio
Crop Rotation 0.800614 0.627473 0.202** 2.23
Pesticide Use -0.353261 1.01062 0.727 0.70
Fertilizer Use 0.530911 0.557006 0.341 1.70
Agriculture Training 0.946504 0.756556 0.211** 2.58
Member of a farmer’s Group -1.41507 0.726948 0.052* 0.24
Access to supermarket
Information
-0.507454 0.425841 0.233** 0.60
Gender -0.486809 0.484018 0.315 0.61
Education Level 0.389074 0.460290 0.398 1.48
Age 0.824618 1.00502 0.412 2.28
Farming time 0.398428 0.340999 0.243** 1.49
Size of Household 0.165907 0.514311 0.747 1.18
Land Size -0.383646 0.202191 0.058* 0.68
Significant at α = 90% and ** significant at 75%, Log-Likelihood = -97.307, test that all slopes are
zero: G = 15.099,
Figure 1: Map of the Study Area1