Modeling on Establishment of Sustainable Paddy Field Zone in
Bekasi Regency, Indonesia
Sigit Santosa1* Ernan Rustiadi2 Budi Mulyanto2 Kukuh Murtilaksono2 Widiatmaka2 Noer Fauzi Rachman3
1. Study Program of Soil Science, Graduate School, Bogor Agricultural University, Bogor 16680, Indonesia
2. Department of Soil Science and Land Resources, Bogor Agricultural University, Bogor 16680, Indonesia
3. Department of Community Development and Communication Sciences, Bogor Agricultural University, Bogor 16680, Indonesia
* E-mail of the corresponding author: [email protected]
Abstract
The background of this study is paddy fields conversion that continues to occur along the northern coast of Java that threatens national food security. Regional Spatial Plan (RTRW) and Sustainable Food Agricultural Land Protection Program (LP2B) are unable to control paddy field conversion. This research was conducted to establishment a sustainable paddy field zone model using logistic regression and multicriteria evaluation. The research location is in Bekasi Regency, one of West Java's rice production centers which is Jakarta buffer area with a high level of paddy field conversion. The model builds upon the characteristics of local paddy field conversion by considering the concept of sustainable development. Important variables that support the paddy field conversions are the distance to settlements, housings, roads, regency/city capitals and industrial estates. Results of logistic regression then become the input for weighted criteria to develop three policy scenarios of paddy fields protection; standard, protective and permissive in order to support regional development. This model will obtain protected paddy field priorities as well as a buffer for other paddy fields in surrounding area.
Keywords: logistic regression, multicriteria evaluation, sustainable paddy fields zone
1. Introduction
The problems of paddy field conversions in Indonesia remain a great concern due to increasing population and the speed control function that threaten national food stability. Developing new paddy fields in order to expand the paddy field area is difficult to implement because of the varied characteristics of soil resources, the availability of irrigation, and culture of paddy cultivation are concentrated only in a few areas in Indonesia (Agus, 2007; Ministry of Agriculture, 2013). The largest paddy field area is located in Java, which also is the most densely populated island in Indonesia. Java with its population and rapid economic growth has led paddy field conversion in large numbers. According to Rustiadi & Wafda (2008), during 1999-2000 paddy field conversions in Java mostly occurred in West Java which covered up to 0.199 million hectares. According to National Land Agency (2007), throughout 1994 to 2004 the paddy field conversions in Java and Bali reached 36,000 hectares or about 3,600 hectares/ year. Specifically, Dewi (2010) has mentioned that paddy fields area had gradually decreased in Bekasi for 21-year period during 1988 to 2009 which reached 27.853 hectares. The government's success in protecting paddy fields in Java, especially along northern coast of Java is the key to the success of improving national food security.
conversions. Paddy field conversions characteristics can be traced by logistic regression, which becomes an input of multicriteria evaluation for establishment of sustainable paddy fields.
Paddy field conversions characteristics analysis can be performed by using logistic regression method. Logistic regression is a mathematical model to analyze relationship of the independent variables including continues, discrete, dichotomous data, or its combination that affects the dependent variables (Mc Cullagh & Nelder, 1989 in Arsanjani et al., 2013). This analysis technique has been done on forest conversions (Kumar et al., 2014; Siles, 2009), the growth of cities (Arsanjani et al., 2013; Guo, 2012; Hu & Lo, 2007). These studies have successfully revealed the determinants of land use conversions. These factors are then used to predict land use with specific time in the future. Guo (2012) and Hu & Lo (2007) underlines that the logistic regression method is able to deal with various variables either physical, spatial, demographic, social, and economic aspects as well as land use policy and environmental preservation with a relatively fast data processing. However, logistic regression has less concern to the temporal dynamics and personal preferences of land use development.
In establishment of sustainable paddy fields, the consideration of the three pillars of sustainable development; economic, social and environmental, can be executed using multicriteria evaluation which is basically an expression or point of view to determine a lot of input or influence in designating the outcome. The term is more related to the decision-making process which combines many factors lead to various options or outcomes. Researches using this method have been carried out by Shiddiq (2011) in terms of determining the availability of paddy fields, Akinci et al. (2013) who studied the suitability of land for agricultural land use and Gorsevski et al. (2012) in the evaluation of the suitability of landfills. Through these studies it was proved that the multicriteria evaluation contributes to the decision-making process flexibly.
In terms to support the national food security, efforts to preserve paddy fields in the northern coast of Java play an important role. The government's success in protecting the paddy fields in the region is the key to success of improving national food stability. To support this, this research aims to develop a model on establishment of sustainable paddy fields in Bekasi. Sustainable paddy field model was designed by considering aspects of sustainable development and the characteristics of the local field conversions. Characteristics of field conversions were analyzed using logistic regression where results are used as values in determining the establishment of sustainable paddy fields using multicriteria evaluation.
2. Methodology
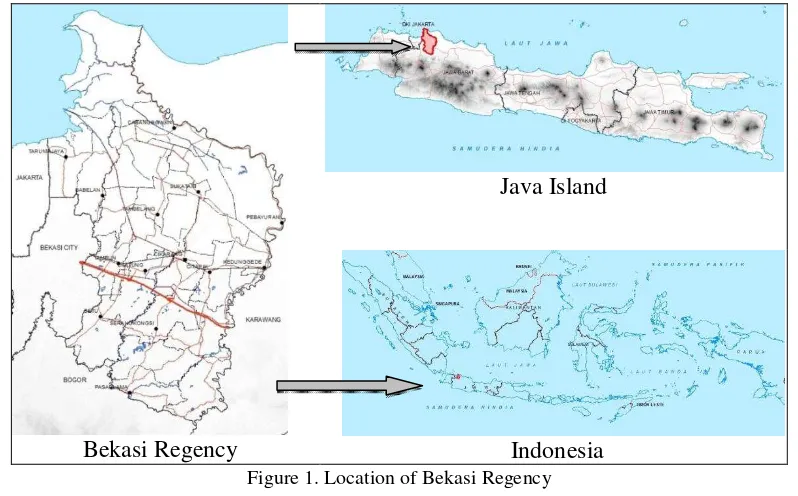
2.1 Research Area
Bekasi Regency
Java Island
Indonesia
Figure 1. Location of Bekasi Regency
Figure 2. Research flowchart
2.2 Tools and Materials
Other data used is the Overview of Land Tenure Map and Spatial Plan Map of Bekasi Regency taken from BPN Land Office of Bekasi. Land Suitability Map for paddy was made using primary data. Matching method (Hardjowigeno & Widiatmaka, 2007) is used to analyze land suitability class. Before executing the logistic regression and multicriteria evaluation, all data must use similar data format (Table 1).
Table 1. Data format of the analysis
Logistic regression is a regression variant which used in the dependent variable, is binary (dichotomous), i.e. 1 = paddy field change and 0 = no paddy field change. The analysis was performed for the data of land use in 2004-2009. Logistics function gives the probability of changes in the paddy field as a function of explanatory or independent variables. In other words, the possibility of paddy field change at each pixel is a function of value from the explanatory variables on the same pixel. The result of the model is continuous probability value between 0 and 1. Thus, logistic regression is used to reveal the paddy field conversions variables in Bekasi. Logistic regression formula is presented in Equation 1.
(1)
Where: p is paddy field conversion probability, E(Y) is expected value of Y dependent variable, β0 is estimated constant, βi is coefficients for each Xi variable. The formula can further be transformed linearly known as logit transformation as shown in Equation 2 and Equation 3.
(2)
(3)
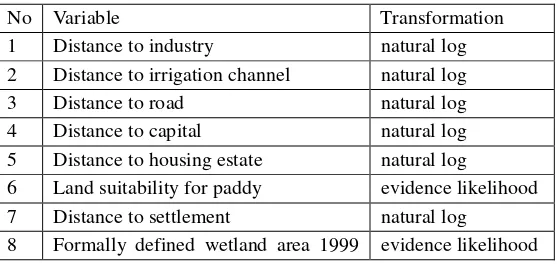
The transformation function through linear regression function is able to estimate the value of each βi. The equation is applied to each pixel until the probability (p) of paddy field conversion in each pixel is reached. Logistic regression model requires that all variables are calibrated to become conformable with paddy field change. Thus, all variables are normalized between 0.1 and 0.9. Distance variables are transformed using natural log methods, whereas categorical variables are using evidence-likelihood method (Kumar et al., 2014; Siles, 2009). Variables and their transformation is presented in Table 2.
Table 2. Independent variables and their transformation
No Variable Transformation
1 Distance to industry natural log 2 Distance to irrigation channel natural log
3 Distance to road natural log
4 Distance to capital natural log 5 Distance to housing estate natural log
6 Land suitability for paddy evidence likelihood 7 Distance to settlement natural log
Practically, logistic regression test is conducted on various combinations of independent variables both in number and type. The variable combinations are held from 2 to 8 variable combinations. Due to space limitations, this study only delivers 8 best combinations. The best combination has a pseudo R-square result approaching 0.2 with positive or negative type of influence according to field observations (Hu & Lo, 2007).
The final results of logistic regression are an equation explains the relationship of independent variables with paddy field conversions, paddy field conversion prediction and residue in 2009. The residue is the difference between existing maps of paddy in 2009 with paddy field conversions predictions in 2009. Prediction result maps are validated by ROC (Relative Operation Characteristic) method which compares the pixel values between the two maps by sampling a certain amount.
2.4 Multicriteria Evaluation
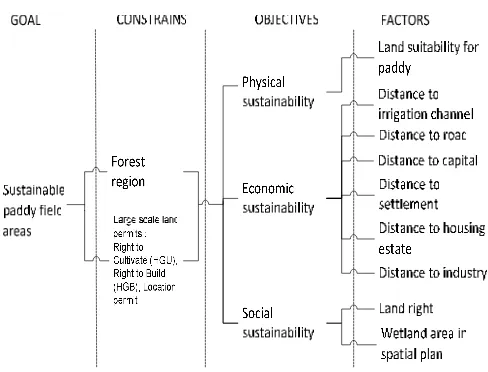
Multicriteria evaluation is carried out to establish sustainable paddy field area to the whole region of Bekasi using Idrisi on the decision wizard menu. Weighting in this analysis uses the results of the logistic regression equation. Sustainable paddy field establishment using multicriteria evaluation methods (Multi Criteria Evaluation / MCE) with a weighted analysis spatial analysis method approach. MCE consists of two things: goals setting and criteria setting. These criteria are divided into factors and constraints. Factors consist of sub-factors which are the criteria to achieve goal. Mathematical equation of Weighted Linear Combination (WLC) analysis is shown in Equation 4.
(4)
Where: Xij is the suitability degree of j-th factor in i-th location, Wij is the weight of j-th factors / sub factors in factor location, Cj is the constraint on the j-th factors / sub factors.
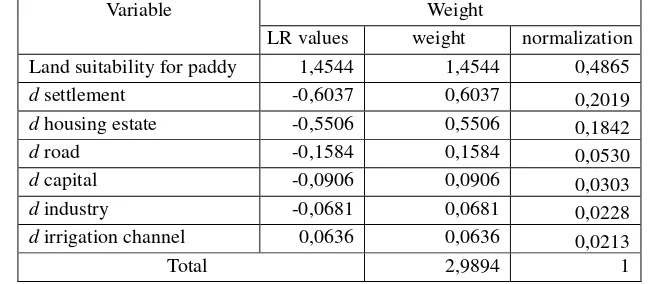
WLC method is based on the assumption that each factor has a different weight. Weighting process is performed by using the results of logistic regression analysis. The logistic regression results will obtain the order and magnitude of variables roles on paddy field conversions in Bekasi. This value is then used as weights in multicriteria evaluation. Weighting results and normalization are presented in Table 3.
Table 3. Weighting of independent variables in establishment of sustainable paddy field zone
Variable Weight
LR values weight normalization Land suitability for paddy 1,4544 1,4544 0,4865
d settlement -0,6037 0,6037 0,2019
d housing estate -0,5506 0,5506 0,1842
d road -0,1584 0,1584 0,0530
d capital -0,0906 0,0906 0,0303
d industry -0,0681 0,0681 0,0228
d irrigation channel 0,0636 0,0636 0,0213
Total 2,9894 1
LR is logistic regression, d is distance
Figure 3. The design of multicriteria evaluation on sustainable paddy field establishment
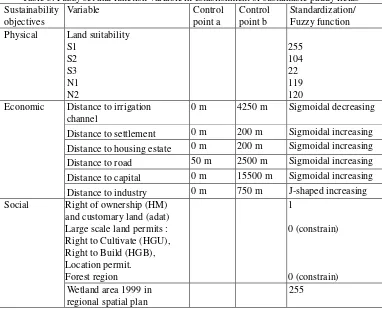
In the multicriteria evaluation, the variables are first standardized and fuzzy functions are determined (Gorsevski
et al., 2012). Standardization is a transformation process and scaling the original criteria into comparable units.
For example, raster criteria standardization becomes a value between 0 and 1 for each pixel using a fuzzy membership function that is sigmoidal, j-shaped, and other complex forms. Another function of standardization is to manage the uncertainty. Standardization and fuzzy function are based on the characteristics of the variables influence on the paddy field conversions. Generally, the variables are divided into two types, the distance variables and categorical variables. For distance variables, control point setting and fuzzy function are based on the conversion amount over distance. For example, at a road distance variable, paddy field conversions commonly occur in paddy fields up to 2500 m in distance. Establishment of a control point at a distance of 50 meters based on the average length of paddy field parcels, so that at some point between 0 and 50 meters, it is less necessary for paddy fields to be preserved since it is not economical if maintained as paddy fields. Therefore, control point a is 50 m and control point b is 2500 m, with fuzzy function is increasing sigmoidal whereas the suitability value is higher. Paddy field conversions magnitude that has a distance up to 2.5 km from the street side in Bekasi differs from what happens in other regions. According to Widiatmaka et.al (2013) the amount of paddy field conversions in Karawang occurred at a radius of 1 km from the street.
In categorical variables, the establishment of standardization value between 0-255 is done by considering how big the influence of each class is towards the conversions of paddy land suitability variables. Standardization is also done by using the assumption that the best score in each variable is 255. In land suitability variable for paddy crops, Cramer’s V test is used in each class. This test is a chi - square transformation statistical test (for tables contingency greater than 2 columns x 2 rows) which worth 0-1, where the results indicates agreement between the two nominal variables (Liebetrau, 1983 in Siles, 2009). The results in Table 4 show the influence of land suitability classes towards the paddy field conversions.
As shown in Table 4 that paddy land suitability S1 class gives the greatest influence in paddy field conversions process. It is understood that the S1 class regions has a flat slope, close to the capital of Bekasi Regency, Bekasi City leads to Jakarta and it is supported by good access.
Table 4. Results of Cramer’s V test on different class of land suitability for paddy
No Variable Cramer's V p
1 S1 0,3544 0,0000
2 S2 0,1439 0,0000
3 S3 0,0310 0,0000
4 N1 0,1657 0,0000
Influence magnitude is then transformed proportionally to the value of 0-255, where the greatest influence is 255. Land suitability class S1 influences paddy field conversions the most so it is given the value of 255. This also shows that paddy field conversions tend to occur in S1 paddy fields. The establishment of fuzzy sets and functions of the variables are presented in Table 5.
Table 5. Fuzzy set and function variable in establishment of sustainable paddy fields Sustainability
Table 6. Ordered weight of OWA for three different scenarios
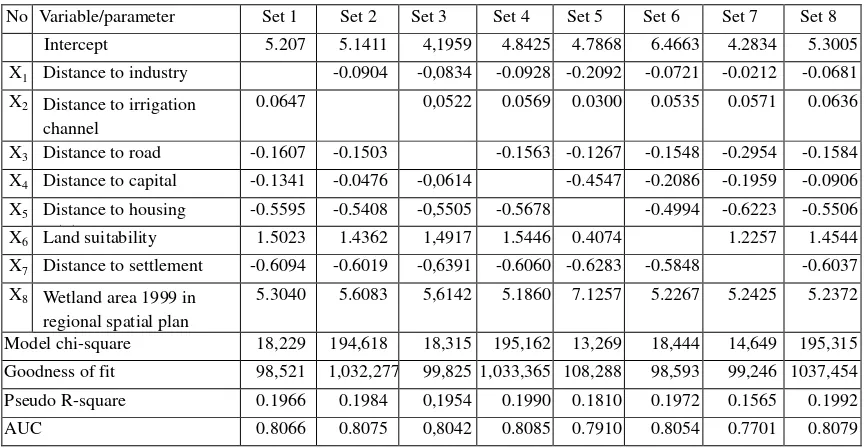
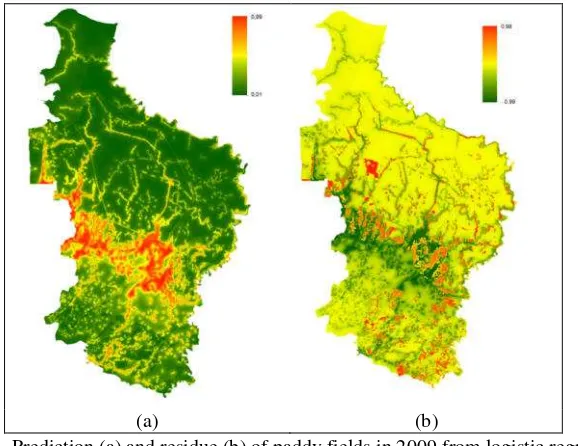
Through logistic regression analysis of various numbers and types of variables combinations, the best equation is obtained. Table 7 shows that the best equation is the equation in Set 8 combination columns which marked with the highest pseudo R-square value approaching the minimum standard of 0.2. The combination within Set 1 to Set 8 is a combination that has the best value, one level under the Set 8 that can be displayed. The paddy field prediction in 2009 can also be done using logistic regression analysis. By using the ROC method, prediction result validation of 0.755 is obtained. ROC results give less optimal outcome of prediction models. This is caused by the quality of the data. The paddy field prediction results in 2009 is shown in Figure 4a, it is clear that the paddy field conversions threat based on the largest logistic regression equation is located in the centre of Bekasi. This region is the center of growth marked as the capital regency, an industrial area with highway access.
Table 7. Results of logistic regression in some variables combinations
No Variable/parameter Set 1 Set 2 Set 3 Set 4 Set 5 Set 6 Set 7 Set 8
Model chi-square 18,229 194,618 18,315 195,162 13,269 18,444 14,649 195,315
Goodness of fit 98,521 1,032,277 99,825 1,033,365 108,288 98,593 99,246 1037,454
Pseudo R-square 0.1966 0.1984 0,1954 0.1990 0.1810 0.1972 0.1565 0.1992
AUC 0.8066 0.8075 0,8042 0.8085 0.7910 0.8054 0.7701 0.8079
Set (1-8) is variables combination X (1-8)
Set 8 Column in Table 7 can be rearranged as follows:
p’ = 5,3005-0,0681X1+0,0636X2-0,1584X3-0,0906X4-0,5506X5+1,4544X6-0,6037X7+ 5,2372X8 (5)
Bekasi City and distance to settlement. The most influential variable in paddy field conversions in Bekasi is the establishment of wetland through spatial planning. The influence of spatial plan due to small area designated for wetland. Next variable is paddy field suitability, which showed that paddy field conversions mostly occur in paddy fields with highest level of land suitability. Both variables are positive factors by means of preventing paddy field conversions. While negative variables that supports paddy field conversions is the distance from settlements and housing estates followed by distance to road and distance to industrial areas. It is comprehended by looking at the industrial area rapid growth and followed by a high demand for housings. However, to acknowledge the results of the logistic regression should be understood that the paddy field conversions determinants are specific in both location and period. These factors will vary between regions in both types and weights as well as between periods.
(a) (b)
Figure 4. Prediction (a) and residue (b) of paddy fields in 2009 from logistic regression
Figure 4 shows prediction and residual results from the logistic regression equation Equation 5. Prediction of paddy field conversions is shown with increasing red color with a value approaching 1. Conversion is predicted to happen a lot in the central region to east-west lengthwise of Bekasi. Figure 4b shows the prediction results compared to the data of paddy field in 2009. The red color approaching 1 indicates that the conversions happened in these areas are beyond prediction. This proves that the paddy field conversions acceleration in Bekasi happened rapidly.
3.2 Establishment of Sustainable Paddy fields
Generally, it is said that paddy field conversions in Bekasi happened rapidly. GIS overlay method calculated the sum of paddy field conversions in 2004-2009 in Bekasi is 14.006 hectares or 2801 hectares / year or 7.78 hectares / day. The magnitude of paddy field conversions existed along with loss of farm households. Based on Agriculture Census 2013 data (Indonesian Bureau of Statistics, 2013), in 2013 was recorded that farming households were 85.587 householders, but decreased since 2003 which reached more than 203.000 householders. Therefore, there has been a reduction of 117.413 farm family households for 10 years or 11.741,3 / year or 32,17 / day.
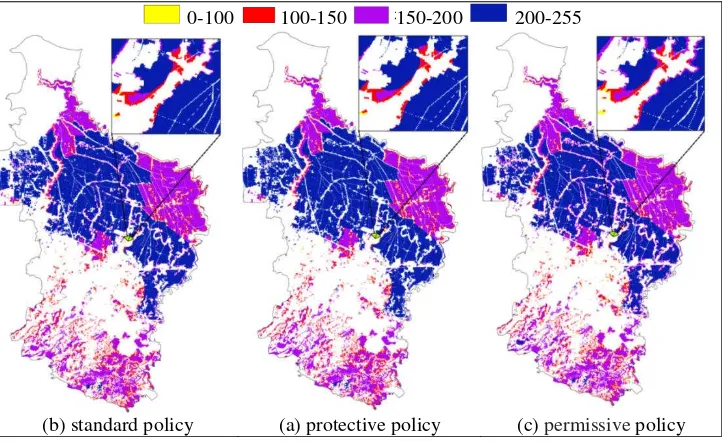
Three policy scenarios can be arranged from sustainable paddy field protection model, namely, standard policy, protective policy and permissive policy. Standard policy is the result of multicritera evaluation without OWA, which can be used directly with a standard protection level. Standard policy basically is a safeguard which is equal to threat magnitude. Protective scenario is chosen to protect almost all existing paddy fields, whereas permissive scenario provides government flexibility to converse in order to encourage the region development.
weight.
0-100 100-150 150-200 200-255
(b) standard policy (a) protective policy (c) permissive policy Figure 5. Different policy scenarios to preserve paddy fields
Table 8. The area of each protection class in three different scenarios Class Values Policy scenario area (Ha)
Standard Protective Permissive 1 201-255 30,911.56 33,003.94 28,819.25 2 151-200 21,989.06 20,105.00 24,520.75 3 101-150 6,575.50 6,409.25 6,022.50
4 51-100 106.19 64.13 219.81
Total 59,582.31 59,582.32 59,582.31
The implementation model in Bekasi Regency showed that the magnitude of paddy field conversions threat was reflected in standard protection model response where almost the entire paddy field has the highest protection class. The application of protective scenario expands the paddy field area that must be protected, especially in class 1 paddy fields. The development interest is accommodated through permissive models where land located near the settlements, roads and housing estates, was given lower protection weights so that it can be converted.
Basically, the three policy scenarios can be adjusted based upon time and interest. For example, if the protective policy scenario was successfully applied in paddy field protection but causing the slow movement of regional development, within a few years it can be evaluated and then standard or permissive policy scenarios can be applied for development interests. By these methods, the best paddy fields remain protected. Overlooking the paddy field with protection priority, these paddy fields are located not far from the central east-west lengthwise of Bekasi. The region can be considered as a buffer for the existing paddy fields either in the north or south part.
4. Conclusion
The model built in this study involved spatial and temporal data which is easily acquired while implemented to other regions. The more complete and accurate supporting data is, the more optimal results will be received. The model was designated with clear stages so it is possible to be tested in other regions with different characteristics.
References
Agus, F. (2007), Prologue. In Agus, F., Santoso, D., & Wahyunto (Eds.): New Paddy Fields. Indonesian Centre for Agricultural Land Resource Research Development, Bogor.
Akıncı, H., Ozalp, A.Y., & Turgut B. (2013), “Agricultural land use suitability analysis using GIS and AHP technique”, Computers and Electronics in Agriculture 97, 71–82.
Arsanjani, J.J., Helbich, M., Kainz, W., & Boloorani A.D. (2013), “Integration of logistic regression, Markov chain and cellular automata models to simulate urban expansion”, International Journal of Applied Earth
Observation and Geoinformation 21, 265–275.
Dewi, I.A. (2010), “Effectiveness Analysis of Spatial Planning as an Instrument to Control Wetland Changes Using a Non-Agricultural Land Use in Bekasi”, Master Thesis, Bogor Agricultural University, Indonesia.
Firman, T. (2004), “New town development in Jakarta Metropolitan Region: a perspective of spatial segregation”.
Habitat International 28, 349–368.
Gorsevski, P.V., Donevska, K.R., Mitrovski, C.D., & Frizado, J.P. (2010), “Integrating multi-criteria evaluation techniques with geographic information systems for landfill site selection: A case study using ordered weighted average”, Waste Management 32, 287–296.
Guo, Y.H. (2012), “Using Remote Sensing and GIS to Monitor and Predict Urban Growth—Case Study in Alachua County, Florida”, PhD Thesis, Graduate School of the University of Florida, USA.
Hardjowigeno, S. & Widiatmaka. (2007), “Land Evaluation and Land Use Planning”, Yogyakarta: Gadjah Mada University Press.
Hu, Z., & Lo, C.P. (2007). “Modeling urban growth in Atlanta using logistic regression”. Computers,
Environment and Urban Systems 31, 667–688.
Indonesian Bureau of Statistics (2013), “Agricultural Census Report 2013 West Java Province”, Bandung: Indonesian Bureau of Statistics.
Isa, I. (2007), “Paddy soil conservation and food security”, J Agrimedia 12 No 2.
Kumar, R., Nandy, S., Agarwal, R., & Kushwaha, S.P.S. (2014), “Forest cover dynamics analysis and prediction modeling using logisticregression model”, Ecological Indicators 45, 444–455.
Director General of Agricultural Infrastructure, Ministry of Agriculture. (2013), “Controling policy on paddy field conversion trough the implementation of Law Number 41 year 2009 and its regulations”, Paper presented on Seminar of Policy coordination on land and water management. Bogor.
Ministry of Agriculture. (2013), “Develop New Paddy Fields in Indonesia”. Jakarta: Directorate of Land Extensification and Management, Directorate General of Agricultural Infrastructure, Ministry of Agriculture.
National Land Agency. (2007), “ATLAS National Land Use Planning Balance”, Jakarta: National Land Agency.
Rustiadi, E., & Panuju, D.R. (1999), “Suburbanisation of Jakarta City”, Paper presented on Yearly National Seminar VII Persada, Bogor, Indonesia.
Shiddiq, D. (2011), “Spatial Multi Criteria Analysis for Determining Paddy Field Availability in Cianjur Regency”, Master Thesis, Bogor Agricultural University, Indonesia.
Siles, N.J.S. (2009), “Spatial Modelling and Predicton of Tropical Forest Conversion in the Isiboro Secure National Park and Indigenous Territory (TIPNIS), Bolivia”, Master Thesis, International Institute for Geo-informatuon Science and Earth Observation, Enschede, the Netherlands.
Widiatmaka, Ambarwulan, W., Munibah, K., & Santoso, P.B.K. (2013), “Analysis of Land Use Changes and Land Suitability for Paddy in throughout Jakarta-Cikampek Toll Road and North Coast National Road, Karawang”, Paper presented on Annual Scientific Forum of the Indonesian Surveyor Association. Yogyakarta, Indonesia.