WAHID ULLAH
POST GRADUATE SCHOOL
BOGOR AGRICULTURAL UNIVERSITY BOGOR
2014
DETERMINANTS OF SUSTAINABLE VEGETABLE
FARMING AMONG SMALLHOLDER FARMERS
DECLARATION
I do hereby declare that the thesis entitled “DETERMINANTS OF
SUSTAINABLE VEGETABLE FARMING AMONG SMALLHOLDER
FARMERS IN BOGOR REGENCY” is my original work produced through the guidance of my academic advisors and that to the best of my knowledge has not been presented for the award of any degree in any educational institution. All of the incorporated material originated from other published as well as unpublished papers are clearly stated in the text as well as in the references. Furthermore, a research article with the same title has been published in July 2014 in International Journal of Current Review ad Research (IJCRR), Volume 6,Issue 13, Page 06-14; as a preliminary requirement for master‟s degree.
Therefore, I hereby delegate the copyrights of this work to Bogor Agricultural University, Bogor, Indonesia
DEDICATION
WAHID ULLAH. Determinan Pertanian Sayuran berkelanjutan di Kabupaten Bogor, dibawah bimbingan SRI MULATSIH, SYAIFUL ANWAR and SAHARA.
ABSTRAK
Sektor pertanian memiliki peran penting dalam perekonomian Indonesia dan mata pencaharian penduduk lokal. Salah satu pemangku utama di bidang pertanian adalah petani kecil. Sebagian besar petani kecil ini memproduksi sayuran untuk dijual dan dikonsumsi sendiri tetapi mereka mempunyai akses yang terbatas ke sumber daya pertanian termasuk tenaga kerja, teknologi dan input lainnya. Tujuan dari penelitian ini adalah untuk mengidentifikasi karakteristik sosial-ekonomi, praktek pertanian dan variabel lingkungan yang mempengaruhi produksi sayuran berkelanjutan petani kecil di desa Situ Daun dan Cinangneng yang terletak di Kecamatan Tinjolaya, Kabupaten Bogor, Jawa Barat. Penelitian ini menggunakan analisis deskriptif dan regresi logistik ordinal. Berdasarkan sampel dari 96 rumah tangga, penelitian ini menunjukkan bahwa 71,09% petani tidak puas dengan produksi mereka karena kurangnya sumber daya keuangan, hujan deras, dan input lain yang diperlukan untuk pertanian mereka. Hasil dari analisis regresi logistik rotasi tanaman, pelatihan pertanian, anggota kelompok petani dan luas lahan merupakan variable-variable yang secara signifikan mempengaruhi produksi petani kecil. Rotasi tanaman dan pelatihan pertanian adalah variabel signifikan yang berpengaruh positif sedangkan anggota kelompok tani dan luas lahan berpengaruh negatif terhadap hasil petani kecil. Penelitian ini juga menunjukan bahwa persyaratan utama untuk meningkatkan produksi petani kecil adalah menyediakan pupuk bersubsidi, pestisida, benih, kredit ramah petani dan alat-alat lainnya yang diperlukan untuk pertanian sayuran untuk memastikan produksi yang konstan dan berkelanjutan. Mengingat dominasi sektor petani kecil dalam perekonomian, pemanfaatan yang efektif dari sumber daya ini akan bergantung pada pelaksanaan serangkaian kebijakan yang memungkinkan petani untuk mencari spesialisasi yang lebih besar dan meningkatkan produksi mereka. Kata Kunci: Petani kecil, Produksi sayuran berkelanjutan, Input pertanian, Analysis logit
DETERMINANTS OF SUSTAINABLE VEGETABLE
FARMING AMONG SMALLHOLDER FARMERS
SUMMARY
WAHID ULLAH. Determinants of Sustainable Vegetable Farming among Smallholder Farmers in Bogor Regency Bogor, supervised by SRI MULATSIH, SYAIFUL ANWAR and SAHARA.
The agricultural sector plays a significant role in the Indonesian economy and
local‟s livelihood. One of the major stakeholders in agriculture is the smallholder farm sector. Large number of these smallholder farmers (SHF) produces vegetables for commercial and subsistence purposes but they have limited access to agriculture resources including labor, technology and other inputs. The purpose of this study is to identify socio-economic characteristics, agricultural farming practices and environmental variables influencing smallholder‟s sustainable vegetable production in the villages of Situ Daun and Cinangneng located in the sub-district of Tinjolaya, Bogor regency, West Java. The study uses descriptive and ordinal logistic regression analysis. Drawing on a sample of 96 households, the study shows that sustainable production of vegetables is mainly affected by the low quality of agriculture inputs, excessive rainfalls and lack of financial resources. The findings in the paper reveal that, based on the output from logistic
regression; crop rotation, agriculture training, member of a farmer‟s group and
land size are the significant variables influencing SHF production. Crop rotation and agriculture training are dominant variables that positively influenced SHF.
Member of a farmer‟s group and land size negatively influenced SHF vegetable
production. The study also established that by providing institutional requirement such as infrastructure improvement, subsidized fertilizers, pesticides, seeds, soft loans and other necessary services for vegetable farming to ensure constant and sustainable production. Given the dominance of smallholder sector in the economy, the effective utilization of these resources will hinge on the implementation of a set of policies that would allow smallholders to seek greater specialization and improve their produce.
© All Rights Reserved IPB, the Year 2014 Copyright Reserved
All or part of this thesis report is prohibited to quote without providing proper citation. Quotation is only for educational purposes, research, scientific writing, preparation of reports, critical writing, or review an issue; and citations are not detrimental to the interests of the IPB
DETERMINANTS OF SUSTAINABLE VEGETABLE
FARMING AMONG SMALLHOLDER FARMERS
IN BOGOR REGENCY INDONESIA
WAHID ULLAH
A thesis submitted in partial fulfillment of the requirements for the degree of
Master of Science in
Natural Resources and Environmental Management
POST GRADUATE SCHOOL
BOGOR AGRICULTURAL UNIVERSITY BOGOR
Thesis Title : Determinants of Sustainable Vegetable Farming among Smallholder Farmers in Bogor Regency
Name : Wahid Ullah Student ID : P052128381
Approved by
Supervisory Committee
Dr Ir Sri Mulatsih, MScAgr Head
Dr Ir Syaiful Anwar, MSc Member
Dr Sahara, SP MSi Member
Acknowledged by
Head of Study Program Natural Resources and Environmental
Management
Dean of Post Graduate School
Prof Dr Ir Cecep Kusmana, MS Dr Ir Dahrul Syah, MScAgr
Date of Thesis Defense: 23 June 2014
i
TABLE OF CONTENTS
LIST OF TABLES ii
LIST OF FIGURES ii
LIST OF ABBREVATIONS AND SYMBOLS iii
1 INTRODUCTION 1
Background 1
Problem Statement 2
Research Objectives 3
Benefits of the Research 3
2 LITERATURE REVIEW 4
Indonesian Horticulture Sector 4
Contribution of Smallholder Farmers to the Global and Indonesian
Agriculture 7
Hurdles to Smallholders Farmers in Indonesia 8
3 RESEARCH METHOD 11
Study Area 11
Selection of Sample and Data Collection 11
Data Analysis 13
Descriptive Data Analysis 13
Logistic Regression Analysis 13
Determination of Dependent Variable 13
Selection of Independent Variables 13
Model Specification 14
Likelihood Ratio Tests 15
Ordinal Logistic Regression Assumptions 16
4 PROFILE OF THE STUDY AREA 17
Geography, Topography, Geology 17
Climate 18
Population 19
5 RESULTS AND DISCUSSION 20
Characteristics of Smallholder Farmers 20
Socio-economic Profile of the Smallholder Farmers 20
Households Assets 20
ii
Production Portfolio and Smallholders 22
Satisfaction with Land Production 22
Trend in Production 23
Desire to Participate in Supermarkets 24
Availability of Inputs for Agricultural Practices 25
Awareness Level of Smallholder Farmers 26
Demands of Smallholder Farmers from Government 27 Agricultural Sustainability related Farming Practices of Smallholder
Farmers 27
Determinants of Sustainable Agriculture of Smallholder Farmers 29
REFERENCES 33
APPENDIX 1 37
LIST OF TABLES
1 Poppulation and sample size of the study area 12
2 Average Annual Rainfall in Bogor Regency 18
3 Annual Temperature of the Bogor Regency 18
4 Socio-economic Characteristics of Smallholders Farmers 19 5 Households assets of the smallholder farmers in the study area 21 6 Land holding sizes of the smallholder farmers in the study area 22 7 Production from land and farming time of Smallholder farmers 22
8 Satisfaction with Production from Land 23
9 Trends in Agricultural Production 24
10 Desire of smallholder farmers to participate in supermarket. 24 11 Inputs available for practicing agriculture sustainably 26
12 Awareness level of smallholders 26
13 Requirements of smallholder‟s for agriculture 27 14 Smallholder farmers Agricultural Sustainability Related Practices 28
15 Determinants of Sustainable Vegetable Farming 30
LIST OF FIGURES
1 Map of the Study Area 11
iii
LIST OF ABBREVATIONS AND SYMBOLS
mm : Milimeter
Km : Kilometer
UN : United Nations
GAP : Good Agricultural Practices
BPS : Badan Pusat Statistik (Central Bureau of Statistic)
SMH : Smallholder Farmers
Ha : Hectare
Km/H : Kilometer/Hour
oC Degree Centigrade
% : Percent
Km2 : Kilometer Square
m2 : Meter Square
FAO : Food and Agricultural Organization GBGI : Global Business Guide Indonesia
IFAD : International Fund for Agricultural Development
WDR : World Development Report
IAASTD International Assessment of Agricultural Knowledge, Science and Technology for Development
IJCRR International Journal of Current Review and Research
1
INTRODUCTIONBackground
Sustainable development has numerous definitions and its ecological, economic and social principles received universal agreement at the 1992 Earth
Summit. One of the summit‟s major outcomes, Agenda 21. Today, 106 countries
have National Sustainable Development Strategies and at least 120 voluntary sustainability standards are being implemented by the food and agriculture industry. However, developing and implementing an integrated approach to analyzing different sustainability dimensions as a coherent whole and integrating them in development or business strategies remains a major challenge (UN, 2011).
Sustainable development has been defined by FAO as “the management and conservation of the natural resource base, and the orientation of technological and institutional change in such a manner as to ensure the attainment and continued satisfaction of human needs for present and future generations. Such sustainable development (in the agriculture, forestry and fisheries sectors) conserves land, water, plant and animal genetic resources, is environmentally non-degrading, technically appropriate, economically viable and socially acceptable” (FAO 2010). A more sustainable agriculture (which meets the needs of the present without compromising the ability of future generations to satisfy their own) seeks
to make the best use of nature‟s goods and services as functional inputs. It does
this by integrating natural and regenerative processes, such as nutrient cycling, nitrogen fixation, soil regeneration and natural enemies of pests into food production processes. It minimizes the use of nonrenewable inputs (pesticides and fertilizers) that damage the environment or harm the health of farmers and consumers. It makes better use of the knowledge and skills of farmers, so improving their self-reliance. And it seeks to make productive use of social capital - people‟s capacities to work together to solve common management problems, such as pest, watershed, irrigation, forest and credit management (Pretty and Hine 2001).
In order to feed nine billion people in 2050, we urgently need to adopt the most efficient farming systems and recommend for a fundamental shift towards sustainable agriculture as a way to boost food production and improve the situation of the poorest (Altieri et al 2012).
Similar to the other countries of the world, agricultural sector plays an
important role in the Indonesian economy and local‟s livelihood especially in reducing poverty, providing employment, improving farmers‟ welfare and
2
Board BPS on November 2003, from 88.1 million people of labor force in Indonesia as 46.6 percent work on agricultural sector (Sudihartono et al 2008).
Smallholders are the main contributors in agriculture sustainability and their role in agriculture production is a topic of interest. Around 500 million smallholders in the world, supporting almost 2 billion people, one third of humanity (IFAD 2010). They feed poor communities including themselves and the small increases in yields on their farms could have a profound impact on poverty and access to food at the local and regional levels (Altieri et al 2009). They account for 60% of global agriculture, manage vast areas of land, and through ingenuity and sweat manage to feed about one-third of humanity.
Indonesia has a large smallholder agriculture sector which are often vulnerable to external disturbances arising from weather, market volatility and farm failures, which keeps them in constant poverty. Indonesian smallholder farmers, like other countries of the world are among the poorest community and lack basic resources for practicing agriculture in a sustainable manner (Wickramasinghe 2012).
Most Indonesian smallholder farmers grow their crops on less than 0.79ha (Sahara 2012) facing many constraints in agricultural production including limited technical knowledge and planning, low use of inputs, weak management and poor post-harvest handling result in yields of low quantity and quality, limited access to market information and strong dependence on local collectors result in unfavorable bargaining positions for smallholders (Roshetko et al 2007).
Experience shows that helping smallholder farmers can contribute to a country‟s
economic growth and food security. For example, India, China, Bangladesh, Thailand and Viet Nam have gone from being food-deficit countries to food exporters. They achieved this largely through development of its smallholder farming sector.
This study was conducted in the villages of Situ Daun and Cinangneng situated in the Bogor Regency, Indonesia will try to identify the characteristics of smallholder farmers producing vegetables, their agricultural practices with a focus on sustainability aspect and factors (socio-economic, agricultural and environmental) that limits the production. The study will also try to identify the possible solution(s) for the constraints (socio-economic, agricultural and
environmental) affecting smallholder farmers‟ production and possible
suggestions through which these farmers can further improve their yield sustainability.
Problem Statement
3
This lack of resources and agricultural inputs diminishes their yield which might have the potential of improvement by providing basic needs to assure sustainable use of land.
Research Objectives
The overall research objective of the study is to identify the characteristics of smallholder agriculture practices related to sustainability, what constraints they are facing and how to cope with those hurdles in order to assure sustainable production from their lands? The specific research objectives are to;
1 Identify the characteristics of smallholder farmers growing vegetables.
2 Identify agricultural sustainability related farming practices of smallholder farmers growing vegetables.
3 Examine factors that influence sustainable vegetable farming of smallholder farmers.
Benefits of the Research
1 This study has identified the characteristics of smallholder farmers which will
help policy makers or any other stakeholder in understanding smallholder‟s
household characteristics, their farm characteristics and information on their total annual production of their main vegetable crop. Based on these information policy makers can revisit their policies and make it friendly to help smallholder farmers in increasing their yield.
2 The research has also identified the sustainability related practices of smallholder farmers through which policy makers can prioritize the areas which needs to be improved in order to make a sustainable use of land while at the same time insure maximum yield form it.
2
LITERATURE REVIEWIndonesian Horticulture Sector
According to Global Business Guide Indonesia Report (2012) fresh fruit and vegetables have always made up a significant portion of the Indonesian diet which in the past consisted of locally grown produce purchased from traditional retail outlets and markets. Indonesian consumer spending on fresh horticultural products compared to that on rice was 50% in 1994, this has since risen to 75% in 2004 and 100% for urban dwelling Indonesians in 2007 (Horticultural Producers and Supermarket Development in Indonesia Report, World Bank). However, Indonesian per capita consumption of fresh fruit and vegetables is still below the recommended level set by the United Nation‟s Food and Agriculture Organization (FAO) at an average of 40kg per person every year while the recommended
amount is 70kg (Indonesia Statistics Bureau Survey 2011). Indonesia‟s upper
middle class, who will swell to 30 million people by 2015 according to World storage of fresh produce thus making previously unavailable varieties of fruit and vegetables available to consumers. The market is therefore highly promising for
both local and foreign producers; however the country‟s reliance on imports is highlighting the declining competitiveness of Indonesia‟s domestic horticulture sector as well as the government‟s moves towards more protectionist and restrictive trade policies.
Imported fresh fruits and vegetables are coming to make up an increasing share of fresh produce sales in Indonesia. In 2006, horticulture imports stood at $600 million USD and rose to $1.7 billion USD in 2011 (Ministry of Trade). Approximately 45% of such imports constitute fresh fruit predominantly apples ($153 million USD), oranges ($150 million USD), grapes ($99 million USD) and
durians ($74 million USD). China is the main source of Indonesia‟s fruit imports at 55% followed by Thailand 28%, USA 10%, Chile 4% and Australia 3%. In 2011, imports of fresh vegetables increased by 29% with white onions making up a substantial portion ($242 million USD) as well as red onions ($74 million USD). With regards to vegetables, China is also the leading source contributing to 67% of total imports with both Thailand and Myanmar each making up 10% and India at 8%. The preference for imported fruit is due to the superior quality and taste offered by produce from China and Thailand in particular in addition to the competitive pricing as a result of government subsidies often making imported goods comparatively cheaper to those produced in Indonesia.
Indonesia has long been hailed for its comparative advantages in all things agricultural; mineral rich volcanic soil, a varied tropical climate for counter seasonal cultivation and the wide availability of fertile land for plantations are just
some of these advantages. The country‟s economy remains heavily dependent on
5
11% of the agricultural workforce is absorbed by horticulture (Ministry of Agriculture). The value of the fresh fruit and vegetables market has doubled over the course of 1995-2009 to an estimated $10 billion USD industry (Indonesia Statistics Bureau), however the local horticultural industry is playing less of a role than it is surely capable of. There are various factors involved as to why this is the case, one cause pointed out by local horticultural players is the lack of quality seeds available to local farmers despite the research underway at institutions such as Bogor Agricultural University and the private sector. Government support of the industry to assist in educating farmers on modern cultivation methods has also not been forthcoming making the necessary investments to improve output out of reach for most independent farmers. In contrast, Thai horticulture producers receive state support for their operations to create economies of scale and the
country‟s fresh fruit and vegetables have become an area of national pride for both
the local and export market due to the promotional efforts of the reigning monarch. Transportation and storage is a further issue that has held back local farmers in commanding higher value for their produce as the use of traditional transport methods such as open air trucks results in large portions of the products being spoiled on arrival to their destination.
Indonesia‟s horticulture sector represents a key opportunity for local and international horticultural players to work with local farmers to introduce improved production methods and coordinate economies of scale which would result in more competitive pricing in the domestic and international market. Areas such as seed research, modern planting and greenhouse methodology in addition to cold chain storage and transportation networks offer highly lucrative business opportunities. Plantations are a further area of potential to foreign investors given the laws governing investment which allow ownership of up to 95%. While restrictions on fruit and vegetable imports are getting tougher for foreign exporters
to navigate (this matter is covered in more detail later), the country‟s fruit imports
will continue unabated leaving plenty of scope for further growth. However, exporters should position themselves strategically to offer products that cannot be grown locally such as temperate fruit varieties rather than competing directly with local producers. For example, stone fruits such as cherries, peaches and plums as
well as various berry fruit types cannot be cultivated in Indonesia‟s tropical
climate.
Transportation and distribution of goods is a challenge for all consumer goods related industries in Indonesia, however the problem is more acute for fresh fruit and vegetables producers given the time pressures to ensure that the fruit is fresh on delivery. Indonesia‟s poor infrastructure and high logistical costs is not a new issue for those in the agriculture sector; however the announcement that as of
June 2012 four out of the country‟s eight main sea ports will be closed to
horticulture products is seen as exacerbating this problem. Jakarta‟s main ports such as Tanjung Priok previously handled up to 90% of the imported horticultural goods which will now have to go through Soekarno Hatta Airport, Tanjung Perak Port in Surabaya, Soekarno Hatta Port in Makassar and Belawan Port in Medan which will significantly add to transport costs. The Indonesian government has justified its decision to close the ports due to the lack of facilities such as
6
complaints from 12 horticulture exporting countries in the EU as well as Canada, USA and New Zealand who raised the matter at a World Trade Organization
meeting in May 2012 citing the lack of scientific evidence for Indonesia‟s claims
regarding phyto-sanitation requirements as the cause for the closure of the ports. Following on from the lodge of the complaint, three countries namely Canada, USA and Australia have requested a Mutual Recognition Agreement enabling them to continue to export fruits and vegetables through Tanjung Priok provided that Indonesian horticultural goods receive reciprocal treatment.
The Indonesian government move follows the introduction of new quality standards for imported fruit as per the Ministry of Agriculture Regulation No.15/2012 and No.16/2012 which stands as an amendment to No. 89/2011 and No.90/2011 on Technical Requirement and Plant Quarantine Measures on Import of Fresh Fruits and/or Vegetables and Fresh Bulbs into the Republic of Indonesia`s Territory. Such amendments were made following the discovery of traces of formaldehyde in imported fruit products with 19 incidents reported in the prior 18 months according to a statement by the Minister of Trade, Gita Wirjawan. In May 2012, the Ministry of Trade also announced new restrictions on horticulture imports in the form of regulation No.30/2012 whereby producers and importers must obtain a special import license that is subject to the approval of the Ministry of Agriculture in effect as of 29th September 2012. Eligibility for the license will depend on the technical capacity of the importer including ownership of cold storage transport facilities and having relationships with multiple distributors to avoid monopolistic practices and to provide opportunities to local agents.
Indonesia‟s fresh fruit and vegetables sector is at a key stage in its
development with the scope to offer lucrative opportunities to both local players
and international importers. The government‟s efforts to tighten their grip over
agricultural imports are making life more difficult for importers and local distributors due to the inadequate infrastructure available in Java and Jakarta as
the country‟s main economic hub and trade gateway. The intent of such measures
7
Contribution of Smallholder Farmers to the Global and Indonesian Agriculture
Smallholders are the main contributors in agriculture sustainability and their role in agriculture production is a topic of interest. Around 500 million smallholders in the world, supporting almost 2 billion people, one third of humanity (IFAD 2010). They feed poor communities including themselves and the small increases in yields on their farms could have a profound impact on poverty and access to food at the local and regional levels (Altieri et al 2009). They account for 60% of global agriculture, manage vast areas of land, and through ingenuity and sweat manage to feed about one-third of humanity (providing up to 80% of food in sub-Saharan Africa and Asia). They also make up
the largest share of the developing world‟s undernourished (Pimbert 2009).
Approximately 2.5 billion people in poor countries live directly from agriculture farming crops and livestock are relying on forestry or fisheries IAASTD (2008) and 1.5 billion people live in smallholder household. Of an estimated 525 million farms worldwide, about 435 million are small farms with two hectares of land or less (Zhou 2010; FAO 2011).
Asians constitute 57 per cent of the world‟s population and of them 56 per cent or close to 1.92 billion people FAO (2011) depend on agriculture, mostly Bangladesh (17 million) and Viet Nam (10 million)”.
Small farmers are the key groups requiring attention in agricultural and rural development. Increasing their productivity and incomes can make a major contribution to reducing hunger and poverty. The number of smallholder farmers has increased globally during the last few decades which have decreased the landholding size (World development reports 2007 and 2008). Most importantly, there is a lack of off-farm employment opportunities for smallholders, who typically have limited education and professional skills. Small farmers in developing countries will continue to be the custodians of vast areas of agricultural land for at least some decades to come (Altieri et al 2009). Large numbers of smallholders are women, heads of households or indigenous peoples, they live in the most ecologically and climatically vulnerable landscapes, such as hillsides, dry lands and floodplains, and rely directly on weather-dependent natural resources. For some years now, a combination of enlightened government officials, community groups, civil society organizations, think tanks and international aid agencies such as the International Fund for Agricultural Development (Ifad) have been developing a more sustainable approach to agriculture, with great success and huge potential to include smallholders (Pimbert 2009).
Three-quarters of the world‟s poor and 70% of hungry people live in rural communities where smallholder farming is the predominant livelihood and source of food. Small-scale producers provide more than half of the world‟s food supply.
8
the maize, beans and potatoes for domestic consumption in Latin America (Nagayets 2005). Small farms also contribute to greater food security, particularly in areas with poor infrastructure where high transport costs make locally produced foods less costly and less risky than many purchased foods (Hazell 2011).
Most of Indonesian people‟s livelihood is in agriculture. According to labor force indicator data from Statistic Central Board on November 2003, from 88.1 million people of labor force in Indonesia, as amount 41.054.600 people or 46.6 percent work on agricultural sector (Sudihartono et al, 2008). The agriculture sector is critical for rural household incomes, employing more than 40% of labor and contributing 17% of GDP. But agricultural productivity growth has been slower and is currently low both compared with other countries and historically for Indonesia. Contribution of agricultural sector on national output has been declining, but contributions of other sectors, such as trade, manufacturing, and services, have been increasing constantly (Sudihartono et al 2008). After the crisis level rises in 2007/08 and then in 2010/2011 the focus at policy level is again on farming with significant emphasis on the role of smallholders for fulfilling the
world‟s food needs.
Hazell (2011) stated that not all of the changes that might be thought particularly harmful to small farmers are necessarily any worse for them than they are for larger-scale farmers. But some clear threats to small farms emerge. In large part they arise from market failures, themselves amplified by the policy retreat from intervention that has left the private sector operating within markets as the main actor in input supply, financial services, marketing, and even technical advice and innovations. If smallholders are to survive and prosper, then they must find ways to meet new demands in supply chains and to obtain inputs, credit, and technical knowledge from private agents at competitive prices with large-scale farms. A key question is how far the public sector should intervene in helping small farms gain access to markets, technologies, and support services rather than leaving everything to the private sector. How one answers this question is one of the key differences between those who believe that small farmers have a future and those who do not.
According to Gulati (2008) the large smallholder agriculture sector in
Indonesia requires greater attention. Smallholder farmer‟s productivity and
incomes can make a major contribution to reducing hunger and poverty in Indonesia. The impacts of environmental degradation, climate change, asset ownership, awareness about fertilizers usage on proper soils, lack of power both in the economic sphere and with respect to state institutions, transportation expenses or other incentives on agricultural inputs, urbanization and globalization affect both small and large farms more or less equally. But other developments may pose more severe challenges for smallholdings. When new technologies require more capital inputs, mechanization, or high levels of education, these requirements may disadvantage smaller farms. More worrying are the implications of changes to marketing chains (Hazell et al 2007).
Hurdles to Smallholders Farmers in Indonesia
9
challenges affect both large and small farms, there is evidence that they apply more strongly to small farms. For example, small farmers cannot take advantage of higher food prices by expanding production if they have difficulty in accessing services and credit. Similarly, when new technologies require higher capital inputs or mechanization, small farmers may be at a disadvantage unless they are helped in reducing their transaction costs to access inputs, credit and marketing facilities. Poor smallholder farmers are particularly exposed to natural disasters, seasonality, year-to-year variability, and commodity price volatility. Given their limited ability to cope with risk due to resource constraints and absence of formal risk insurance markets, the poor are left vulnerable. With limited options to manage risk through formal market mechanisms, they experience significant fluctuations in income and makes consumption smoothing difficult (Gabre-Madhin 2009). The impacts of environmental degradation, climate change, asset ownership, awareness about fertilizers usage on proper soils, lack of power both in the economic sphere and with respect to state institutions, transportation expenses or other incentives on agricultural inputs, urbanization and globalization etc. are also the main hurdles with smallholders.
To feed the world‟s growing population – projected to exceed 9 billion in 2050 UN (2009) it will be necessary to boost the production of food and to do so sustainably. To be sustainable, agriculture will need to be intensified and its environmental footprint made to shrink (Nagayets 2005). Volatile food prices, recurrent droughts, floods, soil and water degradation, and land grabs, agriculture technology, proper season and methods of harvesting, proper fertilizers usage, environmental and agriculture education or awareness etc. are some of the multiple challenges faced by small-farmers in poor countries (Altieri et al 2009).
The World Bank (2008) report mentions that “to feed nine billion people in
2050, we urgently need to adopt the most efficient farming systems and recommend for a fundamental shift towards agro-ecology as a way to boost food
production and improve the situation of the poorest”. The global demand for food
is expected to increase by 60% by 2050. Given climate change, natural resource constraints and competing demands, especially for the production of befouls, among other factors, this presents a considerable challenge for the agriculture and food systems worldwide. Smallholders will need to play a key role in meeting these requirements, if for no reason other than the sheer magnitude of their production in developing countries (Altieri et al 2012).
A “supermarket revolution” has been underway in developing countries
since the early 1990s. Supermarkets (here referring to all modern retail, which includes chain stores of various formats such as supermarkets, hypermarkets, and convenience and neighborhood stores) have now gone well beyond the initial upper- and middle-class clientele in many countries to reach the mass market. Within the food system, the effects of this trend touch not only traditional retailers, but also the wholesale, processing, and farm sectors. The supermarket
10
3
RESEARCH METHODStudy Area
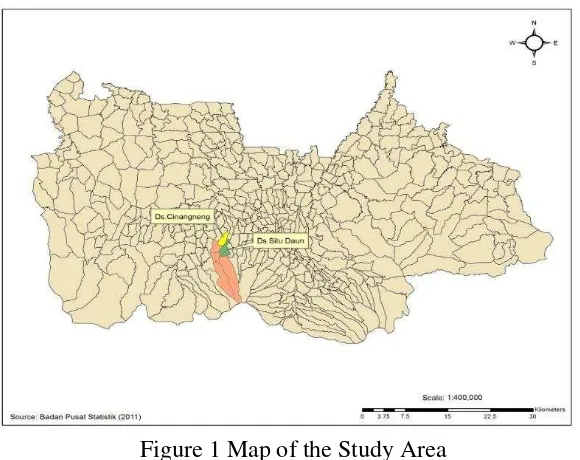
The Study area comprises of Situ Daun and Cinangning villages located at sub district of Tinjolaya in the Bogor Regency where agriculture is the main source of income of the local‟s livelihood. Both the villages are located at an altitude of 450 meter and 380 meter above sea level respectively. According to the Central Bureau of Statistics, Indonesia (2012) total population1 of Situ Daun was 8,678 with a total land size of 3.29 km2.
Figure 1 Map of the Study Area
The population density in Situ Daun village was 2638 persons/km2 while the total population of Cinangneng village is 8,660 with a population density of 4085 individuals/km2. The total land size of Cinangneng village is 2.12 km2. The mean monthly rainfall in both villages was 15 days and 245mm for the year 2012. The field surveys were conducted between July-August 2013 following by data analysis in the October 2013.
Selection of Sample and Data Collection
Smallholder is a farmer who owns or rent in land equal to or less than 2.0 hectares (Joshi 2006). A household was defined as a group of people living under the same roof and pool resources (labor and income). Labor pooling means that household members exchange labor time without any payment. Income pooling
means that they „eat from the same pot‟ although some income may be kept by the
household member who earns it (Sunderlin et al 2010).
1
12
There were 20 and 23 neighborhoods (Rukun Tetangga “RT”) in the villages of Situdaun and Cinangneng respectively. For primary data collection the neighborhoods were selected randomly (Simple Random Sampling) while the households were selected purposively on certain basis i.e. a household has to be involved in any kind of agriculture or horticulture activities, a household should own/rent land less than or equal to 2 hectares (definition of smallholder on the basis of land occupation) (Joshi 2006) a household should be largely dependent on family labor and a household can decide independently for him/herself what to grow and then where to sell his agricultural products.
The sites were chosen for this research because most of the farmers grow vegetables there, they are economically marginalized, lacking the necessary requirements for doing good agriculture practices (GAP). The study covers only
the producer‟s perceptions regarding participation in supermarkets. It also covers the level of awareness of those farmers regarding the standards for the quality and quantity of agricultural commodities and products.
Primary data was gathered on household level through household surveys with the farmers by using both closed and open ended questions. The questionnaire was divided into different sections starting from the very general characteristics of the respondents, assets of the household and awareness of a respondent regarding participation in supermarkets, agricultural production and supermarket accessibility, institutional support for participating in supermarkets, good agricultural practices and environmental sustainability.
Table 1 Poppulation and sample size of the study area
Characteristics Villages
Situ Daun Cinangneng Total population of the village (persons) 8678 8660 Total population involved in agriculture
(persons)
660 680
Land holders (persons) 330 345
Sampled Population (households) 49 (15% of the total landholders)
47 (13.62% of the total landholders) Source: Central bureau of statistics (BPS) 2012
13
was carried out applying Rapid Rural Appraisal (RRA) technique to gather data and information about Kecamatan Tinjolaya as basis for village selection.
Direct field observations were made to cross check the data obtained from interviews. The additional information from direct field observations was used in the analysis to complement the information gathered from the questionnaire. Secondary data was collected from existing and available literature in hard form like thesis, dissertation, Journals, internet, and other Government related bodies/organizations.
Data Analysis
Data was analyzed in two sections i.e. descriptive data analysis and logistic regression analysis.
Descriptive Data Analysis
From the survey, descriptive statistics on environmental, agricultural, social, economic and the aspects of awareness level of smallholder famers is generated to determine their farming activities, tillage practices, household‟s assets, cropping patterns, selling sources, constraints to smallholder farmers in accessing their production to supermarkets and their perceptions regarding participating in supermarkets.
Logistic Regression Analysis
Using farmers and farm characteristics including socio-economic, agricultural and environmental, an ordinal logistic regression model was estimated to determine the dependency of yield on crop rotation, pesticide use, fertilizer use, agricultural training, member of a farmer‟s group, access to market information, age of the household, gender, education, size of the household, time spent in agriculture and land holding size.
Determination of Dependent Variable
Sustainability was analyzed through the quantity of yield and was divided into three categories with codes assigned to it (an increase in yield was coded as 3, if constant then 2 and if yield is decreasing then was coded as 1).
Selection of Independent Variables
A total of twelve independent variables were included in the logistic regression model to analyze dependency of yield. Specific codes were assigned to all variables.
14
Pesticide utilization was another independent variable to analyze how much yield was dependent on it.
A farmer using pesticide was coded as 1, otherwise 0. The assumption made was that if a farmer is using pesticide then his/her yield will be less and that means that the agricultural he is practicing is un-sustainable and vice versa.
Fertilizer utilization was a dummy variable created by scoring method. It was assumed that by using organic fertilizers, yield will be higher and agriculture will be sustainable otherwise not. Organic fertilizer use was coded as 1 and in-organic as 0.
Agricultural Training (years) was coded as (received=1, 0 otherwise). Farmers who have received any kind of agricultural training were expected to have higher yield.
A farmer who shares resources within „farmer‟s group‟ was desired to have higher yield and was coded as 1 otherwise 0.
A farmer who has „access to market information‟ was coded as 1, if not than 0. It was expected that a farmer keeping himself aware of the current updates about market will try to adjust his/her agriculture according to the demands of the market and will have higher yield.
Age of the household (years) was a continuous variable. Original ages of the respondents were used for logistic regression analysis. It was assumed that older farmer will be more mature will cares about his agricultural production to support his family. The assumption was that he/she will be having higher yield.
Gender was another dummy variable used to separate the sex (male or female) of the respondents and was created by scoring method. A score of 1 was given to male and 0 to female farmers. Historically male are more engaged in agriculture compare to females, however the scenario has been changing since last decade. Households headed by male farmers were expected to have higher yield than those headed by female. Female famers are also starting to adopt vegetable farming due to the direct benefits it offers (Tiwari et al 2008a).
Education (years) was used as a continuous variable. It was hypothesized that education of the respondent will be positively related to yield. Educated farmers are more likely to be practicing sustainable agriculture will be having higher yield (Nkamleu et al 2000).
Size of Household (persons) was a continuous variable and it was hypothesized that large households will be having higher yield because the total number of laborers involved in farming activities from their families will be more. Farming time (years) was a continuous variable. It was expected that farming time will be positively related to yield i.e. more experience-more yield. He will also be having knowledge of good agricultural practices.
Landholding Size (m2 or hectare) was the last continuous variable included in the model and was expected to have positive relationship with yield.
Model Specification
15
Ordinal logistic regression with a response variable i.e. yield was categorical and multilevel (ordinal). Logistic models for ordinal response data with category c (c> 2) is an extension of the logistic model for nominal response data with two categories (binary logistic models). As in other regression models, two or more explanatory variables can be included in the analysis. The explanatory variables can be quantitative data and qualitative data. Thus it helps to explore the degree and direction of relationship between dependent and independent variables (Greene 2003).
Logistic models for ordinal response data is often referred to as the cumulative logit model. Response in the form of cumulative logit models stratified the data are represented by the numbers 1, 2, 3... c, with c is the number of response categories. Cumulative logit for each category j is defined as:
( )
Models that simultaneously uses all cumulative logit can be written as: '
ˆ ˆ ( ) ˆ
j j
L x x
Each has a cumulative logit intercept respectively and is the method of maximum likelihood estimator for each.
The estimated value for P can be derived by inverse transformation of the cumulative logit function, which results in:
'
Significance test is done by using the model:
Likelihood Ratio Tests
Likelihood ratio test is a method to test the model simultaneously. Hypothesis βi parameters tested were:
H0 : β1 = ... = βp = 0
H0 : at least one βi≠ 0, i = 1,2, ..., p where i is the number of explanatory variables i.e. as follows;
Yi = log (pi/1-pi) = α + ∑ βiXik + ei
Where,
16
Β = Logistic co-efficient for the independent variables ei = Error term
Xi = Independent variables including;
X1 : Crop rotation (yes = 1, otherwise = 0)
X2 : Pesticide utilization (yes = 1, otherwise = 0)
X3 : Fertilizer utilization (organic = 1, in-organic = 0)
X4 : Agricultural training (years)
X5 : Member of a farmer‟s group (yes = 1, otherwise = 0)
X6 : Access to market information (yes = 1, otherwise = 0)
X7 : Age of the household (years)
X8 : Gender (male/female)
X9 : Education (years)
X10 : Size of household (perosns)
X11 : Time spent in agriculture (years)
X12 : Land holding size (meter2 or hectare)
Using the likelihood ratio test statistic G follows the chi-square distribution with degrees of freedom p. The decision is a rejection of H0 if the value of G> χ2 (p, α) or p-value <α.
Ordinal Logistic Regression Assumptions
Ordinal logistic regression assumptions are;
1 Logistic regression does not assume a linear relationship between the explanatory variables and the response variable.
2 Response variables in logistic regression do not have to follow a normal distribution.
3 Variables response does not require the assumption of homoscedasticity. 4 Error terms are not assumed to be normally distributed
4
PROFILE OF THE STUDY AREABogor (Indonesian: Kota Bogor and formerly Buitenzorg) is a city on the island of Java in the West Java province of Indonesia. The city is located in the center of the Bogor Regency (Indonesian: Kabupaten Bogor), 60 kilometers south of the Indonesian capital Jakarta. Bogor itself is a recognized as a municipality (cat); it is an important economic, scientific, cultural and tourist center, as well as a mountain resort. In the middle Ages, the city was the capital of Sunda Kingdom (Indonesian: Kerajaan Sunda) and was called Pakuan Pajajaran. During the Dutch colonial era, it was named Buitenzorg and served as the summer residence of the Governor-General of Dutch East Indies. The city was the administrative center of the Netherlands East Indies during the brief British control in the early 19th century.
With several hundred thousand people living on an area of about 20 km², the central part of Bogor is one of the world's most densely populated areas. The city has a presidential palace and a botanical garden (Indonesian: Kebun Raya Bogor)
– one of the oldest and largest in the world. It bears the nickname "the Rain City" (Kota Hujan), because of frequent rain showers. It nearly always rains even during the dry season.
Geography, Topography, Geology
The city is situated in the western part of Java Island, about 53 km south of the capital Jakarta and 85 km northwest of Bandung, the administrative center of West Java Province. Bogor spreads over a basin near volcanoes Salak, which peaks at about 12 km south, and Mount Gede whose top is 22–25 km south-east of the city. The average elevation is 265 meters, maximum 330 m, and minimum 190 meters above sea level. The terrain is rather uneven: 17.64 km² of its area has slopes of 0–2°, 80.9 km² from 2° to 15°, 11 km² between 15° and 25°, 7.65 km² from 25° to 40° and 1.20 km² over 40°; the northern part is relatively flat and the southern part is more hilly.
18
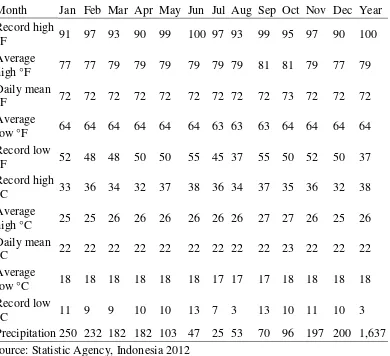
Climate
Table 2 Average Annual Rainfall in Bogor Regency
Month 1 2 3 4 5 6 7 8 9 10 11 12 Year
19
nickname "Rain City" (Indonesian: Kota hujan). The temperatures are lower than in coastal Java: the average maximum is 25.9 °C (cf. 32.2 °C in Jakarta). Daily fluctuations (9–10 °C) are rather high for Indonesia. The absolute maximum temperature was recorded at 38 °C and the minimum at 3 °C.
Population
According to the national census held in May–August 2010, 949,066 people were registered in Bogor. The average population density is about 8,000 people per km²; it reaches 12,571 persons per km² in the center and drops to 5,866 people per km² in the southern part. The increased population is also one the threat to the land use change from agriculture to others land uses.
Population of the study area
Figure 2 Population of Bogor Regency
The rapid population growth in Bogor after 1960 is related to urbanization as well as the influx of workforce from other parts of the country. The birth rate in 2009 was 563 children per 10,000 people, with the mortality value of 272. During the same year, 12,709 permanent residents moved in and 3,391 people left the city. Men constituted 51.06% and women 48.94% of the population. 28.39% of the inhabitants were under 15 years old, 67.42% were aged 15–65 years and 3.51% – over 65 years. The 2005 estimate of the life expectancy is 71.8 years, which is the highest figure for West Java and one of the highest in Indonesia. Most population (87%) is Sundanese, with considerable numbers of Javanese, Chinese and other, often mixed ethnicities. Virtually all adults are fluent in Indonesian – the official language of the country. Sundanese is used at home and in some public areas and events – for example, the solemn speech of the mayor at the City Day celebration of 3 June 2010 was delivered in Sundanese. The local dialect of Sundanese significantly differs from the classical version both lexically and phonetically.
The majority of population (94%) is Muslims, with just over 5% Christians. However, there are many Christian churches in the city, as well as Buddhist (mostly in the Chinese community) and Hindu communities.
0 200,000 400,000 600,000 800,000 1,000,000
1956 1961 1971 1981 1988 1999 2010
Trend in Population Growth
5
RESULTS AND DISCUSSIONCharacteristics of Smallholder Farmers
Socio-economic Profile of the Smallholder Farmers
Table 4 shows the socio-economic profile of the smallholders. From the survey, it was discovered that there were total 96 smallholder farmers were interviewed. Out of this total, 13.54% were in the age category of between 20-29 years old, 22.91% smallholders were from 30-39 years old category. From the total sampled farmers, 26.04% respondents were in the age category of 40-49, while 37.5% smallholder in the 50 and above age category.
Table 4 Socio-economic Characteristics of Smallholders Farmers
Variables Categories Percent
Age (years) 20-29 13.54
30-39 22.91
40-49 26.04
50 and Above 37.5
Gender Female 22.91
Male 77.09
Education (years) 0-2 10.41
3-5 75.0
6 and above 14.59
Marital Status Married 96.87
Unmarried 3.13
Size of Household (persons) 1-3 45.83
4-7 48.95
8 and above 5.22
Out of the total sample; 22.91% respondents were female and 77.09% were male. The traditional gender imbalance dominated by males associated with farming was present in smallholders growing vegetables. In terms of education, the findings showed that of the stallholders, 10.41% had 0-2 years of education, followed by 75.0% with 3-5 years of education and 14.59% had 6 or above years of education. 4.16% of the sampled respondents that were interviewed, their relationship to the head of the households was father, 71.87% were interviewed were head of the households while 23.97% were the wives of the head of the households. The survey also investigated that 96.87% smallholders were married and 3.13% unmarried. For household size 45.83% smallholders said they are in
1-3 people‟s category, 48.95% were in 4-7 people‟s category while 5.22% were in 8 or more than that people living in one household category.
Household Assets
21
irrigating their lands, livestock, television, house/home, radio, storage house to the survey. The assets we included into the survey are mainly those that can help respondents in carrying their production to the market, or mediums used for listening news about agriculture like TV, radio, and hand phones. In total 96 smallholders were asked about their assets. Out of this total, 63.54% respondents did not have hand phones, 92.71% did not have car, and 62.5% had no motor bikes.
Water pumps are a source to irrigate agricultural fields in the study area but due to the lack of financial resources most of the smallholder farmers does not have water pumps. They rely on rain water for irrigation. The results from the survey showed that 42.70% smallholders own water pumps while 57.30% do not have water pumps, 47.91% have chicken and ducks in their homes while 52.09% do not have poultry. Out of the total 96 smallholders, 22.91% reported that they have goats while 77.09% do not have. The findings also showed that 88.54% form the total sampled respondents have television following by 11.46% that do not have television. All the sampled respondents live in their own home. The results showed that 20.83% smallholders have radio to listen news at. This includes news about agriculture as well (i.e. fertilizer aid, pesticide, market prices etc.). Out of the total sample, 79.17% respondents did not have this facility. Storage house is an important element to keep vegetables fresh. Unfortunately, in the study area only 5.20% smallholder have storage house while 94.80 do not have storage house.
Table 5 Households assets of the smallholder farmers in the study area
Assets Responses
Yes (%) No (%)
Hand Phone 36.45 63.54
Car 7.29 92.71
Motorbike 37.5 62.5
Water Pump and Mist Blower 42.70 57.30
Poultry 47.91 52.09 Indonesia as reported in the agricultural census of 2003 and 2013. According to the census, farm considered as small farms are about 0.79 ha (Sahara, 2012).
22
respondents did not know his agricultural land size. The average holding size of the farmers in the survey area was 4466.15m2 or (+ 0.45ha).
Table 6 Land holding sizes of the smallholder farmers in the study area
Landholding Size (m2) Categories Percent
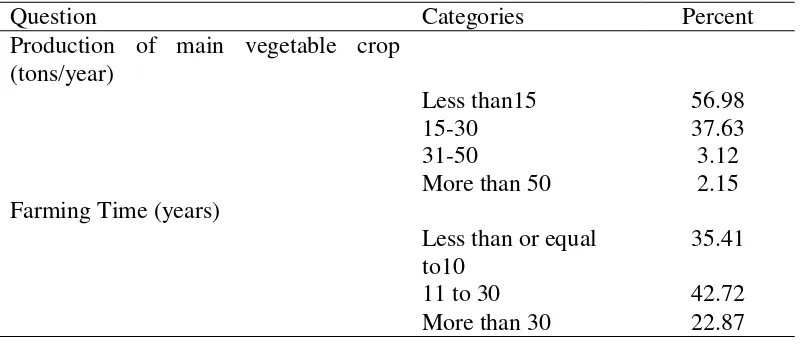
Less than 1000 14.58 The principal occupation of a majority of the farmers is cultivation of vegetables. Food grain crops are cultivated to meet the household food security needs. The sample smallholder farmers allocated large share of their cultivated land area to vegetables. Mustard green, cucumber, eggplant, long beans, sweet potatoes and spinach, onions, tomatoes were the main vegetables. Mustard green and sweet potato were the principle vegetables preferred by all.
Table 7 Production from land and farming time of Smallholder farmers
Question Categories Percent
23
the production category of 15-30 ton/year. Little number of smallholder farmers (3.12%) were in the category of 31-50 ton/year and 2.15% mentioned their production was above 50 ton/year. Four respondents did not mention their production because they were farming only for their subsistence. In terms of experience, 35.41% farmers were involved in farming for less than or equal to 10 years. 42.72% were involved for 11-30 years while 22.87% were involved for more than 30 years.
Satisfaction with Land Production
The low income, inefficient and insufficient availability of inputs always
restricts smallholder farmer‟s productivity. The study also experienced such
condition in the study area. Out of total sampled smallholder, 28.13% farmers were not satisfied with the production of their land while 71.87% were satisfied. Out of 28.13% farmers who were not satisfied from their production was because of several reasons like high prices of good quality seeds, heavy rainfalls destroys vegetables quickly and easily, lack of family involvement (agriculture is becoming less important because of the continuous decrease total production), lack of financial resources, natural setting or position (sloppy) of their land disturbs desired production, unavailability or high prices of other inputs like pesticides, fertilizers, and provision of technology.
Table 8 Satisfaction with Production from Land
Question Response Percent
Production from land Satisfied 28.13
Not Satisfied 71.87
Reasons of un-satisfaction Lack of agricultural Inputs 21.4
Excessive rainfall 14.3
Lack of family involvement 7.1 Lack of financial resources 10.7 Lack of Institutional Support 10.7 Natural Land setting/Position 17.9 Provision of Technology 14.3
Soil Fertility 3.6
Trend in Production
24
described that their production from agriculture (maize and paddy) was less because of soil infertility and water availability to irrigate their fields. The land was extensively used for agriculture and the production was not fulfilling the
household‟s food demands. The fast growth time was a reason of shift for 32.14% of smallholder farmers.
Table 9 Trend in Agricultural Practices
Question Response Percent
Shift in agriculture No 70.83
Yes 29.17
Reasons of Shift Agriculture was
expansive 28.57 smallholders encouraging them for participation in supermarkets but there is always a limitation that keeps these poor of the poorest farmers away from those high value markets to take advantage of it. This survey tried to explore the perceptions of smallholder farmers towards participation in supermarkets.
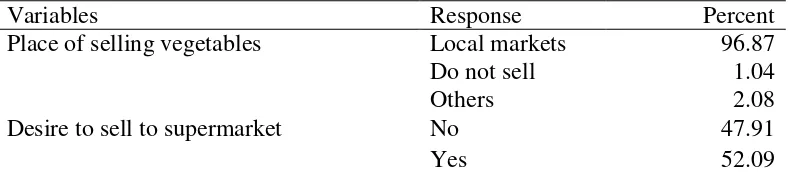
Table 10 Desire of smallholder farmers to participate in supermarket
Variables Response Percent
Place of selling vegetables Local markets 96.87
Do not sell 1.04
Others 2.08
Desire to sell to supermarket No 47.91
25
8.69% farmers already had contract with other middleman and according to the nature of the contract they must sell their vegetables to them. The results further showed that, 4.34% responded did not have link to supermarket otherwise they would participate. By asking whether they will fulfill the quality and quantity demand of the supermarket if they are provided a link and a chance to participate in supermarket and also keeping in mind current production from your land size? The answer was positive and they were ready to agree upon the nature of contract with supermarkets. Only one farmer responded that he needed good quality fertilizers to increase his produce. Small number of smallholder farmers (6.52%) smallholder pursued that they do not want to practice organic agriculture which is one of the primary requirement for participating in supermarket. The reason for not doing organic agriculture was; it needs more labor, more energy, time, care and money while by using all the mentioned resources the production is always less than compare to inorganic agriculture. Very little number of smallholders (13.09%) responded that they lack information and awareness about the contracts necessary for participation in supermarkets. Financial resource was a concern for 15.21% of faremrs in producing good quality vegetables and enough quantity acceptable to the supermarkets while 30.46% perceived the complex contratc system with supermarkets as a major hurdle for their participation. In addition, fulfilling the quality and quantity demands of super markets was also key concern that limited their participation in supermarkets and 2.17% faremrs responded that lack of infrastructure was the main hurdle for caryying the produce on time.
The results showed that 4.34% sample smallholder were not satisfied with the paying system of supermarket and they did not find it effective and attactive becuase most of the sampled smallholder farmers were economically marginalized. Respondents mentioned that they need money on the spot when they sell their crops in the markets and the perception was that it could be achieved only if they sell their produce in traditional markets. In supermarkets according to the contract system sometimes farmers are paid after a week or a month of selling crops. Smallholder farmers uses this money to buy inputs for growing vegetables in the next croping season. Quality standard of agricultural crops set by supermarekts was another concern of the respondents. In this regard, (10.86%) farmers were of the opinion that they cannot produce the desired quality vegetables beacause of alck of finance, lack of good quality agricultural inputs. Small landholding size was also an issue for the respondents which accordinfg to them limits their participation in supermarkets becuase of the fewer amount of produce that they get from those small lands.
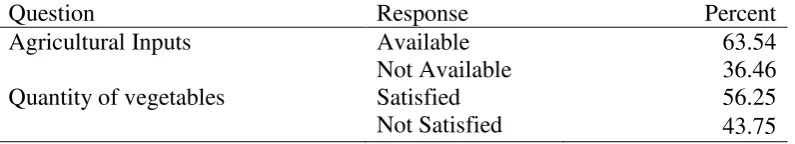
Availability of Inputs for Agricultural Practices
Sufficient and good quality inputs availability is always a limiting factor in
26
vegetables. While 43.75% were satisfied but they still believed that their yield can be further improved by good quality fertilizers, pesticides, seeds, financial aid from the government and other agriculture related institutions, less rainfall disturbance and better irrigation facilities.
Table 11 Inputs available for practicing agriculture sustainably
Question Response Percent
Agricultural Inputs Available 63.54
Not Available 36.46
Quantity of vegetables Satisfied 56.25
Not Satisfied 43.75
Table 12 Awareness level of smallholders
Question Response Percent
Member of a farmer‟s group Yes 13.54
No 86.45
Time spent in a farmer‟s group 1-9 84.61
10-19 7.69
20 and above 7.69
Total 100.0
Received agriculture realted training Yes 11.45
No 88.54
requirements of supermarkets and they would know about the health standards for quality and quantity of agricultural commodities. Out of those 13 farmers 84.61% spent 1-9 years in a farmers‟ group, 7.69% spent 10-19 years and also 7.69% spent more than 20 years. Training was another indicator supporting research
27
they need agricultural training to improve their production. Access to social media (subscribed to any news or bulletin related to agriculture) was the third indicator used for identifying the level of awareness of smallholder farmers and it was identified that 61.45% watched news on television and also regularly listened news on radio about agriculture if there is any while 38.54 said they have no access to such media.
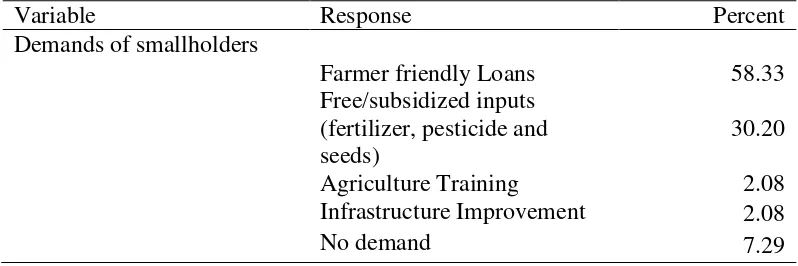
Demands of Smallholder Farmers from Government
There is a reasonable amount of literature supporting the argument that smallholders are amongst the poorest of poor (Wickramasinghe 2013; Zhou 2010; Roshetko et al 2011; Gabre- Madhin 2009) and lacks resources to perform their agriculture, they also vulnerable to external shocks form weather. The results from
sampled respondents showed that 58.33% farmers demanded farmer‟s friendly
loans from government following by 30.20 farmers which demanded for free or subsidized agricultural inputs including good quality fertilizers, pesticides and seeds. Smallholder farmers (2.08%) perceived that they need trainings to improve their yield from their lands and the same number of farmers wanted infrastructure improvement to be the main area of improvement which can sustain their agriculture.
Table 13 Requirements of smallholder‟s for agriculture
Variable Response Percent
Demands of smallholders
Farmer friendly Loans 58.33
Free/subsidized inputs (fertilizer, pesticide and seeds)
30.20
Agriculture Training 2.08
Infrastructure Improvement 2.08
No demand 7.29
Agricultural Sustainability related Farming Practices of Smallholder Farmers The goals and values of long-term sustainability must be reflected in
combinations of practices and methods consistent with an individual farmer‟s resources, including farmer‟s knowledge base, technical know-how, and farming opportunities. Millions of small farmers in Indonesia do not have a good resource and knowledge base, and this limits their capacity to pursue sustainability goals. Majority of sampled smallholders (87.5%) were satisfied with the quality of their vegetables while 12.5% were not because of its bad taste, reduced size problems. The smallholders believed those problems could be controlled by controlling the disease and its vector. Out of total sampled smallholder, 28.13% farmers were not satisfied with the quantity of yield while 71.87% were satisfied. The reasons of un-satisfaction were lack excessive rainfalls, lack of good agricultural inputs, financial resources that diminishes their total yield.