THE EFFECT OF NITROGEN FERTILIZATION ON
SOIL N
2O EMISSIONS FROM OIL PALM CULTIVATION
ON DEEP PEAT
SATRIA OKTARITA
GRADUATE SCHOOL
BOGOR AGRICULTURAL UNIVERSITY
BOGOR
STATEMENT OF THESIS, SOURCES OF INFORMATION
AND COPYRIGHT*
I hereby certify that this thesis entitled The Effect of Nitrogen Fertilization on Soil N2O Emissions from Oil Palm Cultivation on Deep Peat is my work under
the supervising committee and never been submitted in any form to any higher education institution. Materials previously published or written by other person mentioned in the text and listed in the Bibliography at the end of this thesis.
I hereby bestow the copyright of my papers to the Bogor Agricultural University.
RINGKASAN
SATRIA OKTARITA. Dampak Pemupukan Nitrogen Terhadap Emisi N2O Tanah
Pada Perkebunan Sawit di Gambut Dalam. Dibimbing oleh SYAIFUL ANWAR dan KRISTELL HERGOUALC’H.
Sektor pertanian berkontribusi 13.5% dari total emisi Gas Rumah Kaca (GRK) dunia (IPCC 2007). Emisi dari sektor ini umumnya dalam bentuk dinitrogen oksida (N2O) (46%), metana (CH4) (45%) dan karbon dioksida (CO2)
(9%) (Baumert et al. 2005). N2O termasuk dalam GRK berumur panjang and
memiliki potenti gas rumah kaca (GWP) 300 kali lebih tinggi dibanding CO2.
Konsentrasi N2O pada tahun 2005 adalah sebesar 319 ppb dimana konsentrasi ini
lebih tinggi 18% jika dibanding konsentrasi sebelum masa industrialisasi (IPCC 2007). Sawit merupakan salah satu komoditas yang berkembang sangat pesat di daerah tropis (Fitzherbert et al. 2008). Malaysia dan Indonesia mulai mendominasi produksi minyak sawit sejak tahun 1966 (Poku 2002) dan Indonesia menjadi negara produsen minyak sawit mentah (CPO) terbesar didunia sejak tahun 2005. Pada tahun 2006 Indonesia memiliki 4.1 juta hektar perkebunan sawit atau sekitar 31% dari luas total perkebunan sawit diseluruh dunia (Koh dan Wilcove 2008). Konversi hutan alam menjadi perkebunan sawit berkontribusi terhadap 10% deforestasi di Indonesia dan Malaysia pada tahun 1990 hingga 2010 (Koh et al. 2011) menyebabkan hilangnya keanekaragaman hayati dan berkontribusi terhadap perubahan iklim (Murdiyarso et al. 2010, Hergoualc’h dan Verchot 2011). Disisi lain sawit merupakan salah satu penyumbang pertumbuhan ekonomi dan sumber bahan bakar alternatif (Sheil et al. 2009).
Gambut diklasifikasikan sebagai lahan marginal karena miskin hara (Murdiyarso et al. 2010, Sabiham 2010). Penambahan nutrisi tanah misalnya pupuk untuk meningkatkan hasil pr
oduski dapat meningkatkan oksidasi bahan organik tanah dan meningkatkan emisi CO2 dan N2O dari tanah (Murdiyarso et al. 2010, Hadi et al. 2001).
Tujuan penelitian adalah untuk (a) mengukur dampak dosis pupuk nitrogen terhadap emisis N2O tanah (b) mengetahui keterkaitan emisi tanah dengan
variabel lingkungan termasuk kelembaban tanah, suhu, pori tanah terisi air (WFPS) dan ketersediaan nitrogen.
Selama masa pengukuran 85% flux tanah merupakan flux positif (emisi). Flux negatif dan rendah ditemukan pada pengukuran yang dilakukan pada kondisi kering terutama pada tanggal 23 dan 25 Oktober 2012. Peningkatan emisi N2O
terlihat 10 hari setelah pemupukan pada semua perlakuan setelah terjadinya hujan. Puncak emisi terjadi 19 hari setelah pemupukan namun tidak sepenuhnya disebabkan oleh aplikasi pupuk.
Hasil penelitian ini menunjukkan hubungan yang signifikan antara N2O
(P=0.05) dengan variabel lingkungan yaitu tinggi muka air, kadar air volumetrik, WFPS, kadar air gravimetrik namun R2 sangat rendah (R2 =0.02, R2=0.08,
R2=0.02, R2=0.03). Tidak ditemukan hubungan yang nyata antara emisi N
2O baik
dengan NH4+ maupun NO3ˉ. Namun, N2O memiliki hubungan yang nyata dengan
rasio NO3ˉ/ NO3ˉ+ NH4+ sebelum atau setelah inkubasi (R2= 0.16 P= 0.02, R2=
Emisi N2O yang ditemukan dalam penelitian ini jauh lebih besar jika
dibandingkan dengan literatur dari penelitian terdahulu tentang emisi sawit yang ditanam di daerah gambut (Melling et al. 2007). Penelitian terdahulu menemukan emisi gambut tahunan sebesar 1.2 kg N ha-1 tahun-1 dengan kisaran flux antara 0.9
- 58.4 mg N m-2 h-1 pada perkebunan sawit berusia 4 tahun yang dipupuk dengan
nitrogen sebesar 103 kg N ha-1 tahun-1. Penelitian ini menemukan bahwa emisi
N2O masing-masing 18, 10 dan 20 kali lebih besar untuk N0, N1 dan N2. Kajian
SUMMARY
SATRIA OKTARITA. The Effect of Nitrogen Fertilization on Soil N2O
Emissions from Oil Palm Cultivation on Deep Peat. Supervised by SYAIFUL ANWAR and KRISTELL HERGOUALC’H.
Agriculture contributes to 13.5% of worldwide greenhouse gases (GHG) emissions (IPCC 2007). The emissions from this sector are mainly in the form of nitrous oxide (N2O) (46 %), followed by methane (CH4) (45%) and Carbon
dioxide (CO2) (9%) (Baumert et al. 2005). N2O is classified as long-lived GHG
and has a global warming potential (GWP) 300 times higher than that of CO2. The
N2O concentration in 2005 was 319 ppb, about 18% higher than its pre-industrial
value (IPCC 2007). Oil palm is one of the most rapidly increasing crops in the tropics (Fitzherbert et al. 2008). Malaysia and Indonesia began to dominate oil palm production in 1966 (Poku 2002) and Indonesia has been the largest producer of Crude Palm Oil (CPO) since 2005. In 2006 the country had 4.1 million ha of oil palm plantations or 31% worldwide plantation area (Koh and Wilcove 2008). Conversion of primary forests into oil palm plantations accounted for more than 10 % of deforestation in Indonesia and Malaysia between 1990 and 2010 (Koh et al. 2011) causing large biodiversity losses and contributing to climate change (Murdiyarso et al. 2010, Hergoualc’h and Verchot 2011). On the other hand, oil palm is also a major driver of economic growth and a source of alternative fuel (Sheil et al. 2009). Peatlands are classified as marginal due to their poor chemical and physical soil properties (nutrient limited) (Murdiyarso et al. 2010, Sabiham 2010). The addition of nutrient such as fertilizer to promote plantation productivity are likely to increase oxidation of soil organic matter and stimulating an increased soil CO2 and N2O emission (Murdiyarso et al. 2010, Hadi et al.
2001).
The objectives of this study were (a) to investigate the impact of N dose applied on soil N2O emissions (b) to assess soil emissions relationship to key
environmental variables including soil moisture, temperature, water filled pore space (WFPS) and nitrogen availability.
We observed majority positive fluxes (85%) during the 6 months measurement. Fluxes data were most negative and low during drier days in particular on 23 and 25 October. We observed increasing N2O fluxes 10 days
after fertilization in all N treatments following the rain events. Emission peak was noticed 19 days after fertilization but didn’t seem to be related to the N application.
We found significant relationship (P=0.05) between water level, volumetric water content, WFPS, gravimetric water content and N2O but R2 was really low
(R2 =0.02, R2=0.08, R2=0.02, R2=0.03 respectively). No significant relationship
also found between soil NH4+, NO3ˉ and N2O emissions. However, N2O was
significantly related to ratio of NO3ˉ/ NO3ˉ+ NH4+ for both analysis before and
after incubation (R2= 0.16 P= 0.02, R2= 0.17 P=0.02 respectively).
The magnitude of N2O emissions of our study was much larger than what
reported in the literature for oil palm plantations on peat (Melling et al. 2007). The authors measured annual N2O emissions of 1.2 kg N ha-1 year-1 ranging from
ha-1 year-1. Our study found N
2O emissions were 18, 10 and 20 fold higher than
© Copy Right of IPB, 2014
All right reserved
Thesis
submitted to meet requirements for an award Magister of Science at Natural Resource and Environmental
Management
THE EFFECT OF NITROGEN FERTILIZATION ON
SOIL N
2O EMISSIONS FROM OIL PALM CULTIVATION
ON DEEP PEAT
GRADUATE SCHOOL
BOGOR AGRICULTURAL UNIVERSITY
BOGOR
2014
Title : The Effect of Nitrogen Fertilization on Soil N2O Emissions from
Oil Palm Cultivation on Deep Peat Name : Satria Oktarita
ID : P052110221
Approved by Supervising committee
Dr Ir Syaiful Anwar, MSc Head
Dr Kristell Hergoualc’h Member
Endorsed by
Head of Natural Resources and Environmental Management
Prof Dr Ir Cecep Kusmana,MS
Dean of Graduate School
Dr Ir Dahrul Syah, MScAgr
FOREWORDS
I would like to thanks my supervisors, Dr. Syaiful Anwar MSc and Dr. Kristell Hergoualc’h for their guidance, comments, discussions and suggestions to finish this study. I would also like to thanks my husband for the encouragements and my assistants, Ferdy and Fadly, for their hard work to assist in collecting data. I am also indebted to Novi and Melly for their hard work to analyze my samples.
This study was generously supported by the governments of Norway and Australia. This work was carried out as part of the CGIAR programs on Trees, Forests and Agroforestry (CRP6) and Climate Change, Agriculture and Food Security (CCAFS).
Bogor, March 2014
TABLE OF CONTENTS
LIST OF TABLES vi
LIST OF FIGURES vi
1 INTRODUCTION 7
Background 7
Objectives 2
Research Benefit 2
Scope of Research 2
2 LITERATURE REVIEW 3
Peatlands 3
Oil Palm 3
Nitrogen Cycling 3
Factors Influence Soil fluxes 4
3 METHOD 5
Site Description 5
Experimental Design 5
Equipments and Materials 6
Data Analysis 7
4 RESULT AND DISCUSSION 8
Result 8
Discussion 13
5 CONCLUSION AND SUGGESTION 14
Conclusion 14
Suggestion 14
REFERENCES 14
LIST OF TABLES
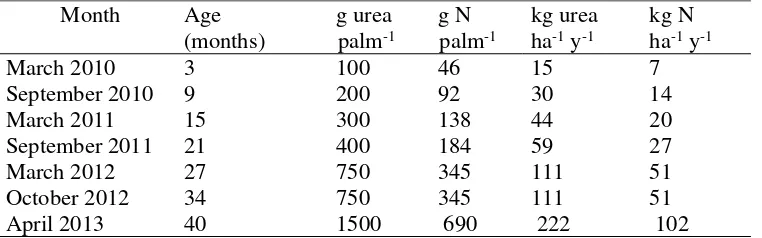
1 Fertilizer events of N1 Plot 6
2 Water level, gravimetric water content, volumetric water content 9 and WFPS during the study period
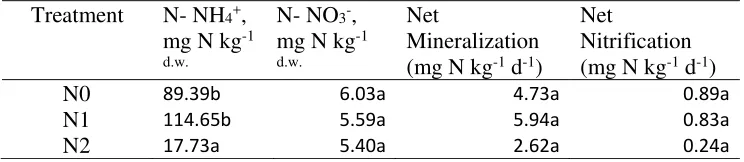
3 Ammonium, Nitrate, Net Mineralization and Nitrification for the 10 different N treatment
LIST OF FIGURES
1 Major transformation in nitrogen cycle 4
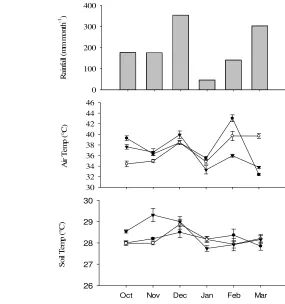
2 Monthly rainfall (a), air temperature (b) and soil temperature (c) 9 in the top 10 cm of the soil profile for N0 ( ) N1 ( )
and N2 ( )
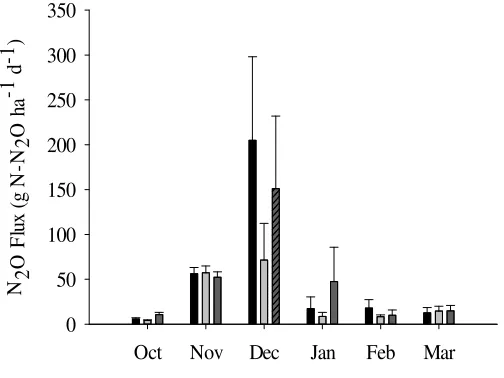
3 Monthly fluxes (g N ha-1 d-1) of N0( ),N1 ( ),N2( ) in the 11
oil palm plantation, Jambi, Sumatra, Indonesia
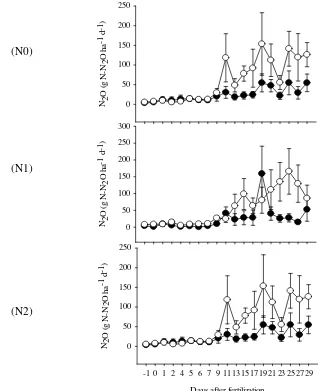
4 N2O Fluxes (mean ± SE) of CP ( ), FP ( ) for N0, N1 and 12
N2 during intensive sampling (d-1 to d+29)5
1
INTRODUCTION
Background
Agriculture contributes to 13.5% of worldwide greenhouse gases (GHG) emissions (IPCC 2007). The emissions from this sector are mainly in the form of nitrous oxide (N2O) (46 %), followed by methane (CH4) (45%) and Carbon
dioxide (CO2) (9%) (Baumert et al. 2005). N2O is classified as long-lived GHG
and has a global warming potential (GWP) 300 times higher than that of CO2. The
N2O concentration in 2005 was 319 ppb, about 18% higher than its pre-industrial
value (IPCC 2007). N2O emissions largely come from soil management including
tillage and other cropping practices, such as fertilizer application (Baumert et al. 2005). Worldwide consumption of synthetic N fertilizers has increased by about 150% since 1970 to about 82 Tg N y-1 in 1996 (IPCC 2000).
Oil palm is one of the most rapidly increasing crops in the tropics (Fitzherbert 2008). Malaysia and Indonesia began to dominate oil palm production in 1966 (Poku 2002) and Indonesia has been the largest producer of Crude Palm Oil (CPO) since 2005. In 2006 the country had 4.1 million ha of oil palm plantations or 31% worldwide plantation area (Koh and Wilcove 2008). According to Rahutomo et al. (2009) oil palm plantations are distributed in all over twenty two provinces. In 2010 the plantation area was 7.2 million ha producing 46% of the world’s crude palm oil (Bromokusumo and Slette 2010). Recent data on oil palm area for 2012 was estimated at around 9.2 million ha (MoA 2012).
Conversion of primary forests into oil palm plantations accounted for more than 10 % of deforestation in Indonesia and Malaysia between 1990 and 2010 (Koh et al. 2011) causing large biodiversity losses and contributing to climate change (Murdiyarso et al. 2010, Hergoualc’h and Verchot 2011). On the other hand, oil palm is also a major driver of economic growth and a source of alternative fuel (Sheil et al. 2009). The growing trend is likely to continue in the future as Indonesia aimed at doubling-up oil-palm production by 2020 (Koh and Ghazoul 2010). The Indonesian government allows the development of oil palm plantations on marginal lands such as peatlands however forbids plantation on peat deeper than 3 m (RSPO 2012). Furthermore, according to the regulation oil palm can only be grown on sapric and eutrophic peat. So far 11% of the plantations are located on peatlands (Koh et al. 2011). The Presidential Instruction (Inpres) No. 10/2011 which is part of bilateral cooperation between the governments of Indonesia and Norway (Murdiyarso et al. 2011) postpones the issuance of new licenses on primary natural forests and peatlands for area included in the indicative map.
2
mature palm (3-25 years). The addition of nutrient such as fertilizer to promote plantation productivity are likely to increase oxidation of soil organic matter and stimulating an increased soil CO2 and N2O emission (Murdiyarso et al. 2010,
Hadi et al. 2001).
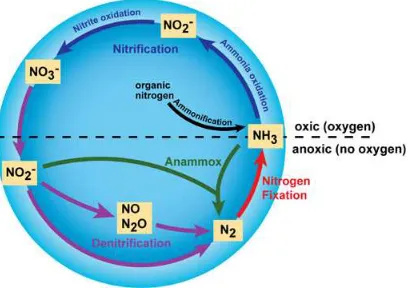
The production and consumption of N2O in the soil is mainly due to the
activity of soil microbes through nitrification and denitrification process (Smith et al. 1982, Davidson et al. 2000, Murdiyarso et al. 2010). Nitrification is the aerobic microbial oxidation of ammonium (NH4+) to to nitrate (NO3-) and
denitrification is the anaerobic microbial reduction of nitrate (NO3-) to nitrogen
gas (N2). Nitrous oxide is a gaseous intermediate in the reaction sequence of denitrification and a by-product of nitrification that leaks from microbial cells into the soil and ultimately into the atmosphere (Bouwman 1998, Smith et al. 2003, IPCC 2006, Jauhiainen et al. 2012). The controlling factors of the flux include soil moisture and temperature (Hadi et al. 2001, Inubushi et al. 2003, Hadi et al. 2005, Melling et al. 2007), nitrogen availability (Smith et al. 1982, Bouwman 1998, Davidson et al. 2000, Verchot et al. 2006, Melling et al. 2007). The effect of soil water content on soil N2O effluxes described as a monotonic curve with
maximum emissions around 60% of water-filled pore space (WFPS) (Bouwman 1998, Murdiyarso et al. 2010). Studies have also shown that N2O emission and
water content can be positively and negatively correlated (Davidson et al. 2000). cou.
There has been, to our knowledge, only one publication reporting soil N2O
fluxes from oil palm plantations on tropical peats (Melling et al. 2007). The authors measured annual N2O emissions of 1.2 kg N ha-1 year-1 ranging from 0.9
to 58.4 mg N m-2 h-1 in a 4 year old plantation fertilized at a rate of 103 kg N ha-1
year-1. This study however didn’t capture the magnitude and dynamics of
emissions following fertilizer application.
Objectives
The objectives of this study were (a) to investigate the impact of N dose applied on soil N2O emissions (b) to assess soil emissions relationship to key
environmental variables including soil moisture, temperature, water filled pore space (WFPS) and nitrogen availability.
Research Benefit
This research is the first one evaluating the effect of N fertilization on soil N2O emission from oil palm plantations on peat. The knowledge will be useful for
plantation developers, government agencies and related stakeholders in their efforts and policies to implement sustainable oil palm management in peat lands and evaluate impacts on climate change.
Scope of Research
3
2
LITERATURE REVIEW
2.1 Peatlands
Peat is traditionally defined as being synonymous with turf being partially carbonized plant tissue formed in wet conditions by decomposition of various plants. The different between tropical wetland and other wetlands which influence management is the nature of the organic soils. This is because the plants from which the peat is formed are different. In the tropics, trees are frequently involved as opposed to sedges and sphagnum moss in temperate regions (Andriesse 1988). Peat (and carbon) accumulates as a result of a positive net imbalance between high tropical ecosystem primary production and incomplete organic matter decomposition in permanently saturated soil conditions, the organic matter originated from plant residue and plant tissue. Generally peat was formed in the alluvial plain, especially in the basin between big rivers. Based on fertility, peat soil can be differentiated as oligotrophic, mesotrophic, and eutrophic. Oligotrophic is unfertile peat that is poor of bases. Eutrophic is fertile peat which is rich in minerals and bases, while mesotrophic is peat that has properties in between oligotrophic and eutrophic (Hooijer et al. 2010, Presetyo and Suharta, 2011).
2.2 Oil Palm
Oil Palm (Elaeis guineensis) is a tropical palm native to West and Central Africa. Grown in plantations it produces 3–8 times more oil from a given area than any other tropical or temperate oil crop. Oil (triacylglycerols) can be extracted from both the fruit and the seed, crude palm oil (CPO) from the outer mesocarp and palm-kernel oil from the endosperm. Most crude palm oil is used in foods. In contrast, most palm-kernel oil is used in various non-edible products, such as detergents, cosmetics, plastics, surfactants, herbicides, as well as a broad range of other industrial and agricultural chemicals (Wahid et al. 2005).
The native habitat of oil palm is tropical rainforest with 1780–2280 mm annual rainfall and a temperature range of 24–30°C (minimum and maximum), seedlings do not grow below 15°C. Oil palm is tolerant of a wide range of soil types, as long as it is well watered (NewCROP 1996). Oil palm needs humid equatorial conditions to thrive, and conditions in Southeast Asia are ideal. Seasonal droughts at higher tropical latitudes greatly reduce yields (Basiron 2007), water-stressed palms produce fewer female flowers and abort (drop) unripe fruit. Palm productivity benefits from direct sunshine: the lower incidence of cloud cover over much of Southeast Asia is thought to be one reason why oil palm yields are higher than that in West Africa (Dufrene et al. 1990).
2.3 Nitrogen Cycling
The primary driver for the industrial era increase of N2O was concluded to
be enhanced microbial production in expanding and fertilized agricultural lands. The increase in N2O since the pre-industrial era now contributes a radiative
forcing of +0.16 ± 0.02 W m–2 and is due primarily to human activities,
4
about 40% of total N2O emissions are anthropogenic but individual source
estimates remain subject to significant uncertainties. Long-lived greenhouse gases (LLGHGs), for example, CO2, methane (CH4) and nitrous oxide (N2O), are
chemically stable and persist in the atmosphere over time scales of a decade to centuries or longer, so that their emission has a long-term influence on climate. Because these gases are long lived, they become well mixed throughout the atmosphere much faster than they are removed and their global concentrations can be accurately estimated from data at a few locations (IPCC 2007).
The production and consumption of N2O in the soil is mainly due to the
activity of soil microbes through nitrification and denitrification process (Smith et al. 1982, Davidson et al. 2000, Murdiyarso et al. 2010). Nitrification is the aerobic microbial oxidation of ammonium (NH4+) to to nitrate (NO3-) and
denitrification is the anaerobic microbial reduction of nitrate (NO3-) to nitrogen
gas (N2). Nitrous oxide is a gaseous intermediate in the reaction sequence of
denitrification and a by-product of nitrification that leaks from microbial cells into the soil and ultimately into the atmosphere (Bouwman 1998, Smith et al. 2003, IPCC 2006, Jauhiainen et al. 2012).
Figure 1 Major transformations in nitrogen cycle (from Bernhard 2012) 2.4 Factors influence Soil fluxes
The controlling factors of the flux include soil moisture and temperature (Hadi et al. 2001, Inubushi et al. 2003, Hadi et al. 2005, Melling et al. 2007), nitrogen availability (Smith et al. 1982, Bouwman 1998, Davidson et al. 2000, Verchot et al. 2006, Melling et al. 2007). The effect of soil water content on soil N2O effluxes described as a monotonic curve with maximum emissions around
60% of water-filled pore space (WFPS) (Bouwman 1998, Murdiyarso et al. 2010). Studies have also shown that N2O emission and water content can be
5
3
METHOD
Site Description
Flux measurements were conducted at an oil palm plantation located at Arang-arang village in Muaro Jambi district. The annual rainfall is 2144 mm y-1
with an average air temperature of 28.8°C. The peat at the research site is deep (> 8.5 m) and slightly decomposed (fibric). The site was cleared of native vegetation in 2004 and planted in December 2009 with 148 palms ha-1. Planting distance is 9
m in a triangular pattern. Halfway to the site can be reached by car but the rest is only accessible by tractor. Drainage canals in the plantation are deeper than 4 meters. The first fertilization was carried out on March 2010 when the palms were 3 month old. The palms receive fertilizer twice a year in March and September until they reach maturity at about 3 years. After they reach maturity, the palms are fertilized once per year in April.
Experimental Design
We used 3 nitrogen doses in the form of urea (N0, N1, N2) of 0 kg N ha-1
y-1, 51 kg N ha-1 y-1 and 102 kg N ha-1 y-1, respectively. 10 replicate chambers
were installed in each N dose treatment. 5 chambers were placed near the palm and 5 others at mid-distance between two palms. Fertilizer was applied in circle 1m around oil palm. In the N1 and N2 treatments, the 5 chambers placed close to the palms receive 750 g urea and 1500 g urea, respectively. This area will be referred to as the close to palm (CP), while the other 5 chambers that are not receiving fertilizer will be referred to as the further from palm (FP). As we described above chamber was placed inside this circle area (CP). Amount of urea spread in the chamber was calculated based on the relative area of chamber surface to the total surface of fertilizer circle. This is to make sure that we applied N fertilizer in the chamber based on the assumption that it is distributed evenly. Radius and basal area of oil palm was also taken into consideration in the calculation. Fertilization events of N1 plot can be found in table 1. N2 Plot doses were always the doubled of N1.
6
x 100 Soil porosity
Equipments and Materials
Soil Flux Measurement
Soil fluxes were measured using the static chamber technique (Verchot et al. 1999) from October 2012 until March 2013 using PVC made chambers (diameter and height of 26 cm and 40 cm, respectively). Chambers were pushed into the soil to a depth of 2–3 cm. Gas samples were collected on 0, 10, 20 and 30 minutes after closure using a 50 ml syringe and stored in a 40 ml customized glass vials. Gas samples were transported to CIFOR's laboratory in Jambi for further analysis by gas chromatography. Samples were analyzed within 30 days after collection. We modified Shimadzu GC 14 A, 2 valco valves with a computerized injection system to enable the machine analyze 60 samples sequentially. Nitrogen was used as carrier gas to transport samples through a stainless steel column equipped with Flame Ionization Detector (FID) for CH4 and Electron Capture
Detector (ECD) for N2O. The column is 3 m long packed by porapak Q with
80-100 mesh.
Climatic data such as rainfall, air pressure and temperature were also collected. Rainfall data collected from a rain gauge installed around 3 km from the plot. A digital barometer from greisinger electronic (Germany) was used to measure air pressure at each sampling time for each chamber. Environmental factors were also obtained namely soil temperature, gravimetric moisture, WFPS and nitrogen availability. Soil temperature was measured using a digital soil thermometer v.GTH 1170 from greisinger electronic. Soil moisture kit from Delta-T Devices Ltd (UK) was employed to measure gravimetric soil moisture. The soil water-filled pore space (WFPS) was calculated based on Haney and Haney (2010):
Soil water content (g g-1) = Weight of moist soil- Weight of oven dried soil
Weight of oven dried soil
Gas fluxes were calculated from the rate of change of N2O concentration in
the chamber headspace, determined by linear regression based on the four samples (Verchot et al. 1999). The slope of the best linear fit is expressed in mass units per space by using the ide al gas law:
N2O (µ N2O m-2 h-1) = N2O x Pressure x 28 x Chamber height
7
Where N2O is rate of N2O concentration in ppm N2O m-2 h-1 in the chamber
headspace, pressure is air pressure in pascal (Pa), 28 g mole-1 is the mass of N (14
g 2) per mole of N2O, chamber height is in meter, air temperature is in Kelvin
(273+°C), gas contant is 8.31441 j k-1 mol-1.
Nitrogen Availability
Laboratory incubations were carried out to measure the rates of net mineralization and net nitrification. Soil samples were collected on February 2013. One soil sample per chamber collected within 0-10 cm depth. Samples transported to the laboratory and refrigerated until incubation. The coarse roots and organic matter detritus was manually removed from the soil samples. The procedure described by Hart et al. (1994) was used to determine net mineralization and net nitrification. A 10-g soil subsample was extracted in 100 ml of 2M KCl to determine inorganic N concentrations. These extracts were shaken for an hour with magnetic stirrer and settled for 24 hours. A 20-mL aliquot of the supernatant was removed, filtered through a grade no.42 whatmann filter paper and frozen for later analysis. NH4+ analysis was done on auto analyzer
from Bran LuebbeTM using colorimetric method with indophenols blue (Solorzano
1969). Determination of NO3- was done on U-2001 spectrophotometer from
Hitachi using brucine procedure (EPA 1971). A second subsample of 10 g was incubated in the dark at room temperature (25-28°C) for 10 days. After 10 days, the incubated sample was extracted according to the procedures described above The net N mineralization rate was calculated as the change in NH4+ + NO3
-concentration during the 10 day incubation. Net nitrification rate was calculated as the difference between initial and final NO3- concentrations.
Data Analysis
Statistical analysis was done with SPSS software v.19. The data set showed a non-normal distribution (Shapiro-Wilk test). A log transformation of the data set was performed as an attempt to fix the distribution but gave unsatisfactory result. Thus differences in N2O emission among N doses determined using non
parametric analysis (Kruskal Wallis Test). Simple regression analyses were carried out to examine relationships between N2O emission and environmental
8
4
RESULT AND DISCUSSION
Result
Climatic observation
During our study period, there was no clear distinction between dry and wet season. Rainfall was highest in December 2012 (354 mm) and lowest in January 2013 (36.42 mm). Flux data were collected in the field around 9 am to 2 pm. Thus, every month we rotated the measurement time for each plot in order to capture the variability. Air temperature fluctuated throughout the measurements from 24.6°C to 49.6°C with high relative humidity. While air temperature fluctuates during the day, mean of soil temperature remains stable at around 28°C. The first fertilization treatment was conducted on 23 October 2012. We observed no rain event on the fertilization day and 2 days after fertilization (0 mm). In opposite, the second fertilization on 18 April 2013 was done during rainy season where rainfalls continuously occurred one week after fertilization.
(a)
Oct Nov Dec Jan Feb Mar
S
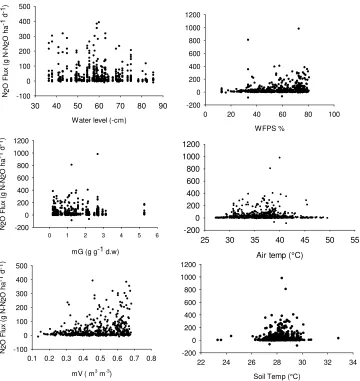
9 Water level (WL) ranges from -36.5 cm to -85.5cm. We cannot measure WL data on December 2012 when rainfall was the highest. Based on 5 months observations (23 measurements), there was no clear relationship across WFPS, mG, mV, WL and rainfall. We observed weak relationship also between mV and WFPS.
Table 2 Water level (WL), gravimetric water content (mG), volumetric water content (mV) and WFPS during study period
Values are mean ± standard error (in parenthesis)
Means with the same letter are not significantly different n.a. is not available due to missing data.
Nitrogen Availability
Inorganic N pools were dominated by NH4+ in all N treatments (Table 3).
Soil sampling was conducted on February. Soil NH4-N concentration at N0, N1,
N2 varied from 19.94 to 188.32, 47 to 290.42, 2.49 to 42.72, respectively. We observed some high NH4+ concentrations at N1 and as expected it came from the
CP zone. NO3-N concentration at N0,N1,N2 ranged from 0.08 to 18.45, 0.19 to
14.93, 0.46 to 15.28 respectively. In summary, we observed higher N availability at N0, N1 than that of N2 treatment. We found significant different among N treatments for NH4+ (P=0.0002). However there were no significant found on NO3-, net mineralization and net nitrification among the N treatments (P=0.77, P=0.25, P=0.05 respectively). The result of net mineralization showed majority positive value which indicate no NO3- loss during incubation.
Table 3 Ammonium, Nitrate, Net Mineralization and Nitrification for the different N treatment
10
3.3 N2O Fluxes
We observed majority positive fluxes (85%) during the 6 months measurement. N2O fluxes from the soil showed seasonal fluctuation. Fluxes data
were most negative and low during drier days in particular on 23 and 25 October and high relatively high in December. We observed low emissions in March despite the high monthly rainfall due low rainfall during measurement and two days before measurement. Few negative fluxes were also recorded during the relatively wet days. Monthly fluxes were calculated from the average of ten chambers (n=10) for each plot except for October and November when we conducted intensive sampling of 9 (n=90) and 11 (n=110) days respectively. This is to ensure a robust calculation that avoid under or over estimation. N2O
Emissions remain low on October at the fertilization plot (N1 and N2). It increased on November and December following the rain events with a similar magnitude for all N treatments and control. Emission relatively similar on January, February and March. We observed high variability of fluxes on December for all N treatments.
Oct Nov Dec Jan Feb Mar
N 2
in the oil palm plantation, Jambi, Sumatra, Indonesia
3.4 Intensive Sampling
We examined the dynamic and magnitude of N2O emission after
fertilization through an intensive samplings on October and November. We observed increasing N2O fluxes 10 days after fertilization in all N treatments
11 day 2 and 3 after fertilization. Overall, we didn’t see the effect of fertilizer in both N1 and N2 treatment.
during intensive sampling (d-1 to d+29)
3.5 N2O Fluxes and its controlling factor
We observed maximum fluxes were occurred when water level (WL) was around -60 cm. Fluxes seem to decrease when WL lower than -60cm. N2O
emission were maximum at WFPS around 60-80 %. Fluxes also maximum when soil temperatures were 28-29 ºC. Fluxes were decreasing when temperature above 30 ºC. We found significant relationship across all measured environmental factors, however R2 was really low. Gravimetric and volumetric water content
12
respectively). Water content and WFPS also significantly correlated (P<0.001 R2=0.10).
13
Discussion
The bulk density in our research site was 0.23 g cm-3 and higher than the
previous study by Anshari et al. (2010). The authors measured the impact of drainage on peat properties including on oil palm plantations located in Kalimantan which ranged from 0.07-0.13 gcm-3. We suggest that the higher BD
was due to more intensive compaction in our site during land preparation. Particle density was 1.11 g cm-3 and slightly lower than previous published data by
Firdaus et al. (2010) that is 1.27 g cm-3.
Our study is the first one evaluating the effect of N fertilization on soil N2O
emission from oil palm plantations on deep peat. We did not observe the effect of fertilizer during this study. This idea was supported by fact that mean of fluxes were not significantly different over the study period. Hence, the annual fluxes of N2 were relatively similar to N0. The absence of N2O emission stimulation after
N fertilization during the fertilizer application might be due to natural heterogeneity of peat soils. The variability of our fluxes data is high. Thus, we suggest the importance of long term flux measurement and suitable method in order to capture this variability.
The magnitude of N2O emissions of our study was much larger than what
reported in the literature for oil palm plantations on peat (Melling et al. 2007). The authors measured annual N2O emissions of 1.2 kg N ha-1 year-1 ranging from
0.9 to 58.4 mg N m-2 h-1 in a 4 year old plantation fertilized at a rate of 103 kg N
ha-1 year-1. The annual flux of N0, N1 and N2 were 29.33 ±10.2, 16.75 ±4.6 and
28.35 ±7.5 kg N-N2O ha-1 yr-1, respectively. Our study however found closer
result to IPCC (2006) emission factor for croplands on organic soil which is 16 kg N ha-1 y-1. In fact our results were higher than IPCC default value. We also
compared our result with the recent meta-analysis by Hergoualc’h and Verchot (2013) on the response of soil fluxes to land-use change (LUC) in tropical peatlands. The study reviewed the soil N2O Fluxes from different land uses
including forest, degraded forest, croplands and shrublands, rice fields, OP oil palm plantation, Acacia crassicarpa plantation and Sago palm plantation. The N2O
fluxes in this review ranged from 0.4-5 kg N ha-1 year-1. Thus, our study is
reported the highest N2O fluxes in tropical peat, so far, regardless of land uses or
ecosystem types. Our study found significant correlation between water content and N2O fluxes with maximum emissions occurred at around 60%-80% of
water-filled pore space (WFPS), this result is not in agreement with previous studies (Bouwman 1998). Studies have also shown that N2O emission and water content
can be either positively or negatively correlated (Davidson et al. 2000). This study, however, observed that the correlation were mostly positive. Our result also suggest that lowering water level through drainage can increase N2O
emission which in agreement with Hergoualc’h et al. (2013), however in our study, emission kept increasing until water level lowered at -60cm and gradually decreasing after that. Shimidsu et al. (2013) reported that increasing rainfall enhanced N2O production through denitrification due to fertilizer application.
14
5
CONCLUSION AND SUGGESTION
Conclusion
Emissions in the N1 and N2 treatments were not larger than in the non-fertilized (N0) treatment. The annual flux of N0, N1 and N2 were 29.33 ±10.2, 16.75 ±4.6 and 28.35 ±7.5 kg N-N2O ha-1 yr-1,respectively. The absence of N2O
emission stimulation after N fertilizer application might be due to transformation of urea into other nitrogen forms other than N2O. We found significant
relationship between water level, volumetric water content, WFPS, gravimetric water content and N2O but R2 was really low. No significant relationship found
between soil NH4+, NO3ˉ and N2O emissions. However, N2O was significantly
related to ratio of NO3ˉ/ NO3ˉ+ NH4+. This study confirms the high
spatio-temporal variability of soil N2O fluxes and recommends the use of an appropriate
experimental design to capture the high flux variation. This knowledge will be useful for plantation developers, government agencies and related stakeholders in their efforts and policies to implement sustainable management in existing oil palm plantations on peat and evaluate impacts on climate change.
Suggestion
There is a need to conduct further research as long term measurement to understand better the temporal variation of the fluxes. Research on identifying the nitrogen pathway including as plant update, immobilization and volatilities of urea would provide a better knowledge on nitrogen cycle as of important processes in tropical peatlands.
REFERENCES
Andriesse, J. P. 1998. Nature and Management of Tropical Peat Soils, FAO Soil Bulletin http://www.fao.org (26 May 2012)
Anshari1 GZ, Afifudin M, Nuriman M, Gusmayanti E, Arianie L, Susana R, Nusantara RW, Sugardjito J, Rafiastanto A. 2010. Drainage and land use impacts on changes in selected peat properties and peat degradation inWest Kalimantan Province,Indonesia. Biogeosciences, 7: 3403–3419.
Baumert KA, Herzog T, Pershing J. 2005. Navigating the number GHG data and international climate policy. World Resources Institute. USA.
Bouwman AF. 1998. Nitrogen oxides and tropical agriculture. Nature. 392: 866-867
Bromokusumo AK, Slette JP. 2010. Indonesia: oilseeds and products 2010. USDA Foreign Agricultural Service. [Internet] [23 may 2012]. Available online: http://gain.fas.usda.gov .
15 Basiron, Y. 2007 Palm oil production through sustainable plantations. European
Journal of Lipid Science and Technology 109: 289–295.
Davidson EA, Keller M, Erikson HE, Verchot LV, Veldkamp E. 2000. Testing a conceptual model of soil emissions of nitrous and nitric oxide. Bioscience. 50:667–680.
Dufrene E, Ochs R, and Saugier B. 1990 Oil palm photosynthesis and productivity linked to climatic factors. Oleagineux 45: 345–353.
[EPA] United States Environmental Protection Agency. 1971. Analytical method and laboratories, method #: 352.1. [Internet] [23 may 2012]. Available online: http://water.epa.gov/
Fitzherbert EB. 2008. How will oil palm expansion affect biodiversity? Trends in Ecology and Evolution. 23: 538-545.
Firdaus MS, Gandaseca S, Ahmed OH, Majid NMA. 2010. Effect of Converting Secondary Tropical Peat Swamp Forest into Oil Palm Plantation on Selected Peat Soil Physical Properties. American Journal of Environmental Sciences 6 (4): 402-405.
Hadi A, Haridi M, Inubushi K, PurnomoE, Razie F, Tsuruta H. 2001. Effect of Land Use Change in Tropical Peat Soil on the Microbial Population and Emission of Greenhouse Gases. Microbes and Environment. 16 : 79-86.
Hadi A, Inubushi K, Furukawa Y, Purnomo E, Rasmadi M, Tsuruta H. 2005. Greenhouse gas emissions from tropical peatlands of Kalimantan, Indonesia. Nutrient cycling in Agroecosystems.71:73-80.
Hart SC, Stark JM, Davidson EA, Firestone MK. 1994. Nitrogen mineralization, immobilization and nitrification, in Methods of Soil Analysis: Part 2. Microbial and Biochemical Properties edited by Weaver R. W. et al. Soil Sci. Soc. of Am. Madison. 985–1018
Haney RL, Haney EB. 2010. Simple and Rapid Laboratory Method for Rewetting Dry Soil for Incubations. Communications in Soil Science and Plant Analysis. 41:1493–1501
Hergoualc’h K, Verchot L. 2011. Stocks and fluxes of carbon associated with land use change in Southeast Asian tropical peatlands: A review. Global Biogeochem. Cycles 25 .
Hergoualc’h K, Verchot L. 2013. Greenhouse gas emission factors for land use and land-use change in Southeast Asian peatlands. Mitig Adapt Strateg Glob Chang
HooijerA, Page S, Canadell JG, Silvius M, Kwadijk J, Wosten H, Jauhiainen J. 2010. Current and future CO2 emissions from drained peatlands in Southeast Asia. Biogeosciences, 7: 1505–1514.
Inubushi K, Furukawa Y, Hadi A, Purnomo E, Tsuruta H. 2003. Seasonal changes of CO2, CH4 and N2O fluxes in relation to land-use change in tropical
peatlands located in coastal area of South Kalimantan. Chemosphere 52. 603– 608.
[IPCC] Intergovernmental Panel on Climate Change. 2000. Good Practice Guidance and Uncertainty Management in National Greenhouse Gas Inventories
16
[IPCC] Intergovernmental Panel on Climate Change . 2006. IPCC Guidelines for National Greenhouse Gas Inventories 2006.
Jauhiainen J, Silvennoinen H, Hamalainen R, Kusin K, Limin S, Raison RJ, Vasander H. 2012. Nitrous oxide fluxes from tropical peat with different disturbance history and management. Biogeosciences. 9: 1337–1350.
Koh LP, Ghazoul J. 2010. Spatially explicit scenario analysis for reconciling agricultural expansion, forest protection, and carbon conservation in Indonesia. Proc Natl Acad Sci. 107:11140–11144.
Koh LP, Wilcove DS. 2008. Is oil palm agriculture really destroying tropical biodiversity? Conservation Letters. 1:60-64.
Koh LP, Miettinenb J, Liewb SC, Ghazoula J. 2011. Remotely sensed evidence of tropical peatlands conversion to oil palm. Proceedings of the National Academy of Sciences 108: 5127-5132.
Melling LR, Hatano K, Goh J. 2007. Nitrous oxide emissions from three ecosystems in tropical peatland of Sarawak, Malaysia. Soil Science and Plant Nutrition. 53: 792-805.
[MoA] Ministry of Agriculture. 2012. Statistik Perkerbunan Indonesia Tahun 2010-2012.
Murdiyarso D, Hergoualc’h K, Verchot LV. 2010. Opportunities for reducing greenhouse gas emissions in tropical peatlands. PNAS. 19655–19660.
Murdiyarso D, Dewi S, Lawrence D, Seymour F. 2011 Indonesia’s forest moratorium: a stepping stone to better forest governance? Working Paper 76. CIFOR, Bogor, Indonesia.
[NewCROP]. 1996. Elaeis guineensis Jacq. Center for New Crops and Plant Products. Purdue University. West Lafayette. [26 Jun. 2012] available at:http://www.hort.purdue.edu
Poku K. 2002. Small-scale palm oil processing in Africa. FAO Agricultural Services Bulletin 148. FAO. Rome.
Prasetyo BH, Suharta N. 2011. Genesis and properties of peat at Toba highland area of North Sumatra. Indonesian Journal of agriculture Science 12:1-8 Rahutomo SE, Sutarta S, and Darmosarkoro W. 2009. Utilization of Peatlands
for oil Palm Plantation. Proceedings of Bogor Symposium and Workshop on Tropical Peatlands Management. Bogor, 14-15 July 2009.
Riwandi. 2002. Rekomendasi Pemupukan Kelapa Sawit Berdasarkan Analisis Tanah dan Tanaman. Jurnal Akta Agrosia. 5:23-34.
[RSPO] Roundtable on Sustainable Palm Oil. 2012. RSPO Manual on best Management Practices for Existing Oil Palm Cultivation on Peat. [Internet] [ 23 January 2013] available online: http://www.rspo.org/
Sabiham S. 2010. Properties of Indonesian Peat in Relation to the Chemistry of Carbon Emission. Proc.of Int. Workshop on Evaluation and Sustainable Management of Soil Carbon Sequestration in Asian Countries. Bogor, Indonesia Sept. 28-29, 2010.
Shimizu M, Hatano R , Arita T, Kouda Y, Mori A , Matsuura S, Niimi M, Jin T, Desyatkin AR, Kawamura O, Hojito M, Miyata A. 2013. The effect of fertilizer and manure application on CH4 and N2O emissions from managed grasslands in Japan. Soil Science and Plant Nutrition. 59:69-86.
17 Smith KA, Ball T, Conen F, Dobbie KE, Massheder J, Rey A. 2003. Exchange of
greenhouse gasesbetween soil and atmosphere: interactions of soil physical factors and biological processes. European Journal of Soil Science. 5: 779–791 Sheil D, Casson A, Meijaard E, van Nordwijk M, Gaskell J, Sunderland-Groves
J, Wertz K, Kanninen M. 2009. The impacts and opportunities of oil palm in Southeast Asia: What do we know and what do we need to know? Occasional paper no. 51. CIFOR, Bogor, Indonesia.
Solorzano L. 1969. Determination of ammonia in natural water by the phenolhypochlorite method. Limnol Oceanogr. 14:799-801.
Verchot LV, Davidson EA, Cattaˆnio JH, Ackerman IL, Erickson HE, Keller M. 1999. Land-use change and biogeochemical controls of nitrogen oxide emissions from soils in eastern Amazonia. Global Biogeochem. 13:31– 46. Verchot LV, Hutabarat L, Hairiah K, van Noordwijk M. 2006. Nitrogen
availability and soil N2O emissions following conversion of forests to coffee in
southern Sumatra. Global Biochemical Cycles. 20.
18
BIOGRAPHY
Writer was born in West Sumatra on 1st October 1979, the youngest