INVESTIGATING THE RELATIONSHIP BETWEEN THE
PRICES OF WORLD CRUDE OIL AND DOMESTIC FOOD
COMMODITIES: EVIDENCE FROM INDONESIA
SENO PRATOMO
POSTGRADUATE SCHOOL
BOGOR AGRICULTURAL UNIVERSITY BOGOR
STATUTORY DECLARATION
I, Seno Pratomo, hereby declare that the master thesis entitled “Investigating the Relationship between the Prices of World Crude Oil and Domestic Food Commodities: Evidence from Indonesia” is my original work under the supervision of Advisory Committee and has not been submitted in any form and to another higher education institution. This thesis is submitted independently without having used any other source or means stated therein. Any source of information originated from published and unpublished work already stated in the part of references of this thesis. Herewith I passed the thesis copyright to Bogor Agricultural University.
Bogor, January 2016
Seno Pratomo
RINGKASAN
SENO PRATOMO. Investigasi Hubungan antara Harga Minyak Mentah Dunia dan Harga Komoditi Pangan Domestik: Bukti dari Indonesia. Dibimbing oleh NUNUNG NURYARTONO dan FLORIAN PLOECKL.
Dalam beberapa tahun terakhir, kenaikan harga komoditas pangan telah mendapatkan perhatian dan menyebabkan kekhawatiran diantara para pembuat kebijakan di seluruh dunia. Telah diyakini bahwa faktor utama yang mempengaruhi fluktuasi harga pangan adalah harga minyak mentah. Harga minyak mentah dapat mempengaruhi volatilitas harga pangan secara langsung melalui input produksi pertanian, seperti pupuk dan transportasi, dan secara tidak langsung mempengaruhi harga komoditas pangan melalui peningkatan produksi biofuel. Sebagai negara pengimpor minyak, Indonesia rentan terhadap guncangan harga pangan karena volatilitas harga minyak mentah dapat memicu fluktuasi harga pangan domestik. Oleh karena itu, penelitian ini bertujuan untuk menyelidiki hubungan antara harga minyak mentah dan harga komoditas pangan domestik tertentu di Indonesia selama periode 2002-2015 dengan menggunakan VECM dan Granger Causality test.
Hasil penelitian menunjukkan bahwa dalam jangka panjang, harga minyak mentah dapat mempengaruhi harga jagung domestik, harga beras dan gandum dunia serta secara tidak langsung mempengaruhi harga gandum domestik. Dalam jangka pendek, harga minyak mentah dapat mempengaruhi harga beras domestik. Namun demikian, penelitian ini tidak menemukan bukti adanya hubungan baik jangka pendek maupun jangka panjang antara harga minyak domestik dan harga komoditas pangan domestik. Penelitian ini menunjukkan bahwa subsidi BBM dapat meminimalisir transmisi volatilitas dari harga minyak mentah ke harga komoditas pangan. Selain itu, penelitian ini juga mengungkapkan bahwa harga jagung, kedelai dan gandum domestik rentan terhadap guncangan harga komoditas tersebut di pasar dunia karena Indonesia mengimpor komoditas tersebut dalam jumlah yang banyak dalam rangka memenuhi permintaan dalam negeri. Oleh karena itu, berdasarkan hasil penelitian tersebut, pemerintah Indonesia harus mempertimbangkan penerapan subsidi bahan bakar bagi produser pangan agar dapat mengurangi imbas volatilitas dari harga minyak mentah dunia. Selain itu, pemerintah juga harus memperbaiki kinerja produksi jagung dan kacang kedelai, serta mengurangi konsumsi gandum nasional agar dapat meminimalisir impor komoditas – komoditas tersebut.
SUMMARY
SENO PRATOMO. Investigating the Relationship between the Prices of World Crude Oil and Domestic Food Commodities: Evidence from Indonesia. Under Supervision of NUNUNG NURYARTONO and FLORIAN PLOECKL.
In recent years, rising food commodity prices have gained interest and caused concern amongst policy makers globally. It is believed that the main factor affecting food price fluctuations is crude oil prices. The prices of crude oil can directly influence food price volatilities through inputs of agricultural production, such as fertilisers and transportation, and indirectly affect food commodity prices through increasing biofuel production. As a net oil importer, Indonesia is vulnerable to food price shocks as volatilities of crude oil prices may trigger fluctuations in domestic food prices. Therefore, this study aims to investigate the existence of relationships between the price of crude oil and selected domestic food commodities in Indonesia over the period 2002 to 2015 using a VECM and Granger causality test.
The results indicate that in the long run the price of crude oil can affect domestic maize prices, the world prices of rice and wheat as well as indirectly affect the domestic price of wheat. In the short run, the results confirm that crude oil prices can affect domestic rice prices. Nevertheless, this study finds no evidence of the existence of either short term or long term relationships between domestic petroleum prices and domestic prices of all food commodities. These results suggest that fuel subsidies may reduce volatility transmission from energy prices onto food commodity prices.This study also reveals that domestic prices of maize, soybeans and wheat are vulnerable to shocks on the prices of these commodities in the world market as it largely imports these commodities to fulfill the national demand. Therefore, based on these findings, the government of Indonesia needs to consider the implementation of fuel subsidies for producers in order to reduce volatilities spillover from crude oil prices. The government also has to improve domestic production of maize and soybeans as well as reduce domestic consumption of wheat in order to minimize imports of these commodities.
Keywords: crude oil and food prices, agricultural inputs, biofuel demand, vector error correction model, granger causality
©
Copyright belongs to IPB, 2016
All Rights Reserved Law
Prohibited quoting part or all of this paper without including or mentioning the source. The quotation is only for educational purposes, research, scientific writing, preparation of reports, writing criticism, or review an issue; and citations are not detrimental to the interests of IPB.
INVESTIGATING THE RELATIONSHIP BETWEEN THE
PRICES OF WORLD CRUDE OIL AND DOMESTIC FOOD
COMMODITIES: EVIDENCE FROM INDONESIA
SENO PRATOMO
Master Thesis
As a requirement to obtain a degree
Master of Science in
Economics Program
POSTGRADUATE SCHOOL
BOGOR AGRICULTURAL UNIVERSITY
BOGOR
ACKNOWLEDGEMENT
Firstly, I would like to express my greatest gratitude to My God Almighty, Allah SWT, for giving me strength and ability to complete my dissertation as well as providing an opportunity for me to study abroad. I would also like to appreciate for the support and help from the following people during finishing this dissertation.
My sincere gratitude goes to my supervisors, Dr. Florian Ploeckl and Dr. Nunung Nuryartono, for the continuous support of my study and research, for their patience, motivation, and eminent knowledge. Without their guidance and supervision, I would not have accomplished this dissertation.
Besides my supervisors, I would like to thank lecturers and staff of the University of Adelaide, especially Athena Kerley, Niranjala Seimon, Augustine Bhaskarraj and Nicole Rizzo-Gray for their outstanding support and assistance during my study.
My sincere thanks goes to the Ministry of Trade of Republic of Indonesia and the Australian Awards Scholarship for providing sponsorship for my studies. I would also like to acknowledge the University of Adelaide and the Bogor Agricultural University for giving me opportunities to pursue academic achievement. Special appreciation goes to my institution, the Development Center of Metrological Human Resources, for allowing me to study my master degree.
I thank my fellow colleagues, especially Luthfi, Yoseph, Kahfi, Imam, Yudha, Indra, Novi, Helga, Mita, Rista and Venti for invigorating discussions, for motivating me, and for all the great times that we have had in the last two years. I also wish to thank my friends in my institution, particularly Idha and Wicaksono, for providing administrative support during my study.
Last but not least, I would like to thank my family: my parents, my wife, my lovely daughters, Aurellia and Hanna, as well as my brothers and sister for supporting me spiritually throughout my studies and my life in general.
Bogor, January 2016
TABLE OF CONTENTS
LIST OF FIGURES ... xiii
LIST OF TABLES ... xiii
1. INTRODUCTION ... 1
2. BACKGROUND ... 3
2.1Crude Oil Price Fluctuations ... 3
2.2The Development of Biofuel ... 4
2.3Domestic Production of Major Food Commodities in Indonesia ... 4
3. LITERATURE REVIEW ... 10
4. DATA AND METHODOLOGY ... 13
4.1Data... 13
4.2Methodology ... 14
5. RESULTS ... 18
5.1Augmented Dickey-Fuller Test ... 18
5.2Johansen Cointegration Test ... 18
5.3VECM Analysis ... 20
5.4Granger Causality Test ... 21
6. CONCLUSION ... 24
REFERENCES ... 26
LIST OF FIGURES
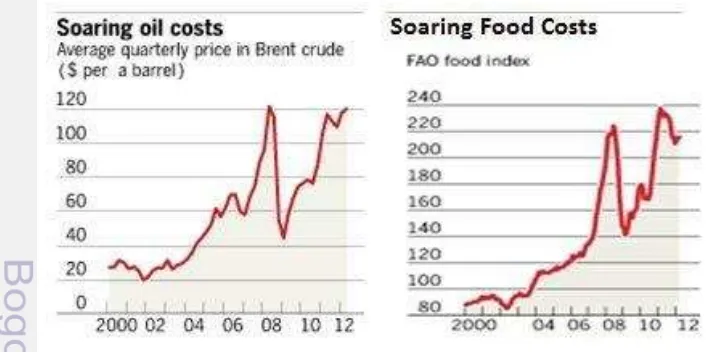
Figure 1.1 Prices of Oil and Food Commodities, 2000-2012 ... 1
Figure 2.1 Rice Production in Indonesia ... 5
Figure 2.2 Maize Production in Indonesia ... 6
Figure 2.3 Soybean Production in Indonesia... 7
Figure 2.4 Sugar Production in Indonesia ... 8
Figure 2.5 Crude Palm Oil Production in Indonesia ... 9
LIST OF TABLES
Table 4.1 Data of Commodities ... 14Table 5.1 Results of Augmented Dickey Fuller Test ... 18
Table 5.2 Results of Johansen Cointegration Test... 19
Table 5.3 Results of VECM ... 20
1
1
INTRODUCTION
Food security has currently received renewed interest amongst researchers and causes great concern for governments globally. According to the World Food Summit of 1996, food security is defined as a condition where people, including the poor, have access to adequate, safe and nutritive food in order to preserve a healthy and dynamic life (WHO 2015). There has been a surge in food commodity prices globally during the past few years. Food price inflation reached a peak in 2007/2008, leading to social turmoil in several developing countries (Berazneva and Lee 2013; Bush 2010; Paarlberg 2010; Schneider 2008) because high and volatile food prices put national food security at risk, particularly for countries where people spend a large proportion of their income on nutrition. During these upheavals, 44 million people were forced into poverty, shifting the poverty line upwards (UN 2011). Thereby, this phenomenon has motivated researchers to investigate factors affecting fluctuations in food prices.
Many researchers believe that food commodity prices are primarily driven by price of crude oil because the modern food system is heavily dependent on fossil fuels at all stages of food production from planting, irrigation pumping and harvesting to processing, packaging and distributing commodities. Dancy (2012) found that since 2000 there has been a significantly high correlation between fossil fuel prices and the FAO food index. Such a correlation is also suggested by a World Bank report indicating that during periods of high crude oil prices, the link is augmented and has a dominant effect on the food market (Mueller, Anderson and Wallington 2011). In addition, Bakhat and Würzburg (2013) state that during such periods, there has been an increase in biofuel production as it is used as an alternative source of energy for fossil fuel. However, these authors point out that the rise in biofuel production has been followed by an increase in food prices and suggest a nexus between oil, biofuel and food market. The co-movement between these commodities, as shown in Figure 1 below, indicates that there may be a correlation between food and crude oil prices.
2
Indonesia, one of the emerging countries in Southeast Asia, is a net oil importer and known as a country which provides massive fuel subsidies to its citizen. These subsidies cause domestic petroleum prices to be less volatile compared to the rest of the world, allowing its citizen to purchase petroleum at lower prices. Moreover, due to rising world crude oil prices, Indonesia has encouraged biofuel developments which are mainly produced from food crops categorised as major staple foods for Indonesian people. Therefore, this raises an important question as to whether there is a volatility spillover from international crude oil prices to domestic food commodity prices in Indonesia.
The objective of this study is to examine whether prices of selected major food commodities in Indonesia, namely rice, maize, wheat, soybeans, sugar and cooking oil, are driven by crude oil prices through both direct and indirect channels. These food commodities are used for observations because they are products commonly purchased and consumed by Indonesian people, including the poor (Pangaribowo and Tsegai 2011). The results of this study are useful for policy makers because an understanding of the mechanisms of volatility transmission between prices of two commodities can enable governments to develop appropriate policies for food price stabilisation.
3
2
BACKGROUND
Over the past few years, an increase in crude oil prices has been followed by a rise in price of other commodities, particularly agricultural and food commodities. This has raised suspicion that the prices of these commodities have become more proximately connected in recent times. According to Gardebroek and Hernandez (2013), rising energy prices can influence agricultural commodity prices through two channels: a direct and an indirect channel. Firstly, increased crude oil prices can directly affect energy intensive farming because this traditional farming method intensively uses inputs characterised as oil-based commodities, such as nitrogen fertilisers, pesticides and electricity, thus, a surge in oil prices increases production costs. Moreover, increased crude oil prices raise gasoline prices leading to an increase in transportation costs for farmers.
Secondly, as energy prices increase, fossil fuel prices increase, thereby encouraging the use of alternative energy sources, such as biofuels, shifting ethanol demand upwards. Such an upward shift indirectly induces an increase in food prices because biofuels are primarily produced from food crops, such as maize, soybeans, wheat and sugar. As a result, the production of biofuel competes with food production by using scarce natural resources. In fact, high ethanol demand motivates large scale biofuel production and hence more land being allocated to biofuel crops, meaning less land is allocated to planting food crops. A decline in food supply then causes an increase in food commodity prices (Locke, Wiggins, Henley and Keats 2013). Therefore, the linkage between oil price and food commodities has become stronger, particularly after the biofuel boom, suggesting that shocks in fossil fuel prices can be expected to disrupt the stability of food prices.
Since food commodity prices may be driven by oil prices, it is important to gain a better understanding of oil price fluctuations in the world market and impact on biofuel development, particularly in Indonesia. Information about domestic production of major food commodities can be used for providing insight into the availability of food commodities for meal consumption considering that some food crops are also used for feedstocks. Hence, such knowledge may help support analysis of relationships between world oil price and Indonesian domestic food commodity prices.
2.1Crude Oil Price Fluctuations
According to Tillier (2009), crude oil prices are affected by shifts in oil supply and demand. This implies that when oil supply is lower than oil demand, prices increase. Inversely, when supply of oil surpasses demand, oil prices decline.
4
Apart from OPEC influences, several major global events may also affect international prices of crude oil. Tillier (2009) points out three primary external factors causing oil price fluctuations, namely political instabilities, economic fluctuations and weather patterns. Middle East conflicts, such as the Iraq and Afghanistan wars in 2003, 2006 and 2008, caused a substantial increase in oil price because oil suppliers could not assure buyers that oil would be properly delivered, resulting in reduction of demand from American consumers of oil, thereby driving oil price down. Secondly, demand for oil will decrease during an economic recession, leading to a decline in oil prices. Thirdly, a devastating weather event, such as Hurricane Katrina in 2005, significantly lowers supply of oil inducing a surge in oil prices, in the case of Hurricane Katrina to more than US$70 per barrel (Tillier 2009). Therefore, fossil fuel prices have high volatilities, posing threats to many net oil importer countries and hence encouraging the development of alternative energy sources, such as biofuels.
2.2The Development of Biofuel
The global biofuel industry has grown rapidly over the past decade. This industry started to develop in 2000 as a reaction to high crude oil prices. The unprecedented rise in oil price during the mid-2000s motivated countries globally to utilise biofuel as a substitution for fossil fuel. Similarly, Indonesia has started to develop biofuels as alternative energy sources since 2005, marked by the enactment of the Presidential Regulation no. 5/2006, as a response to increasing fossil fuel imports widening the trade account deficit. This has been caused by several factors, such as rising crude oil prices, declining crude oil reserves, low oil production and increasing demand for energy and electricity (Komarudin, Obidzinski, and Andrianto 2012). Consequently, fossil fuel consumption had surpassed production leading to energy insecurity, thus motivating the development of alternative energy sources.
The production of biofuel can be based on several food crops, for example in the US, major biofuel feedstocks are corn, soybean oil and canola oil, while in the EU biofuel is made from wheat, rapeseed oil, sunflower oil and soybean oil (Ajanovic 2011). Wirawan (2006) states that in Indonesia biodiesel is mainly produced from palm oil, while bioethanol is made from maize, sweet potatoes, cassava, sugar cane and sorghum. As a consequence, the production of biofuel has to contend with the production of food commodities, increasing the risks of national food insecurity.
2.3Domestic Production of Major Food Commodities in Indonesia
5
capacity, Indonesia has to depend on imported food crops such as maize, soybean, sugar and wheat. This, hence, may cause Indonesia to be more vulnerable to international food price volatilities.
2.3.1 Rice
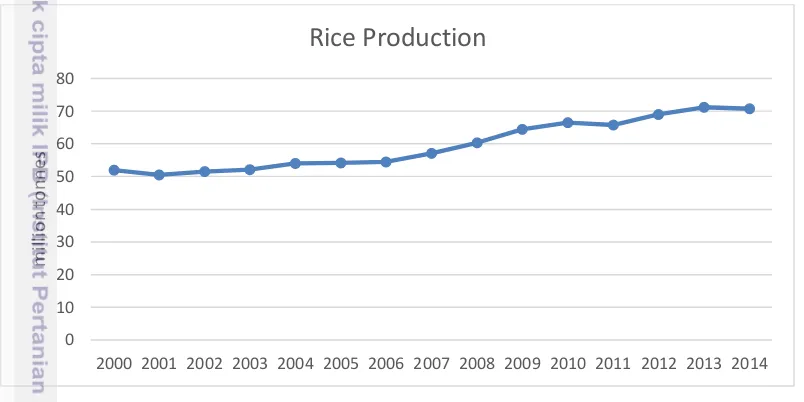
Rice is a major staple food for most Indonesian people. As shown in Figure 2 below, there has been an increase in rice production during the past 14 years from 51 million tonnes in 2000 to 70.8 million tonnes in 2014. On the other hand, according to a survey conducted by related ministries and institutions, rice consumption by households and restaurants accounts for 114 kg per capita or 28 million tonnes per year (Deny 2015). The government expects that Indonesia is able to achieve self-sufficiency in rice and therefore after his election as the Indonesian President in 2014, Joko Widodo has banned the import of rice.
Figure 2.1 Rice Production in Indonesia Source: BPS-Statistics Indonesia
2.3.2 Maize
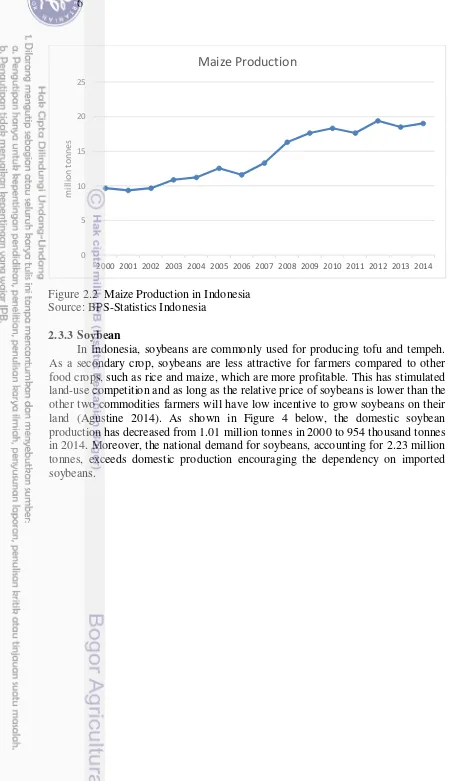
The production of other staple commodities, such as maize, soybeans and sugar, has grown at varying levels. As shown in Figure 3 below, the production of maize has risen over the past 14 years from 9.6 million tonnes in 2000 to 19 million tonnes in 2014. However, based on data from the Indonesian Ministry of Agriculture, domestic production cannot fulfill domestic demand at 19.97 million tonnes (Ningsih 2015). This high demand leads to a deficit in maize.
0
2000 2001 2002 2003 2004 2005 2006 2007 2008 2009 2010 2011 2012 2013 2014
6
Figure 2.2 Maize Production in Indonesia Source: BPS-Statistics Indonesia
2.3.3 Soybean
In Indonesia, soybeans are commonly used for producing tofu and tempeh. As a secondary crop, soybeans are less attractive for farmers compared to other food crops, such as rice and maize, which are more profitable. This has stimulated land-use competition and as long as the relative price of soybeans is lower than the other two commodities farmers will have low incentive to grow soybeans on their land (Agustine 2014). As shown in Figure 4 below, the domestic soybean production has decreased from 1.01 million tonnes in 2000 to 954 thousand tonnes in 2014. Moreover, the national demand for soybeans, accounting for 2.23 million tonnes, exceeds domestic production encouraging the dependency on imported soybeans.
0 5 10 15 20 25
2000 2001 2002 2003 2004 2005 2006 2007 2008 2009 2010 2011 2012 2013 2014
m
il
li
o
n
to
nnes
7
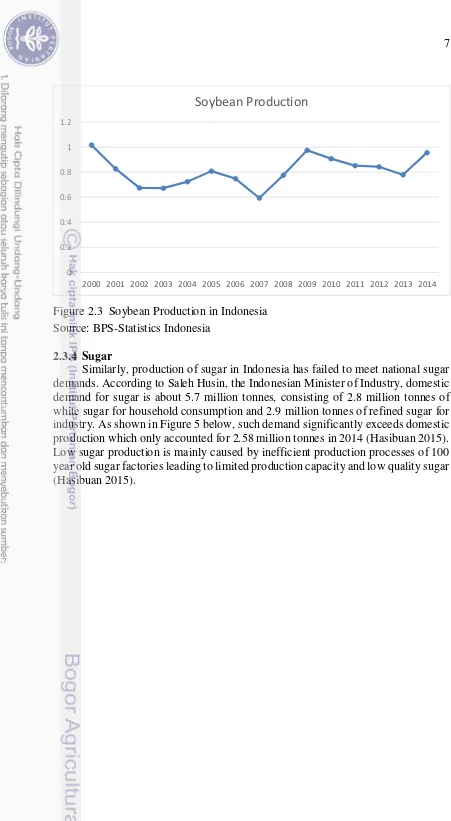
Figure 2.3 Soybean Production in Indonesia Source: BPS-Statistics Indonesia
2.3.4 Sugar
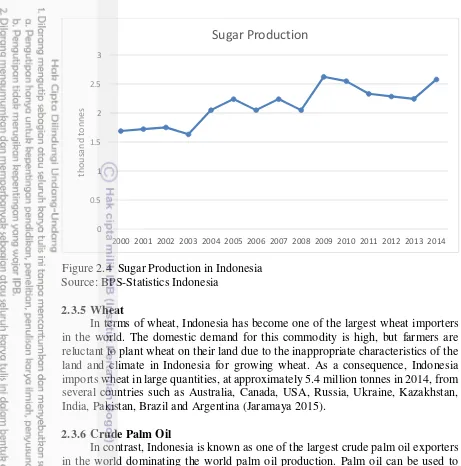
Similarly, production of sugar in Indonesia has failed to meet national sugar demands. According to Saleh Husin, the Indonesian Minister of Industry, domestic demand for sugar is about 5.7 million tonnes, consisting of 2.8 million tonnes of white sugar for household consumption and 2.9 million tonnes of refined sugar for industry. As shown in Figure 5 below, such demand significantly exceeds domestic production which only accounted for 2.58 million tonnes in 2014 (Hasibuan 2015). Low sugar production is mainly caused by inefficient production processes of 100 year old sugar factories leading to limited production capacity and low quality sugar (Hasibuan 2015).
0 0.2 0.4 0.6 0.8 1 1.2
2000 2001 2002 2003 2004 2005 2006 2007 2008 2009 2010 2011 2012 2013 2014
8
Figure 2.4 Sugar Production in Indonesia Source: BPS-Statistics Indonesia
2.3.5 Wheat
In terms of wheat, Indonesia has become one of the largest wheat importers in the world. The domestic demand for this commodity is high, but farmers are reluctant to plant wheat on their land due to the inappropriate characteristics of the land and climate in Indonesia for growing wheat. As a consequence, Indonesia imports wheat in large quantities, at approximately 5.4 million tonnes in 2014, from several countries such as Australia, Canada, USA, Russia, Ukraine, Kazakhstan, India, Pakistan, Brazil and Argentina (Jaramaya 2015).
2.3.6 Crude Palm Oil
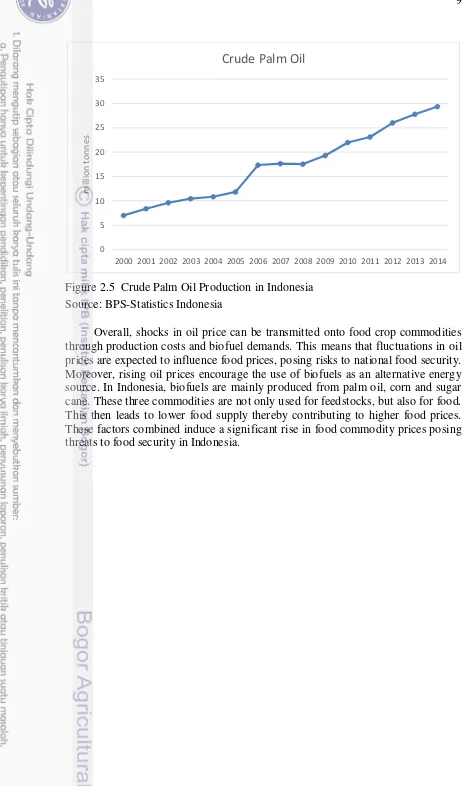
In contrast, Indonesia is known as one of the largest crude palm oil exporters in the world dominating the world palm oil production. Palm oil can be used to produce biodiesel, RBD palm oil (refined, bleached and deodorized crude palm oil) including cooking oil and margarine, as well as oleochemicals. In 2014, domestic demand for crude palm oil is about 8.8 million tonnes, consisting of 2.5 million tonnes for biodiesel industries, 4.2 million tonnes for RBD palm oil industries and 0.7 million tonnes for oleochemical industries (Fahriyadi and Laoli 2015). As shown in Figure 6 below, domestic production of crude palm oil largely surpasses domestic consumption. This low domestic demand enables Indonesia to export cooking oil products to several countries including China and India.
0
2000 2001 2002 2003 2004 2005 2006 2007 2008 2009 2010 2011 2012 2013 2014
9
Figure 2.5 Crude Palm Oil Production in Indonesia Source: BPS-Statistics Indonesia
Overall, shocks in oil price can be transmitted onto food crop commodities through production costs and biofuel demands. This means that fluctuations in oil prices are expected to influence food prices, posing risks to national food security. Moreover, rising oil prices encourage the use of biofuels as an alternative energy source. In Indonesia, biofuels are mainly produced from palm oil, corn and sugar cane. These three commodities are not only used for feedstocks, but also for food. This then leads to lower food supply thereby contributing to higher food prices. These factors combined induce a significant rise in food commodity prices posing threats to food security in Indonesia.
0 5 10 15 20 25 30 35
2000 2001 2002 2003 2004 2005 2006 2007 2008 2009 2010 2011 2012 2013 2014
m
il
li
o
n
to
nnes
10
3
LITERATURE REVIEW
An increasing number of studies have investigated the relationship between crude oil and food prices. These studies show a divergence in findings indicating that the effect of crude oil price volatilities on food commodity prices is not universal. This has motivated researchers worldwide to further investigate such correlations. The majority of previous studies have highlighted the existence of volatility spillover from crude oil prices to food commodity prices, an effect that is becoming stronger as biofuel production increases. Such research concurs with crude oil price volatilities being transmitted onto food commodities prices through two essential elements, namely production inputs (transportation and electricity costs, fertiliser and pesticide prices) and biofuel production (agricultural commodities as raw materials).
Research investigating volatility spillovers from crude oil onto the food market through production inputs has focused on agricultural commodities used for staple food and found a strong relationship between them. Research by Baffes (2007) was based on 35 non-energy commodities traded globally, such as food (rice, maize, soybeans, wheat, and sugar), beverages (cocoa, coffee, and tea), raw materials (cotton, rubber, and timber), fertilisers, and metals (silver, aluminum, copper, nickel, zinc). This author used annual price data from 1960 to 2005 and analysed data using an Ordinary Least Squares (OLS) regression method. Results indicate that linkages between crude oil prices and food commodities are stronger compared to other commodities. Furthermore, research results of Balcombe (2011) also suggest a positive correlation. This author’s findings, acquired using the time varying and panel approach, were based on smaller samples covering 19 agricultural commodities, such as rice, soybeans, maize, wheat, meat, cheese, cocoa, and sugar from 1957 to 2009. A more recent study by Obadi and Korček (2014) investigated the causality, long-run and short-run linkages between price of crude oil and food products, such as palm oil, wheat, corn, sugar, rice and barley. Data used in this study were monthly commodity prices over the period January 1975 to September 2013 and by adopting a Granger causality and a VECM model, a run relationship between oil and food prices was identified. In addition, in the long-run, causality is transmitted from oil prices to all food commodity prices, except for barley which has a two-way causality. Similarly, in the short-run, the direction of causality runs from oil prices to each of the food commodities, except for sugar. These findings, therefore, suggest that the price of agricultural food commodities used as sources of food react significantly to oil price fluctuations as oil is a primary input in energy intensive farming (Obadi and Korček 2014).
11
connected by an equilibrium parity, suggesting a strong volatility linkage between them. Research by Ji and Fan (2012) uses daily log returns data covering various crops (soybean, wheat, corn, and sugar) and metals (gold, silver, aluminum) between 7 July 2006 and 30 June 2010. By adopting an EGARCH model, these authors suggest that the nexus between crude oil prices and agricultural and metal commodity prices has become stronger since the 2008 crisis. The work of Bakhat and Würzburg (2013), derived from an ECM model, is based on three categories of samples which are food commodities used to produce biofuel, such as soybean oil, sunflower oil, palm oil and sugar, other food commodities which cannot be converted into biofuels, such as rice, wheat, and beef and agricultural commodities which are not edible such as rubber, coffee and wool. By analysing monthly data for the period January 2000 to April 2011, these authors found that increasing the use of biofuels induces stronger linkages between crude oil and food commodities, especially for commodities used as raw materials for biofuel production. Similarly, recent research by Tadesse, Algieri, Kalkuhl and Braun (2014) which used monthly and annual data of oil and food prices, such as wheat, corn and soybeans, from 1986 to 2009, indicates that in recent years there is an emerging link between food, energy and financial markets. Thus, such results indicate an indirect transmission between oil price volatility and farming commodities through increased demand for biofuel.
Other researchers state that results of investigations into volatility transmission from oil onto food commodity prices are not statistically significant at all times. A study by Du, Yu and Hayes (2011) shows that linkages between oil, maize and wheat only exist after 2006. They analysed the weekly data of these commodities by following a stochastic volatility model and a Bayesian econometric method for estimating the parameters of the model. Similar results were obtained by Nazlioglu, Erdem and Soytas (2013) who adopted the Hafner and Herwartz test approach and divided the data into two time periods of observation: before the food crisis (01 January 1986-31 December 2005) and after the food crisis (01 January 2006-21 March 2011). The data used in the study were daily price data of agricultural commodities, such as wheat, maize, soybeans and sugar. The results indicated that during the pre-crisis period there was no volatility spillover between crude oil and agricultural commodity prices. In contrast, there was significant volatility transmission during the post-crisis period. Hence, these findings show that the existence of volatility spillovers may depend on a particular time period marked by the biofuel boom phenomenon after the crisis (Nazlioglu, Erdem and Soytas 2013).
12
13
4
DATA AND METHODOLOGY
This section presents data and explores the econometric methods used to investigate the relationship between oil prices in the world market and food commodity prices in the Indonesian market from 2002 to 2015. To measure such a linkage this study adopts the VECM model and the Granger Causality test.
4.1Data
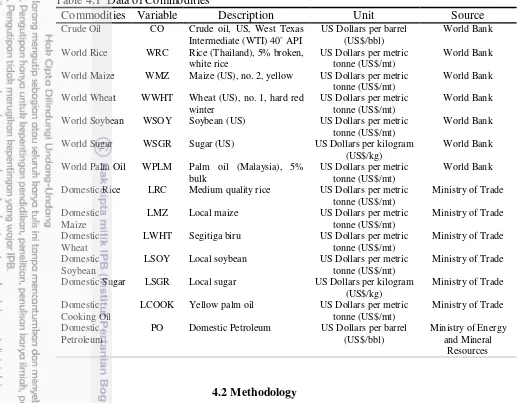
To investigate volatility spillovers between energy and food markets, this study uses a series of individual prices for commodities rather than price indices in order to circumvent aggregation bias and the weighting rule when making them into indices (Arezki, Hadri, Loungani and Rao 2013). The data set includes a monthly average price series for world crude oil, world food commodities and Indonesian food prices from January 2002 to August 2015, consisting of 164 observations.
14
Table 4.1 Data of Commodities
Commodities Variable Description Unit Source
Crude Oil CO Crude oil, US, West Texas
Intermediate (WTI) 40` API
US Dollars per barrel (US$/bbl)
World Bank
World Rice WRC Rice (Thailand), 5% broken,
white rice
World Soybean WSOY Soybean (US) US Dollars per metric
tonne (US$/mt)
World Bank
World Sugar WSGR Sugar (US) US Dollars per kilogram
(US$/kg)
Domestic Rice LRC Medium quality rice US Dollars per metric
tonne (US$/mt)
Ministry of Trade
Domestic Maize
LMZ Local maize US Dollars per metric
tonne (US$/mt)
Ministry of Trade
Domestic Wheat
LWHT Segitiga biru US Dollars per metric
tonne (US$/mt)
Ministry of Trade
Domestic Soybean
LSOY Local soybean US Dollars per metric
tonne (US$/mt)
Ministry of Trade
Domestic Sugar LSGR Local sugar US Dollars per kilogram
(US$/kg)
Ministry of Trade
Domestic Cooking Oil
LCOOK Yellow palm oil US Dollars per metric
tonne (US$/mt)
Ministry of Trade
Domestic Petroleum
PO Domestic Petroleum US Dollars per barrel
(US$/bbl)
Ministry of Energy and Mineral
Resources
4.2Methodology
This study uses four basic models to analyse linkages between price of crude oil and the price of the following domestic food commodities: rice, maize, wheat, soybeans, sugar and cooking oil. The first model is used to test whether fluctuations in crude oil prices can directly affect domestic food prices, as represented by the equation:
� �= + � �+ �
where � � is the price of the domestic food commodity � at time � ; � � is the price of crude oil at time � ; and � is the error terms.
15
The third model is used to investigate whether volatilities of crude oil prices are transmitted through to food commodities in the world market, expressed as:
�= + � �+ � Correction Model and Granger Causality test.
4.2.1 Unit Root Test
Economic time series data is generally characterised by stochastic properties and strong trend behaviour. According to Hatanaka (1996), these properties can violate stationarity conditions which require a constant mean, constant variance and constant covariance over time. Granger and Newbold (1974) state that if non-stationary time series data is used in a regression model it can generate a spurious regression result leading to false existence of a significant economic relationship from unrelated variables. Therefore, before doing a time series analysis it is important to test for the stationarity properties of the time series data.
The Unit Root test can be used to determine the stationarity characteristics of time series data by detecting the presence of a unit root. This study adopts a commonly used non-stationarity test known as the Augmented Dickey-Fuller (ADF) test. The null hypothesis of this test is that the series has a unit root, meaning that it is not stationary (Obadi and Korček 2014). This hypothesis can be rejected if the value of the t-statistic is lower than the ADF critical values, which are substantially higher (in absolute terms) than those of standard regression.
4.2.2 Cointegration Test
It is believed that two or more price series are cointegrated if these prices move simultaneously in the long run. Engle and Granger (1987) point out that if a linear combination of two or more variables, which are integrated of the same order
� � , generate a stationary series then the series are cointegrated. This means that a long run equilibrium relationship between economic variables may exist even though they deviate in the short run.
This study uses the Johansen Cointegration test to analyse the existence of a long run relationship between variables. Before carrying out the test it is important to determine the order of integration of variables and ascertain that these variables share the same order of integration. The null hypothesis of this test is that there is no cointegration relationship between variables.
4.2.3 Vector Error Correction Model (VECM)
16
VECM is a restricted form of traditional VAR. Such a restriction has to be applied due to the existence of cointegration between the non-stationer variables in the level and it then incorporates information from the cointegration residuals into the model. The specification of VECM restricts the long-term relationships of endogenous variables so that they can converge to their cointegration relationships, but still allows the dynamics of the short run (Chintia 2013). Hence, by using VECM it is possible to analyse the long run and short run causality between oil and each food price. The following equations are the regression form of VECM:
Δ � = ∑ Δ �− zero, then this indicates that the equations are a traditional VAR model in the first difference. Inversely, if � and � are significantly different from zero, then Δ � is affected by the deviation from the long run equilibrium, from the previous period, meaning that � has an error correction effect. This indicates that VECM is the appropriate estimation method because it is a VAR model in the first-differenced form which includes cointegration residual vectors (Chen and Patel 1998).
4.2.4 Granger Causality Test
The Granger Causality test is used to analyse whether two economic variables have at least one way of causality. This method estimates how much current values of can be explained by past values of . According to Chen and Patel (1998), is granger caused by if can help to predict and the coefficients of the lagged s are statistically significant. There are two possibilities of causality, one-way and two-way causation.
This study adopts the traditional pairwise Granger Causality test to examine the causality relationship between crude oil prices and food commodity prices. This method requires the test to be done at the levels of the data (C). The following equation is the pairwise Granger Causality as a bivariate autoregressive model:
� = � + ∑ �−
17
Obadi and Korček (2014) state that � Granger causes � if the coefficient values of are significantly different from zero, rejecting the null hypothesis of
18
5
RESULTS
In order to analyse the relationships between world crude oil prices and food commodity prices in Indonesia during the period January 2002 to August 2015 this study has conducted a series of tests according to the methodology discussed in the previous section. Results of the empirical analysis are reviewed in this section.
5.1Augmented Dickey-Fuller Unit Root Test
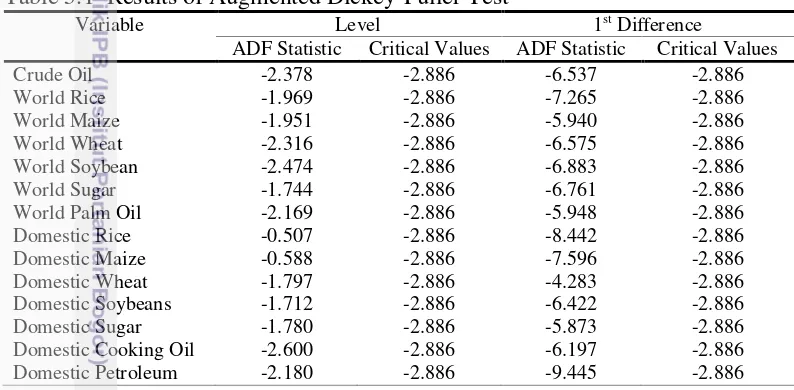
The augmented Dickey-Fuller (ADF) root test is a standard pre-test to a time series analysis aiming to check the presence of unit roots in the series. The test is carried out to each logarithm series starting from level to the first difference at the 5% level of significance. The estimated results of the ADF test are presented in Table 5.1 below.
Table 5.1 Results of Augmented Dickey-Fuller Test
Variable Level 1st Difference
ADF Statistic Critical Values ADF Statistic Critical Values
Crude Oil -2.378 -2.886 -6.537 -2.886
Domestic Petroleum -2.180 -2.886 -9.445 -2.886
Table 5.1 shows that the null hypothesis of the existence of unit roots cannot be rejected for each variable at level, meaning that the series are non-stationary at the level at the 5% level of significance. This implies that these variables at level cannot be used for time series analysis because non-stationary data may produce a spurious regression. Therefore, the unit root test is carried out in the first differenced logarithm.
As indicated in Table 5.1, results show that the null hypothesis can be rejected for all variables, implying that these variables are stationary and integrated of the same order, I(1). Therefore, the test of cointegration can be carried out in order to detect the existence of long-run relationships between the variables.
5.2Johansen Cointegration Test
19
condition for cointegration where all variables are stationary at the same level, namely order 1, I(1). This study tests bivariate relationships between the prices of crude oil and each food commodity, the domestic prices of gasoline and domestic food commodities, and the prices of food commodities in the world market and the domestic food commodity prices at the 5% significance level, in order to identify existence of long-run relationships between them.
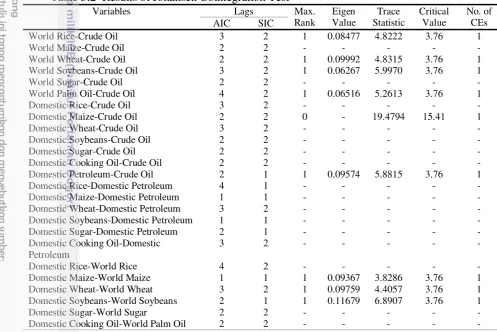
As presented in Table 5.2, the Johansen cointegration test reveals that long term relationships between crude oil and domestic food commodity prices were only identified in maize, implying there are no cointegration relationships between crude oil prices and following commodities: rice, wheat, soybeans, sugar and cooking oil. Likewise, this test found no evidence for existence of long term associations between domestic petroleum prices and domestic food commodity prices despite the existence of long term relationships between the prices of domestic petroleum and crude oil.
Table 5.2 Results of Johansen Cointegration Test
Variables Lags Max.
In terms of linkages between food commodity prices in the world market and crude oil prices, this test finds long-run relationships for all commodities, except for maize and sugar. Similar relationships are also detected in the links between food commodities in the domestic and the world markets, except for rice, sugar and cooking oil.
20
On the other hand, this study adopts the Granger Causality test in order to investigate causality relationships between variables with no cointegration associations (Giles 2011; Gogoi 2014). Moreover, the lag lengths generated by the Schwarz Information Criterion (SIC) are employed in this study because it suggests the most parsimonious model compared to Akaike Information Criterion (AIC).
5.3VECM Analysis
A VECM model can be used to identify long-run and short-run relationships between the prices of oil and food commodities. This method defines a framework where the dynamics of the short-run relations of each price series are bound to the long-run equilibrium relations.
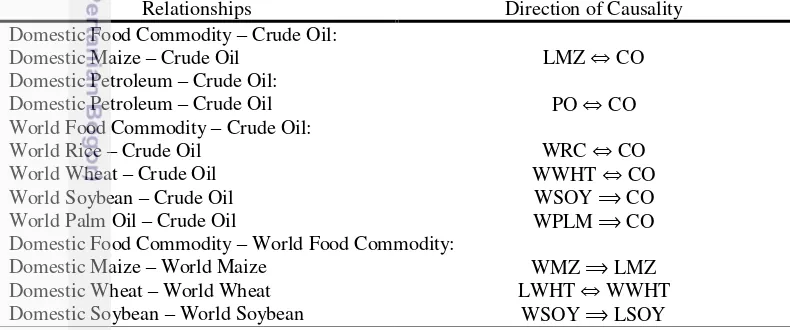
As shown in Table 5.3 below, the VECM results confirm a bidirectional long term association between domestic price of maize and crude oil prices, implying that the price of maize in Indonesia is being caused by crude oil prices and vice versa. Similarly, results show that there is a bidirectional long term relationship between domestic petroleum prices and crude oil prices. Therefore, these results indicate that in the long run crude oil prices can directly affect the domestic price of maize through changes in the cost of production due to the intensive use of fossil fuel, whereas the reverse relationships suggest that the domestic price of maize and petroleum seem to be the leading indicator of crude oil price fluctuations.
Table 5.3 Results of VECM
Relationships Direction of Causality
Domestic Food Commodity – Crude Oil:
Domestic Maize – Crude Oil LMZ ⇔ CO
Domestic Petroleum – Crude Oil:
Domestic Petroleum – Crude Oil PO ⇔ CO
Domestic Food Commodity – World Food Commodity:
Domestic Maize – World Maize WMZ ⟹ LMZ
Domestic Wheat – World Wheat LWHT ⇔ WWHT
Domestic Soybean – World Soybean WSOY ⟹ LSOY
21
demand for biofuel can affect the price of crude oil. Moreover, the development of biofuel also affects non-feedstock crops, such as rice, because farmers prefer to grow feedstock crops instead of food crops, indicating that the price of rice may become a leading indicator of changes in crude oil prices (Tenenbaum 2008). Therefore, the world prices of both wheat and rice can indirectly affect the price of crude oil.
In terms of the relationships between domestic food commodity prices and their corresponding food commodity prices in the world market, the results confirm unidirectional long-run associations running from world soybean prices to domestic soybean prices and from world maize prices to domestic maize prices. These indicate that the changes in world soybean prices can affect the domestic soybean prices, but prices of domestic soybeans cannot influence soybean prices in the global market. Likewise, the domestic maize prices can be affected by fluctuations in the world prices of maize.
Bidirectional long-run relationships can be found in the linkages between the world price of wheat and the domestic price of wheat in Indonesia. These associations suggest that the world price of wheat can influence the domestic price of wheat, and in reverse, domestic wheat prices can affect world wheat prices. The existence of bidirectional relationships between these variables may be caused by substantially high domestic demand for wheat in Indonesia, making it the third largest wheat importing country in the world.
Overall, the VECM results reveal that in the long run crude oil prices can directly affect the domestic price of maize and the world prices of rice and wheat. Crude oil prices may also indirectly affect domestic prices of wheat through the world price of wheat since Indonesia heavily imports this commodity. Similarly, there is a possibility that domestic prices of maize and soybeans may be affected by the prices of their corresponding food commodities in the global market as these commodities are imported in large quantities to fulfill the national demand.
5.4Granger Causality Test
The aim of the Granger Causality test is to investigate the existence of causation relationships between two economic variables in the short run. This study adopts the VAR Pairwise Granger Causality test at the 5% level of significance and uses SIC to choose the optimal length of lag for the test. The test is conducted for all bivariate analyses having no cointegration relationships.
22
being the largest crude palm oil exporter in the world. Rising cooking oil prices encourages farmers to produce crude palm oil intended for producing cooking oil instead of biofuel. The reduction in the supply of feedstock could trigger an increase in biofuel prices and hence affect the demand for biofuel as consumers may substitute biofuel for fossil fuel. This substitution then could affect crude oil prices. Table 5.4 Results of Granger Causality test
Relationships Direction of Causality
Domestic Food Commodity – Crude Oil:
Domestic Rice – Crude Oil LRC ⇔ CO
Domestic Wheat – Crude Oil LWHT ⟹ CO
Domestic Soybean – Crude Oil -
Domestic Sugar – Crude Oil -
Domestic Cooking Oil – Crude Oil LCOOK ⟹ CO
Domestic Food Commodity – Domestic Petroleum:
Domestic Rice – Domestic Petroleum -
Domestic Maize – Domestic Petroleum -
Domestic Wheat – Domestic Petroleum -
Domestic Soybean – Domestic Petroleum -
Domestic Sugar – Domestic Petroleum -
Domestic Cooking Oil – Domestic
Domestic Food Commodity – World Food Commodity:
Domestic Rice – World Rice -
Domestic Sugar – World Sugar -
Domestic Cooking Oil – World Palm Oil WPLM ⟹ LCOOK
In contrast, the Granger causality test does not identify any short-run causalities in the linkages between domestic soybean prices and crude oil prices, and between the domestic price of sugar and the price of crude oil. Similarly, this test reveals that there are no causality relationships between domestic prices of food commodities and domestic price of petroleum. A plausible reason for this finding is because of massive fuel subsidies provided by the government of Indonesia, allowing more stable fuel prices. Hence, this could break the relationships between the prices of domestic food commodities and the domestic price of petroleum and explain the absence of cointegration associations between them.
23
In the context of domestic food commodities and world food commodities, this test shows a one-way short-run association running from the world price of palm oil to the domestic price of cooking oil. This result is in line with the findings of Harahap (2012), revealing that Indonesia still cannot become the reference country for world price of crude palm oil. This author further mentions that the international price of crude palm oil refers to the Rotterdam market and the future market in Kuala Lumpur. Nevertheless, the test does not find any short-run causations between domestic price of rice and world price of rice as well as between the domestic price of sugar and the world price of sugar. These results may occur as, in recent years, Indonesia has ceased rice imports and uses domestic production of sugar to fulfill domestic demand, thereby unlinking domestic prices and world prices.
24
6
CONCLUSION
Increasing food commodity prices have resulted in concerns about food insecurity, particularly in developing countries where people expend a relatively large proportion of their income on nourishment. Since modern food production processes largely depend on fossil fuel, it is believed that food prices may be driven by crude oil prices. Likewise, rising biofuel demand induced by high oil prices has triggered the increase in food commodity prices due to food crops, such as maize and soybeans, being used not only for food production, but also for feedstocks. These factors provide motivation to investigate whether there is a volatility spillover between crude oil prices and the prices of food commodities in Indonesia, given that the country is well known as both a net oil and net food importer.
By using monthly data series from January 2002 to August 2015, this study conducts a series of tests starting from unit root and cointegration test to VECM and Granger Causality test in order to identify the existence of short-run and long-run relationships between crude oil prices and domestic food prices. The results of VECM confirm that in the long run, crude oil prices appear to have direct effects on the domestic prices of maize as well as on the world prices of rice and wheat. In addition, the results show that crude oil prices can indirectly affect the domestic prices of wheat through the prices of wheat in the international market given that Indonesia has largely imported these commodities. Likewise, the results indicate that the prices of maize and soybean in the domestic market seem to be affected by the world prices of maize and soybean since Indonesia still depends on imported maize and soybean to satisfy the domestic consumption. The Granger Causality test reveals that in the short run the price of crude oil appears to have direct effects on the domestic price of rice. Furthermore, the results also show that the domestic price of cooking oil may be affected by the world price of palm oil due to domestic prices of crude palm oil follow the prices of Rotterdam market and the future market in Kuala Lumpur. In contrast, the results confirm that there are no short-run or long-run relationships between the domestic price of petroleum and the domestic price of food commodities. Hence, this suggests that fuel subsidies could have broken the linkages between them.
25
26
REFERENCES
Abdelradi, F & Serra, T 2015, ‘Food – energy nexus in Europe: Price volatility approach’, Energy Economics, vol. 48, pp. 157-167.
Agustine, I 2014, ‘Produksi kedelai 2015 diprediksi masih defisit 1 juta ton’,
Industri, viewed 06 October 2015, <http://industri.bisnis.com/read/ 20141117/99/273617/produksi-kedelai-2015-diprediksi-masih-defisit-1-juta -ton>.
Ajanovic, A 2011, ‘Biofuels versus food production: Does biofuels production increase food prices?’, Energy, vol. 36, pp. 2070-2076.
Arezki, R, Hadri, K, Loungani, P & Rao, Y 2013, ‘Testing the Prebisch-Singer hypothesis since 1650: Evidence from panel techniques that allow for multiple breaks, IMF Working Paper WP/13/180, viewed 17 October 2015, <https://www.imf.org/external/pubs/ft/wp/2013/wp13180.pdf>.
Baffes, J 2007, ‘Oil spills on other commodities’, Resources Policy, vol. 32, no. 3, pp. 126-134.
Bakhat, M & Würzburg, K 2013, Price relationships of crude oil and food commodities, Economics for Energy, Working Paper FA06/2013, viewed 1 September 2015, <http://www.eforenergy.org/ docpublicaciones/documentos -de-trabajo/WPFA06-2013.pdf>.
Balcombe, K 2011, ‘The nature and determinants of volatility in agricultural prices: an empirical study from 1962–2008’, in A Sarris & J Morrison (eds), The evolving structure of world agricultural trade, FAO, Rome, Italy, pp. 109–
136.
Berazneva, J & Lee, DR 2013, ‘Explaining the African food riots of 2007-2008: An empirical analysis’, Food Policy, vol. 39, pp. 28-39.
Chintia, S 2013, ‘Dampak guncangan harga minyak mentah dunia terhadap harga beras domestic (Suatu analisis kointegrasi)’, Thesis, IPB, Bogor.
Chen, M & Patel, K 1998, ‘House price dynamics and granger causality: An analysis of Taipei new dwelling market’, Journal of the Asian Real Estate Society, vol. 1, no. 1, pp. 101-126.
Dancy, J 2012, ‘Food prices mirror oil prices: The crude oil - FAO food price index price correlation’, Financial Sense, 14 May, viewed 17 October 2015, <http://www.financialsense.com/contributors/joseph-dancy/food-prices-mirror-oil-prices-the-crude-oil-fao-food-price-index-price-correlation>. Deny, S 2015, ‘Menteri PPN: Konsumsi beras nasional hanya 28 juta ton per tahun’,
27
Du, X, Yu, C & Hayes, D 2011, ‘Speculation and volatility spillover in the crude oil and agricultural commodity markets: A Bayesian analysis’, Energy Economics, vol. 33, pp. 497-503.
EIA 2015, What drives crude oil prices?, The U.S. Energy Information Administration, viewed 12 September 2015, <http://www.eia.gov/ finance/markets/supply-opec.cfm>.
Engle, RF & Granger, CWJ, 1987, ‘Co-integration and error-correction: Representation, estimation and testing’, Econometrica, vol. 55, pp. 251-276. Fahriyadi & Laoli, N 2015, ‘Ekspor minyak goring mulai kesat’, Kontan, viewed
14 October 2015, < http://industri.kontan.co.id/news/ekspor-minyak-goreng-mulai-kesat>.
Gardebroek, C & Hernandez, MA 2013, ‘Do energy prices stimulate food price volatility? Examining volatility transmission between US oil, ethanol and corn markets’, Energy Economics, vol. 40, pp. 119-129.
Giles, D 2011, ‘Testing for Granger Causality’, Econometrics Beat: Dave Giles' Blog, 29 April, viewed 06 October 2015, <http://davegiles.blogspot.com.au/ 2011/04/testing-for-granger-causality.html>.
Gogoi, A 2014, ‘Investigating the long run relationship between crude oil and food commodity prices’, Dissertation, University of Nottingham, Nottingham. Granger, CWJ & Newbold, P 1974, ‘Spurious regressions in econometrics’,
Journal of Econometrics, vol. 2, pp. 111-120.
Harahap, AM, 2012, ‘Perilaku dan integrasi harga CPO di pasar Indonesia dan dunia’, Thesis, UGM, Yogyakarta.
Hasibuan, NA, 2015, ‘Dua strategi tingkatkan produksi gula nasional’, CNN Indonesia, viewed 06 October 2015, <http://www.cnnindonesia.com/ ekonomi/20150407011615-92-44634/dua-strategi-tingkatkan-produksi-gula -nasional/>.
Hatanaka, M 1996, Time-series-based econometrics: Unit roots and cointegrations, Oxford University Press, Oxford.
Jaramaya, R 2015, ‘Indonesia jadi salah satu pengimpor gandum terbesar dunia’,
Republika Online, viewed 14 October 2015, <http://www.republika.co.id/
berita/ekonomi/makro/15/04/05/nmbvyl-indonesia-jadi-salah-satu-pengimpor-gandum-terbesar-dunia>.
Ji, Q & Fan, Y 2012, ‘How does oil price volatility affect non-energy commodity markets?’, Applied Energy, vol. 89, no. 1, pp. 273-280.
Kaltalioglu, M & Soytas, U 2011, ‘Volatility spillover from oil to food and agricultural raw material markets’, Modern Economy, vol. 2, no. 2, pp. 71-76. Komarudin, H, Obidzinski, K & Andrianto, A 2012, ‘Biofuel development in Indonesia: Progress and challenges’, PowerPoint presentation, viewed 04 October 2015, <http://www.slideshare.net/ CIFOR/biofuel-development-in-indonesia-progress-and-challenges>.
Locke, A, Wiggins S, Henley G & Keats, S 2013, ‘Diverting grain from animal feed and biofuels’, Working Paper, Overseas Development Institute.
Mueller, SA, Anderson, JE & Wallington, TJ 2011, ‘Impact of biofuel production and other supply and demand factors on food price increases in 2008’,
Biomass and Bioenergy, vol. 35, no. 5, pp. 1623-1632.
28
Ningsih, D 2015, ’25 juta ton target produksi jagung tahun 2015’, Beritasatu.com, viewed 06 October 2015, <http://www.beritasatu.com/ekonomi/270935-25-juta-ton-target-produksi-jagung-tahun -2015.html>.
Obadi, SM & Korček, M 2014, ‘Are food prices affected by crude oil price: Causality investigation’, Review of Integrative Business & Economics Research, vol. 3, no. 1, pp. 411-427.
Paarlberg, R 2009, Starved for science: How biotechnology is being kept out of Africa, Harvard University Press, Cambridge.
Pangaribowo, EH & Tsegai, D, 2011, ‘Food demand analysis of Indonesian households with particular attention to the poorest’, Discussion Paper, Center for Development Research, University of Bonn.
Schneider, M 2008, ‘We are hungry! – A summary report of food riots, government responses, and states of democracy in 2008’, Working Paper, Department of Development Sociology, Cornell University.
Serra, T 2011, ‘Volatility spillovers between food and energy market: A semiparametric approach’, Energy Economics, vol. 33, no. 6, pp. 1155-1164. Tadesse, G, Algieri, B, Kalkuhl, M & Braun, JV 2014, ‘Drivers and triggers of international food price spikes and volatility’, Food Policy, vol. 47, pp. 117-128.
Tenenbaum, DJ 2008, ‘Food vs. fuel: Diversion of crops could cause more hunger’,
Environmental Health Perspectives, vol. 116, no. 6, pp. 254-257.
Tillier, M 2009, What affects oil prices?, Oil Price.com, viewed 4 September 2015, <http://oilprice.com/ Energy/Oil-Prices/What-Affects-Oil-Prices.html>. UN 2011, The global social crisis, The United Nations, viewed 12 September 2015,
<www.un.org/esa/socdev/rwss/docs/2011/rwss2011.pdf>.
WHO 2015, Food security, The World Health Organization, viewed 17 October 2015, <http://www.who.int/trade/glossary/story028/en/>.
Wirawan, SS 2006, ‘Current and future usage of biofuels in Indonesia’, paper presented at the Australia – Indonesia Joint Symposium in Science and Technology, Agency for the Assessment and Application of Technology Republic of Indonesia, 13-14 September 2006.
World Bank 2015, Commodity markets, The World Bank, viewed 31 August 2015, <http://econ.worldbank.org/>.
Zhang, Z, Lohr, L, Escalante, C & Wetzstein, M 2009, ‘Ethanol, corn, and soybean price relations in a volatile vehicle-fuels market’, Energies, vol. 2, no. 2, pp. 320-339.
29