Analysis of chromosome aberration data b
Bebas
36
0
0
Teks penuh
Gambar
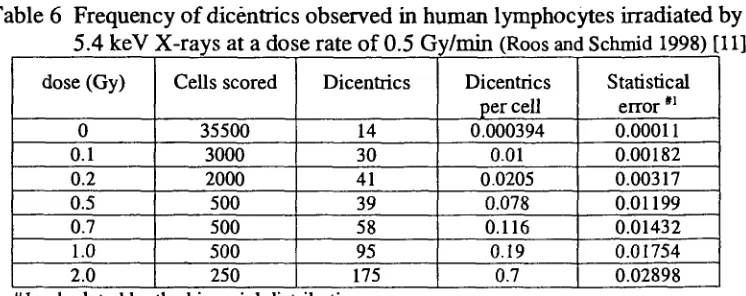
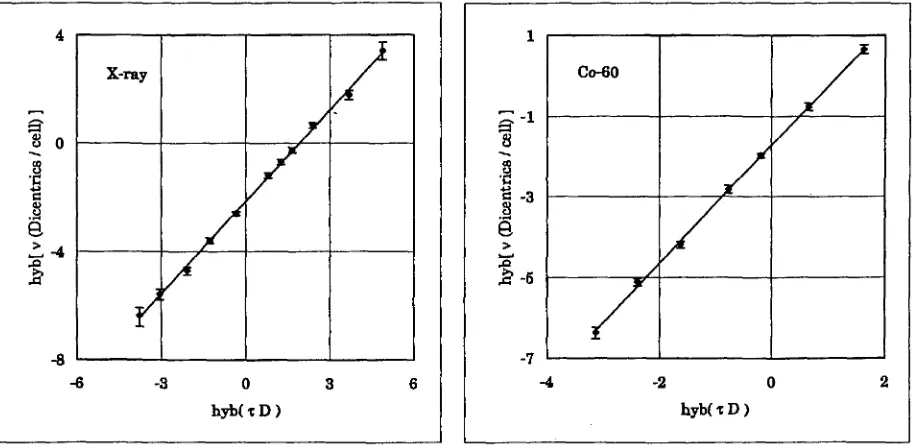
![Table 1 The relation between dose and chromosome aberrations (Sax, 1940) [8]](https://thumb-ap.123doks.com/thumbv2/123dok/575758.156393/22.597.119.478.496.724/table-relation-dose-chromosome-aberrations-sax.webp)
+7
Garis besar
Dokumen terkait
The Joad family sets up camp near an abandoned boxcar.. Not much later, twelve-year-old Ruthie Joad gets into a fight and tells her bully that her brother has killed two
Desorption curves 6 points per sample were collected on disturbed soils in the tension h range 0.2 to 150 MPa using the gravimetric method to measure water content w and the chilled
JHEP022022063 Contents 1 Introduction 1 2 Analysis overview and formalism 3 3 Belle and Belle II detectors 6 4 Data sets 6 5 Reconstruction and event selection 7 6 xDK± and y±DK
According to the 1996, 2004, and 2010 Demographic and Health Surveys, the maternal mortality ratios were 529, 578, and 454 per 100 000 livebirths, respectively, with wide CIs.17,18
the b-value method, AE signal intensity, average frequency (AF) versus RA (RA means rise time divided by the amplitude), and cluster
