Fuzzy Logic Application in Boron and Cadmium
Analysis in U
3
O
8
use of Emission
Spectrograph Method
S. Simbolon1*, Supriyono2, Aryadi1 and T. Rahardjo1
1Centre for Accelerator Technology and Material Process, National Nuclear Energy Agency Jl. Babarsari, Mailbox 1008 Yogyakarta 55010
2Polytechnique Institute of Nuclear Technology, National Nuclear Energy Agency Jl. Babarsari, Mailbox 1008 Yogyakarta 55010
A R T I C L E I N F O A B S T R A C T
Article history:
Received 28 December 2009
Received in Revised form 29 November 2010 Accepted 8 February 2011
Keywords:
Fuzzy logic emission spectrograph Mamdani-type
Memberships Triangular Trapezoidal Generalized-bell Gaussian
Boron and cadmium in U3O8 have been analyzed with emission spectrograph. Three
inputs of emission spectrograph, current (A), exposure time (second) and gap between electrodes (mm) were varied. Two outputs, boron and cadmium lines intensities respectively were selected and measured. Thirteen experiments have been carried out and data found were calculated by fuzzy logic Mamdani-type. Three and five memberships functions of straight-line (Triangular, Trapezoidal), Generalized-bell and Gaussian curve were used to analyze the found data. The result found that five memberships functions had less error percentage range than three memberships functions of straight-line (Triangular, Trapezoidal), Generalized-bell and Gaussian curve. The error percentage range of cadmium analysis was wider than boron analysis with this method. Analysis of cadmium in U3O8 with this
method needs much exposure time compare to analysis of boron.
© 2011 Atom Indonesia. All rights reserved
INTRODUCTION∗∗∗∗
Uranium oxide is widely used as a nuclear fuel in nuclear reactor on the other hand, as we know nuclear fuel has to be free especially from high neutron absorber elements such as boron and cadmium. A well-known organic solution TBP-kerosen commonly used for extraction method is to purify uranium solution. Analysis of boron, cadmium and other impurities elements in U3O8 in powder form has to be done with emission spectrograph because this method is better than other methods when the sample is in powder form [1]. The complexity of B and Cd analysis in U3O8 in powder form with emission spectrograph is seen from the thermochemical and physical reaction of impurities elements in high temperature and performance emission spectrograph method. Boron, cadmium and some other impurities elements in U3O8 powder can be analyzed simultaneously with emission spectrograph method. The basic concept of emission spectrograph method is dependent on the temperature of the arc, where the higher the temperature of electrode, the more atom will be excited [2,3].
∗Corresponding author.
E-mail address: [email protected]
The electric DC arc source is connected to two graphite electrodes which is separated each other, the gap between them is narrow. One of the graphite electrode is connected to negative and the other is connected to positive terminal of dc arc source. When the current flows from negative electrode to positive one or working electrode it has to go through the gap (air) which is high resistance. Simple circuit and detection of emission spectrograph is depicted in Fig. 1.
Fig. 1. Simple circuit of arcing and detection of emission
DC arc source transfers energy to the air between electrodes brings about that air electrically conductive with high resistance which creates plasma arc. The main function of the electrode is to locate sample since the heat is concentrated in the gap of electrodes. The temperature of the arc is dependent on the current, time of arcing and the gap between electrodes to some degree.
Process of excitation-deexcitation of B and Cd in U3O8 with emission spectrograph is assumed to be a pseudo-first order consecutive reaction. Admittedly, the simplified model above have some limitations [3]. Both chemical and physical reactions are occurred in sample U3O8 containing B and Cd when the experiments were done. Complex mathematical model or non-linearity of B and Cd intensities are appropriate, but it might be unfeasible. Fortunately, fuzzy logic or linguistic model has gained increasing acceptance as a way to solve complexity and uncertainty in measuring boron and cadmium intensities. Fuzzy logic concepts plays an important role in analytical chemistry for optimization process and modeling method for complex situation and non-linear system [4,5,6]. The uncertainty is inherent in every measurements and fuzzy logic takes into account such uncertainty. This is the advantage of fuzzy logic over classical method.
The operation of fuzzy logic proceeds in three steps. The first step is a conversion of measurements results into membership function shape in the fuzzy set. IF-THEN rules are linguistic model which are applicable, such as high, medium and low intensities for three membership functions. Out put of the fuzzy logic results are converted back into crips values [6,7]. The disadvantages of fuzzy logic are determining the number of membership function and the membership function shape.
The objective of this work is to compare the number of three and five memberships functions of straight-line (Triangular, Trapezoidal), Generalized bell shape and Gaussian curves using fuzzy logic according to variety of operating conditions current (A), time of exposure (second) and gap between electrodes (mm) are inputs, meanwhile, B and Cd intensities are the outputs.
EXPERIMENTAL METHODS
The U3O8 powder was obtained from (CAMPT), TBP and HNO3 were obtained from Merck, meanwhile AgCl, Ga2O3, LiF, standard powder of CdO and of H3BO3 were obtained from Spex Industries. Film for thorax, developer D19 B and kerosene were obtained from Kodak and Fisher,
respectively. About 5 g of U3O8 was dissolved in HNO3 then was extracted, stripped and calcinated will result U3O8 pure in powder form. Samples were prepared carefully by mixing powder of U3O8, CdO and H3BO3 in a mortar homogeneously. Firstly, it was prepared a sample 10000 ppm of boron and cadmium by mixing 0.931355 g of U3O8 and 0.011423 g of CdO and 0.05722 g of H3BO3. Secondly, 20 mg of above sample of 10000 ppm boron and cadmium was mixed with 180 mg of U3O8 homogeneously in a mortar, it was found 1000 ppm of boron and cadmium. Furthermore, 100 ppm sample was found by mixing 20 mg of sample of 1000 ppm was mixed with 180 mg U3O8. Eventually it was found sample containing 5 ppm of boron and cadmium in U3O8 matrix by mixing 50 mg of 100 ppm sample found was mixed with 950 mg of U3O8 pure. A ninety five mg of sample containing 5 ppm of boron and cadmium was mixed with 5 mg of carrier distillation which composes of mixture AgCl (950 mg), Ga2O3 (10 mg) and LiF (40 mg) in a mortar homogeneously. Fifteen identical samples were prepared for experiments. Each identical sample was located in working electrode and experiments were carried out by varying currents, time of exposure and the gap between electrodes of emission spectrograph. Boron and cadmium intensities were measured and the results of measurements were presented in Table 1.
Table 1. The relationship between boron and cadmium intensity
in U3O8 with variation of Current (A), Gap between electrodes
(mm) and Time of exposure (second).
RESULTS AND DISCUSSION
this method, otherwise, some difficulties were encountered in observed boron and cadmium
lines which contains high background or interference lines.
Extra careful has been done to prepare homogeneous sample of U3O8 and its impurities boron, cadmium and when it was mixed with carrier distillation. Under identical samples contain matrix U3O8 and its impurities element, a series of experiments was performed with difference operation conditions. It causes different temperature in plasma arc which influences the number of boron and cadmium atomization, excitation de-excitation process. Increasing temperature of atomizing plasma arc between electrodes gives slightly higher atomization, excitation de-excitation process or peak heights of boron and cadmium. It should be understood that the values of boron and cadmium intensities are heavily depend on the temperature of the plasma arc between electrodes.
The use of limited combination of current, gap between electrode and time of exposure will result longer life of instrument. Exploration in higher temperature of the plasma arc between electrodes can be dealt to with shorten life of part of instrument. Graphite electrode holder, for example, is made of stainless steel eventually will be easy broken and loser its tension when it exposed to a high temperature for long time.
Samples matrix U3O8 is stable at high temperature, meanwhile boron and cadmium as impurities elements go through complicated thermo-physical-chemical reaction. Under ideal conditions, boron and cadmium should exhibit their unbiased lines and U3O8 as a matrix in sample will not change in high temperature. However, in reality, during the experiments period, the powder of U3O8 and impurities elements in working electrode physically change because of high temperature plasma arc. Moreover, small amount of uranium exhibit relatively high background, since uranium has complex electronic structure and produces complex spectra. Although, graphite is a good electric and heat conductor, when it is in plasma arc temperature nitrogen from air will react with carbon from graphite to form CN band. It causes higher background, therefore, ideally, nitrogen from air
should be replaced by noble gas such argon, krypton.
Under ordinary condition, the plate film detector for thorax gives qualitative and quantitative information for impurities elements such as boron line at 2497.73 Å and cadmium line at 2288.022 Å, respectively as well as normal detector. All background of U spectra from U3O8, CN band from
graphite and nitrogen from air are recorded either. As mentioned above, all background are far away from analytical lines, therefore, boron and cadmium lines are slightly influence the both observed lines.
There are three factors influenced the performance of arcing temperature which will be atomizing-exciting boron and cadmium in U3O8 sample. The combination of current, time of exposure and the gap between electrodes are main variables of producing the amount heat in working electrode. Each factor is varied in a number of simulation in order to obtain a quantitative dependence to be used. Although, every analytical measurement contains inaccuracy and imprecision sources, measurements should be done under proper procedure in order to reduce inaccuracy in every measurement.
As previously mentioned, impurities elements go through complicated thermo-physical-chemical when arcing starting, some reasonable approaches need to be made to solve the problems. All the samples are pseudo homogeneous and steady state of arcings are stable for all a series of experiments. Simple decomposition of impurities oxide, excitation, emission and detection of the sample and all of them are started at the beginning of the exposure time. All emitted lines are assumed to be one dimensional and direct to detector. Intensities of analyte lines are proportional to the temperature or heat of the plasma arc.
Two different wavelengths at 2497.73 Å for a
boron and at 2288.022 Å for a cadmium line emissions were measured. Each of these signals
is generated by a similar mechanism. Boron and cadmium emission require complete atomization and excitation-deexitation in the sample of U3O8. Even though these experiments were done with carefully, the results found as shown in
Table 1 are not free from uncertainties and vagueness. Because physical-chemical reaction
of B and Cd in powder sample U3O8 are very complex. Moreover, the plasma temperature in
the in the arc, where the samples are located, rises very rapid and in a very short time. On the other hand, precision and accuracy are the
indicators for conventional chemical analysis. So, if
the data found in Table 1 were solved by conventional method, the results would have not been statisfied. Fuzzy logic is a unique and innovative method which has been established
and applied to solve simple or complex mathematical modeling. Therefore, it is interesting
to consider using of fuzzy logic because it is convenient technique for uncertainties and
Interestingly, the application of fuzzy logic in chemical analysis is an area of continuing importance. Based on fuzzy inference system, data on Table 1 above contains input and multi-output or (MIMO). However, each MIMO above can be divided into two MISO’s (MISO = multi-input and single-output) because it has two outputs boron and cadmium intensities [8, 9, 10]. Moreover, in each membership function shape has two MIMO’s, they have three and five memberships functions. Two straight-line (Triangular and Trapezoidal), Generalized-bell and Gaussian curve membership functions shape have been applied to data in Table 1. Therefore, there will be found sixteen calculations of fuzzy logic of MISO since each of four memberships function shape has 2 type of calculations as shown in Fig. 2.
Fig. 2. Block diagram of four memberships functions shape
have been applied in fuzzy inference system to produce 16 MISOs.
Mamdani-type inference system according to variety of operating conditions (current, time of exposure, gap between electrodes) of emission spectrograph was used instead of Takagi-Sugeno-type. Matlab program contains Mamdani-type inference system is applied because it is friendly use, even in a Mamdani-type inference system, both the if part and the then part are still fuzzy linguistics.
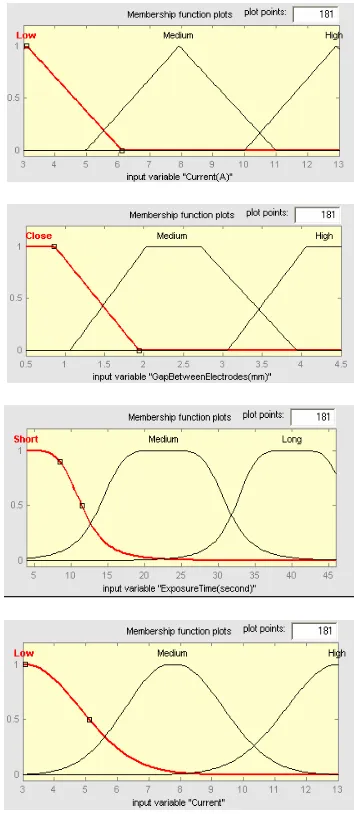
Model of membership functions shape of straight-line (Triangular, Trapezoidal), Generalized-bell and Gaussian curve each of them has three memberships function is shown in Fig. 3. Fuzzy model inference system is built with three inputs, they are currents range from 3 A up to 13 A, while
exposure time range from 4 seconds up to 46 seconds, and the gap between electrodes range
from 0.5 mm up to 4.5 mm. These outputs are boron and cadmium intensities which have range from 0.1 up to 0.9 for boron and from 0.2 up to 0.5 for cadmium respectively. Those ranges are divided into three linguistics categories such as low, medium and high for current while for gap between electrodes are close, medium and high and for exposure time are short, medium and long.
Fig. 3. Straight-line (Triangular, Trapezoidal), Generalized-bell and Gaussian curve forms for three memberships functions.
Three and five Triangular memberships function
Three and five Trapezoidal memberships function
Three and five Gaussian curve memberships function
Three and five Generalized-bell shape memberships function
Fuzzificztion Defuzzificztion
Results 8 MISO Boron
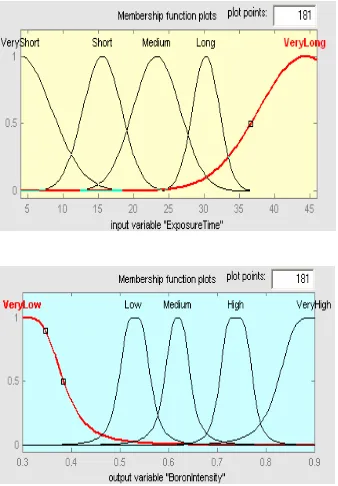
Fig. 4. Straight-line (Triangular, Trapezoidal), Gaussian curves
and Generalized-bell forms for five memberships functions.
In order to have another effect of number memberships function, the same data were calculated by five memberships functions
As mentioned above, the number of experiments are limited because of instrument life time is also important to consider, so there are 13 fuzzy logic rules are set up as shown in Fig. 6 below. Based on the possibility fuzzy logic rules, if there are three inputs and three
membership functions and two inputs three will be 3 × 3 × 3 × 3 × 3 = 243 rules. Furthermore, if there
are three inputs and five membership functions, there will 5 × 5 × 5 × 5 × 5 = 3125 rules. It is too
many rules should be done for fuzzy logic. As a result, neither instrument point of view, nor capability of computer to run the program were good since so many experiments and rules have to be done and considered. The main advantage of fuzzy logic is tolerance with imprecise and inaccurate data, so fuzzy logic could do with incomplete or non ideal data. Thirteen rules are appllied for calculation fuzzy logic. It was constructed by combination three inputs and two output as shown in Fig. 5.
The results of combination between three inputs and two outputs are tabulated as shown in
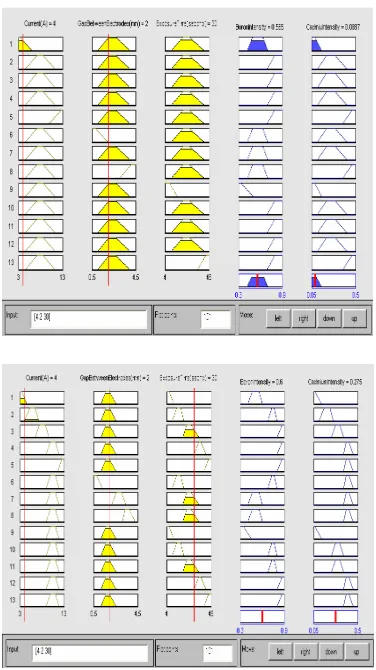
Fig. 6. The calculation result of using fuzzy logic for boron and cadmium intensities are simultaneously not sequential. When the inputs
were changed, there would have been output of
Fig. 5. Rules of fuzzy logic were used for calculation.
variable which are in linguistics called by very low, low, medium, high and very high for boron and cadmium intensities. Linguistics variable for gap between electrodes are very short, short, medium, far and very far as shown in Fig. 4.
boron and cadmium simultaneously. Either three or five memberships function of straight-line
calculation is very fast, it will be found a picture as shown in Fig. 6.
Fig. 6. Rule viewer of fuzzy logic calculation.
The calculation was carried out using Mamdani-type inferences system for three and five memberships functions for four different memberships functions shape. In spite of the fact that fuzzy logic is capable of capturing uncertainties and incomplete data there are still the difference between output of fuzzy logic and data found as seen Table 2.
Table 2. Three Memberships functions of straight-line
(Triagular = Trimf), (Trapezoidal = Trampf), (Generalized bell = G-bell ) and Gaussian Curve for boron element.
F L = Fuzzy Logic , E P = Error Percentage, under line shows more than 10 %
The error percentage range of three memberships of functions Trimf for boron analysis was 1.896 % - 54.756 %, meanwhile the error percentage range for three memberships of functions Tramf for boron analysis was 1.913 % - 21.226 %. It was found 7 and 6 results for error percentage over 10 % for membership functions of Trimf and Tramf functions respectively. Other memberships functions used were G-Bell and Gaussian curve, the error percentage range of three memberships functions of G-Bell for boron analysis was 0.727 % - 22.300 %, meanwhile the error percentage range of three memberships functions of Gaussian for boron analysis was 3.620 % - 23.231 %. The number of error percentage over 10 % were found 6 and 8 for memberships functions G-Bell and Gaussian Curve respectively. Based on the error percentage range, three memberships functions of Trimf calculation was wider than to three other calculations. Moreover, the error percentage range for three memberships functions of Tramf, G-Bell and Gaussian curve calculations were almost constant, they were about 20 %.
The difference between output of fuzzy logic
and data found and their error percentage for boron use of five memberships functions can be seen in Table 3.
Table 3. Five Memberships functions of straight-line
( Triagular = Trimf), (Trapezoidal = Trampf), (Generalized bell = G-bell ) and Gaussian Curve for boron element.
F L = Fuzzy Logic , E P = Error Percentage, under line shows more than 10 %
was 0.715% and for memberships functions of G-bell the highest was 8.648% and the lowest
0.119% respectively. The number of error percentage over 10%, it was found one for five memberships functions of G-bell and nothing for five memberships functions of Gaussian Curve. Based on error percentage range among five memberships functions, it was found that five memberships functions of Trimf and Tramf for analyzing boron were less accurate and precious than five memberships functions of G-Bell and Gaussian curve calculation. The second element important in analyzing impurities elements in nuclear fuel was cadmium. Cadmium intensity was lower than boron intensity, it causes bigger error percentage as seen in Table 4.
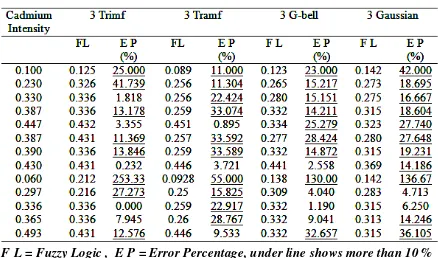
Table 4. Three Memberships functions of straight-line
(Triagular = Trimf), (Trapezoidal = Trampf), (Generalized bell = G-bell ) and Gaussian Curve for cadmium element.
F L = Fuzzy Logic , E P = Error Percentage, under line shows more than 10 %
The error percentage range of three memberships functions of Trimf for cadmium analysis was 0.000% - 253.333%, meanwhile for five memberships functions of Tramf the error percentage range was 0.894% - 33.592%. There were 8 and 10 results found which are error percentage over 10%. Other memberships functions used were G-Bell and Gaussian of three memberships functions, the error range of three memberships functions of G-Bell for cadmium analysis was found the highest was 130% and the lowest was 1.190% and for three memberships functions of G-bell for cadmium analysis the highest was 136.667% and the lowest 4.713. It was found that 9 and 10 results which are error percentage over 10%. All the error range of three memberships functions were too wide for conventional chemical analysis which need high accurate and precision. Moreover, almost all experiments had error range were over 10%. It is hard to accept this model for analyzing important impurities elements in nuclear fuel such as U3O8. It is important to compare above
model with five memberships functions as shown in Table 5.
Table 5. Five Memberships functions of straight-line
(Triagular = Trimf), (Trapezoidal = Trampf), (Generalized bell = G-bell ) and Gaussian Curve for cadmium element.
F L = Fuzzy Logic , E P = Error Percentage, under line shows more than 10 %.
The error percentage range of five memberships conditions of Trimf for cadmium analysis was 0.000% - 38.333%, meanwhile for five memberships conditions of Tramf the error percentage range was 0.337% - 71.399%. There were 5 and 7 results found which were error
percentage range over 10%. Others memberships functions used were G-Bell and Gaussian curve, the error range of five memberships functions of G-Bell for cadmium analysis was 0.606% - 61.667%, meanwhile for five memberships functions of Gaussian curve the range was 1.419% - 46.667% and the number error percentage range over 10% it were found 4 and 7 calculations. From error percentage range point of view, five memberships functions of Trimf, Tramf, G-Bell and Gaussian curve was better than three memberships function of Trimf, Tramf, G-Bell and Gaussian curve.
CONCLUSION
The complicated physical-chemical interaction of boron oxide and cadmium oxide in high temperature condition in U3O8 compound are the key to understand on how B and Cd lines can be selected and measured. The use of fuzzy logic in analyzing B and Cd in U3O8 with emission spectroscopy has not been perfect yet, but it has demonstrated some impressive success in capturing basic aspects. The computational of fuzzy logic use of Mamdani-type has been employed for four membership function shapes, Trimf, Tramf, Generalized-bell and Gaussian curves, for three
inputs and two inputs. More importantly, five memberships function are less error range than
The widest error percentage range after fuzzy logic calculation was done in shortest time of exposure, so time of exposure was very important in emission spectrograph method for analyzing
cadmium, on the other hand, analyzing boron in shortest time of exposure was not
influenced much. This preliminary development enables, in principle, the study of chemical analysis
deeply with computer and so it is also a challenging for analytical chemist to master
computer science.
ACKNOWLEDGEMENTS
The authors wish to thank Miss Tatien Hapsari, the student of the Polytechnique Institute of Nuclear Technology, Yogyakarta who helped us for samples preparation.
REFERENCES
1. S. Simbolon, J. Tek. Bhn. Nukl. 4 (2008) 28. 2. S. Simbolon, J. Tek. Bhn. Nukl. 5 (2009) 70.
3. C.L. Chakrabarti, et al., Spectrochimica Acta
38b (1983) 1287.
4. G. Hayward and V. Davidson, Analyst 128 (2003) 1304.
5. P.B Osofisan and O.J. Obafaiye, The Pacific
Journal of Science and Technology 1 (2007) 59.
6. O. Mathias, et al., Pure Appl. Chem. 64
(1992) 497.
7. V. Duraisamy, et al., Academic Open Internet
Journal 13 (2004) www.acadjournal.com. Retrieved June 15 (2008).
8. S.N. Sivanandan, S. Sumathi and S.N. Deepa, Introduction to Fuzzy Logic Using Matlab, Springer-Verlag, New York Inc. (2006).
9. Fuzzy Logic Toolbox User’s Guide http://Dali.Feld.Cvut.Ct/Cebna/Matlab/Pdf_Do c/Fuzzy/Fuzzy. Retrieved August 1 (2009). 10. P. Gomez, Fuzzy System - A Practical Guide to