Work-related acculturation: Change
in individual work-related cultural
values following immigration
ARTICLE in THE INTERNATIONAL JOURNAL OF HUMAN RESOURCE MANAGEMENT · JANUARY 2012
Impact Factor: 0.93 · DOI: 10.1080/09585192.2012.672446
CITATIONS
5
READS
54
3 AUTHORS, INCLUDING:
Julie Rowney
The University of Calgary
8PUBLICATIONS 178CITATIONS
SEE PROFILE
Piers Steel
The University of Calgary
54PUBLICATIONS 2,386CITATIONS
SEE PROFILE
Work-related acculturation: change in individual work-related
cultural values following immigration
Vas Tarasa*, Julie Rowneyband Piers Steelb
a
Bryan School of Business and Economics, University of North Carolina, Greensboro, NC, USA; b
Haskayne School of Business, University of Calgary, Calgary, Canada
The effects of culture in the workplace have been well documented. Because cultures vary across countries, business practices that are effective in some regions may not be effective in others. While cross-country cultural differences have been explored in depth, little is known about cultural variations and dynamics in the context of immigration. On the basis of a multilevel study of 2163 immigrants and locals residing in Canada, we investigate (1) patterns of immigrant acculturation; (2) the relationship between acculturation of visible elements of culture, such as language proficiency or cuisine and music tastes, and acculturation of tacit cultural values and (3) individual- and group-level predictors and moderators of acculturation. The results are discussed with a focus on implications for practitioner managers and immigration policy makers.
Keywords: acculturation; cross-cultural management; culture; culture change; immigration
Pa´ nta r´eı˜ (Everything flows).
Heraclitus
Recent decades were signified by unprecedented cross-national migration around the world. For example, according to national census reports, annual immigrant influx approaches a million in the USA, half a million in the EU and a quarter million in Canada. While immigration creates great opportunities, it also poses challenges, not the least of which is cultural. Research has effectively demonstrated that culture greatly affects most aspects of business. Perceptions, attitudes, preferences and behaviors of employees and customers are, to a large extent, shaped by culture (Taras, Kirkman and Steel 2010a). As a result, managerial practices may not be transferable across national borders and culture must be taken into account to maximize organizational performance (Tayeb 1998).
Several large-scale projects (Hofstede 1980; Schwartz 1992; House, Hanges, Javidan, Dorfman and Gupta 2004) explored cultural value differences around the world and clustered countries into cultural regions. A substantial body of research allows for predicting and adjusting management systems to match the local culture. However, can these results be generalized to management of immigrants? By definition, immigrants have ties to two or more countries. Should immigrants be assumed to retain the values of their country of origin or should they be assumed to internalize values of their host countries? What is the culture of an employee, customer or business partner who, for example, grew up in China but has lived in the USA for the past 10 years? Would the
ISSN 0958-5192 print/ISSN 1466-4399 online q2013 Taylor & Francis
http://dx.doi.org/10.1080/09585192.2012.672446 http://www.tandfonline.com
*Corresponding author. Email: [email protected]
approach that works best in China work best for Chinese immigrants in the USA, or should it be assumed that their values have Americanized?
Hundreds of publications have addressed issues of acculturation, and it may appear that the topic has been well explored. However, acculturation research has traditionally focused on changes in cultural artifacts, such as language proficiency, preferences for music, cuisine, media and clothing style (Rudmin 2009). While artifacts and rituals are important attributes of culture, they are somewhat extraneous in management research. In the business context, tacit cultural values are much more important as it is the values, not artifacts, that govern perceptions and reactions and thus can help explain, predict and influence individuals’ decisions and behaviors in the workplace. Unfortunately, acculturation researchers have traditionally studied changes in cultural artifacts, and cross-cultural values scholars limited their inquiry to exploration of current cross-country cultural value differences. Meanwhile, acculturation of individual values has remained largely unexplored.
The present study contributes to our understanding of acculturation in four ways. First, we integrate two bodies of research – artifact-focusedacculturationliterature andvalue -focused comparative management literature – to exploreacculturationofvalues. Second, although our data set is cross-sectional and does not allow for a true longitudinal perspective, by including the length of residence of immigrants in their host country we make a step toward exploring the dynamics of individual cultural values. Third, by examining acculturation at both the visible artifact and the tacit value levels we test whether or not observable artifact acculturation indicators, such as changes in local language proficiency and dietary preferences, can provide an accurate estimate of acculturation of values. Finally and most importantly, we employ multilevel modeling to explore individual-and group-level factors that have direct individual-and moderating effects on acculturation.
We start with a brief review of the literature on culture and acculturation. Then, we describe and provide theoretical rationale for our acculturation model. Last, we discuss the results of our study, consider the implications of our findings for organizations that employ immigrants and provide a list of recommendations for optimizing immigrant employee integration programs.
Literature review
Culture
Culture is a multilayer construct, often depicted as an onion (cf. Hofstede 1980). At the surface level culture is represented by visible artifacts, such as clothing, language, traditions and rituals. At the core level, culture is represented by values. While cultural artifacts can be easily observed, cultural values are tacit and can be measured only indirectly. Although cultural artifacts may be important indicators of culture, they are merely surface expressions of the culture’s core. Differences in cultural artifacts are important and ignoring them may cause inconveniences and misunderstandings, but it is the cultural values that shape perceptions, attitudes and behaviors; it is the core values that must be understood to devise effective business practices and HR and customer relations strategies. Because of the relevance and predictive power of cultural values in workplace settings, value-based models of culture have dominated international business research. Indeed, a recent review of research on culture measurement revealed that virtually all existing instruments for quantifying culture focus on values (Taras, Rowney and Steel 2009).
based on a large international sample and to employ fairly advanced, for its time, research designs and statistical analysis tools. This work largely defined the path for future cultural studies (cf. Taras and Steel 2009). Following Hofstede, a number of alternative value-based models of culture have gained popularity, notably those offered by Schwartz (1992), Trompenaars (1993) and the GLOBE team (House et al. 2004). The rankings of national and ethnic entities along cultural dimensions offered by these studies provided a good starting point for understanding and managing cultural differences to optimize business performance in different cultural regions. While culture certainly does not explain all organizational phenomena (Chiang 2005), it is an important factor in many areas of business, from leadership (e.g. Pekerti and Sendjaya 2010) to compensation (e.g. Yeganeh and Su 2011), to decision making (e.g. Westhuizen, Pacheco and Webber 2011), and more. Understanding how cultures vary across different groups allows for maximizing performance by selecting management practices to match the cultural environment.
Acculturation
The early cross-cultural research focused on static cultural differences across countries (e.g. Hofstede 1980). However, cultures vary not only across geographic regions, but also over time (Taras, Steel and Kirkman 2011). The growth in immigration and expatriation made acculturation a salient business and research issue. Even though research into cultural change at both the national and individual levels is still in its infancy, the importance of the issue has been recognized since ancient times. The term ‘acculturation’ was first used over a 100 years ago in a report by the US Bureau of American Ethnography (Powell 1881), but probably the first academic account of acculturation appears in Plato’s Laws, written in the fourth century BC, in which he argued that humans have a tendency to imitate strangers and this introduces new cultural practices.
There are numerous definitions of acculturation, one of the most popular stating that ‘acculturation comprehends those phenomena which result when groups of individuals having different cultures come into continuous first-hand contact, with subsequent changes in theoriginal culture patterns[italics added] of either or both groups’ (Redfield, Linton and Herskovits 1936, p. 149). What are theoriginal culture patterns? The answer depends on how culture is defined. As noted above, in cross-cultural management research culture is commonly defined as a set of shared value systems (Hofstede 1980). Thus, since acculturation is a direct derivative from culture, it would be reasonable to define acculturation as a change in values in response to a contact with another culture. However, our review of the literature on acculturation returned an unexpected and striking finding. Our examination of over a thousand scholarly publications on culture and acculturation revealed a wide gap between the bodies of research published in the cross-cultural vis-a`-vis the acculturation literature. Effectively culture and acculturation studies are represented by two well-established bodies of literature that are directly related by the virtue of topic, but have no overlap in terms of definitions and methodology.
The culture research literature stems from the Hofstedianvalue-focused paradigm and appears mainly in business, management and psychology journals. Research in this area focuses on cultural values and explores static differences among various groups. The acculturation literature stems mainly from sociology, social psychology and public policy literature. This research explicitly addresses cultural change, but culture here is operationalized exclusively through cultural artifacts, almost completely neglecting cultural values. Items used in acculturation measures have been limited to changes in preferences for language, clothing style, media, following ethnic customs and traditions,
as well as measures of ethnic identity, adjustment to and coping with new environment, economic or social assimilation and choice of friends (for reviews see Berry 2003; Taras 2009a). Unfortunately, none of these measures captures cultural core values, which limits relevance and applicability to the acculturation research in management. In other words, the way culture has been operationalized in cross-cultural studies differs drastically from how it has been measured in acculturation research. From the Hofstedian value-focused view that has defined cross-cultural business research, there is no culture in extant acculturation models.
The research into the factors that affect acculturation pace and direction has also been scarce. As reviewed by Rudmin (2009) and Berry (2003), the focus of acculturation studies has been mainly on detecting acculturation, categorizing acculturation strategies, or studying socio-economic, psychological and physiological consequences of acculturation or a failure to change, while the list of moderators rarely went beyond age at immigration, a factor that had been originally posited by Plato over 2000 years ago. The present study attempts to fill this gap by offering and testing empirically a more complex multilevel moderated model of acculturation. Specifically, we explore acculturation of both cultural artifacts and cultural values, test how the two relate to each other, and analyze individual-and group-level factors that affect the pace individual-and direction of acculturation.
Theory
Predictors of value acculturation
Length of residence in the host country
As immigrants settle in the new country, they observe people around them, how they dress, talk, interact with each other, learn their customs, ceremonies, understand values and beliefs, and inevitably absorb some aspects of the local culture. Thus, prolonged exposure to a foreign cultural environment should lead to gradual acculturation. Acculturation may be a nonlinear process. Black and Mendenhall (1991) studied expatriate adjustment and found that it follows a U-shaped curve defined by rapid acculturation in the first weeks of novelty and excitement, followed by disillusionment and rejection of the host culture, which eventually transforms into a prolonged period of gradual adjustment. While we do not reject the swings in acculturation suggested by the U-curve theory, it is unlikely that we can detect the ups and downs of the first two brief stages with our data that operationalize length of residence in terms of years. Therefore, we expect to see only a gradual cultural assimilation. Specifically, we hypothesize that:
Hypothesis 1: Length of residency in host culture is positively related with the level of acculturation: immigrants who have spent more time in the host country have values that are closer to those of host country locals.
Value versus artifact acculturation
values. Since cultural values also affect work-related perceptions and attitudes, it could be hypothesized that observable cultural artifacts could predict workplace behavior. However, it is possible that the relationship between cultural artifacts and values is weak or nonexistent and one cannot be used to predict the other. The GLOBE study (House et al. 2004), which reported negative correlations between cultural values and practices, casts some doubt on the commonly assumed consistency between different facets of culture. The finding seemed to surprise even the authors of the study who expected to see positive correlations, though a number of plausible explanations for the surprising findings have been offered by other researchers (for discussion see Maseland and van Hoorn 2008; Taras, Steel and Kirkman 2010b). It must be noted, however, that what was labeled ‘cultural practices’ in the GLOBE study was only a remote proxy for cultural artifacts, such as cultural traditions and customs, and even less so for clothing style, music or cuisine. Moreover, the relationship was evaluated at the national level of analysis and it is not certain whether or not the same negative correlations would be observed between cultural artifacts and values at the individual level. Therefore, based on the original notion of the close relationship between different facets of culture, we predict that:
Hypothesis 2: There is a positive relationship between acculturation at the artifact and value levels: immigrants who are more proficient in the host-country language and display a greater degree of preference for local cuisine, media and news channels have values that are closer to those of the locals.
Education
As Cheng notes, ‘the process of borrowing educational practices from another society implies an acceptance of cultural values’ (1998, p. 14). Indeed, education is one of the key mechanisms that perpetuate culture (Hofstede 1980). As people pass through the educational system, they are indoctrinated in the existing cultural values, such as through daily pledges of allegiance (Schein 1967). While promoting values of the society may not be an explicitly stated function of formal education institutions, it is usually done at least to some degree. Teachers are often attributed a great expertise and their words are given high consideration. This is one of the reasons Schwartz (1992) chose teachers for his sample in his large-scale comparative study of national cultures. During formal education years, students learn from their teachers not only technical knowledge, but also cultural. Steel and Taras (2010) provided initial empirical support for this proposition. They found that people with more education had values that were more typical of the society where their education was obtained.
Although more education in the country of origin is likely to lead to less education in the host country and vice versa, one is not necessarily the inverse of the other. It is not unusual for immigrants with a degree from their country of origin to go back to school upon moving to a new country, as well as for immigrants with no degree to never pursue one in their host country. Furthermore, simply because education in the host country speeds up acculturation does not automatically mean that education in the country of origin slows it down, and vice versa. Therefore, using separate measures of education in home and host country is necessary to fully capture the effect of education on acculturation. Thus, we theorize that:
Hypothesis 3: Immigrants who received more education in their country of origin will have values that are more different from those of host country locals.
Hypothesis 4: Immigrants who received more education in the host country will have values that are more similar to those of host country locals.
As suggested above, the longer one interacts with a new culture the more one should acculturate. However, we theorize that it is not solely the time spent in the foreign country that explains the degree of acculturation, but that there are a number of individual- and group-level moderators that determine the pace and possibly direction of acculturation.
Individual-level moderators
Age at Immigration
Age at immigration is often cited as a likely moderator of acculturation pace (e.g. Ouarasse and van de Vijver 2005). Research has shown that younger people have more malleable values and attitudes and are more susceptible to influences of the environment and prone to change (Brandtstaedter and Greve 1994). Physiological and neurological differences may explain the different pace of acculturation of younger versus older people. A vast body of experimental clinical research has confirmed that neuroplasticity and the ability to absorb new information decreases with age (Doidge 2007). A notable example of this principle is the Janissaries of the fourteenth century, where Christian boys were successfully indoctrinated into the Turkish Islamic military. Therefore, we expect that:
Hypothesis 5: Age at immigration moderates acculturation pace so that the immigrants arriving in the host country at a younger age acculturate faster than immigrants arriving in the host country at an older age.
Contact Frequency
On the basis of intergroup contact theory (Jackson 1993) and social inclusion theory (Baumeister and Leary 1995), we hypothesize that frequency of contact with the host culture moderates acculturation. Although these theories were developed to explain ethnic prejudice and stereotypes, they may prove relevant in explaining immigrant acculturation. The intergroup contact theory postulates that lack of contact between representatives of different cultures leads to prejudice and conflict, while frequent contact, in contrast, promotes understanding, tolerance and cultural exchange (Allport 1954). The social inclusion theory is based on the assumption that the need to be in a group is genetically hardwired because belonging to a group confers an evolutionary advantage by increasing the chances of survival (Axelrod 1984). In a competition for resources, such as hunting territories or fertile lands, being excluded from a group automatically puts the excluded individual in competition with the group. Thus a failure to join a group causes aggression against the group and rejection of everything associated with that group. Moreover, if one succeeds and joins a group, retention of the group membership is often contingent upon one’s ability to conform to that group’s culture and norms thus making acculturation a key to survival (Buss 1990). Hence, contacts with locals should facilitate acculturation through cultural exchange, while a failure to establish ties with the locals may lead to hostile attitudes toward the host society and rejection of its culture. As frequency of contact with the representatives of the host culture is an indicator of the degree of inclusion into the host country society, therefore we hypothesize that:
Group-level moderators
Immigrant Network Size
Not only personal but also environment characteristics may moderate acculturation. Interaction with other immigrants from the same country of origin refreshes and reinforces initial values and attitudes. Therefore, it is reasonable to expect that immigrants who often interact with their compatriots are likely to retain their initial values longer. Access to other immigrants from the same country and ability to socialize with them are largely determined by the size of the immigrant group from that particular country in a particular community. Immigrants who settle in locations where there are many other immigrants from their country of origin are likely to interact more frequently with their compatriots, while those who settle in locations where there are no immigrants from their country of origin are bound to interact more with the locals. Therefore, we hypothesize that:
Hypothesis 7: The number of immigrants from the same country in a particular geographic location moderates the pace of acculturation so that those newcomers who live in locations where their country of origin is represented by a larger number of immigrants acculturate slower and those who live in locations where their country of origin is represented by fewer immigrants acculturate faster.
Method
Sample
Our data were collected in a major Canadian city by the means of a self-response survey of people residing in Canada but born outside the country (hereafter ‘Immigrants’). An additional sample of people born and raised in Canada (hereafter ‘Locals’) was used as a control group for testing the direction of acculturation. Questionnaires were distributed in prepaid business-reply-mail envelopes through immigrant settlement organizations, ethnic centers, businesses known to target immigrant population such as ethnic food stores, and businesses that employ comparatively large numbers of immigrants. A total of 200 organizations were contacted with a request for help with the survey of which 76 helped with questionnaire distribution. In most cases, the questionnaires were distributed to all eligible respondents, but in some cases potential respondents were simply informed about the study and the questionnaires were placed in common areas for those interested in participation to pick up. Owing to limited resources, we could not ensure random sampling, which as Cook and Campbell (1979) point out is an almost unavoidable issue for research in field settings. Consequently, a possibility of selection bias cannot be ruled out. However, given that the participants were recruited through a wide range of sources, it is unlikely that the demographic composition of the sample is drastically different from that of the general immigrant population. Ten thousand questionnaires were provided to participating organizations (though it is uncertain how many of them were distributed) of which 2306 were returned. Unfortunately, 143 questionnaires had to be discarded as they were improperly completed, reducing the sample size to 2163 (1713 immigrants and 450 locals). The sample included respondents from 28 countries that were clustered into 15 subsamples. The grouping was done based on language, as a common language plays a key role in promoting interaction within the group and inhibits interaction between the groups. For example, immigrants from the former USSR were grouped together as they all tend to be reasonably fluent in Russian. At the same time, we kept Polish, Romanian and Bulgarian
samples separate. Although these countries may be close geographically and culturally, their language differences preclude frequent interactions across these groups. We grouped together immigrants from Muslim countries but kept Pakistanis and Iranians as separate groups since they speak Urdu and Farsi, as opposed to Arabic, have a comparatively large portion, particularly in Iran, of Shia Muslims, as opposed to Sunni, and, as a result, have limited interactions with immigrants from Arab countries. Finally, we coded Hong Kong and Taiwan as separate subsamples as they have distinct histories and unique relationships with mainland China, which limits interactions among these immigrant groups. The few remaining countries (Indonesia, Laos, Philippines, Sri Lanka, Thailand and Vietnam) were represented by 2 – 8 individuals each. As the small subsample sizes preclude meaningful within-country analysis, these individuals were grouped together and their origin was coded as ‘Other’ for the purpose of the analysis.
As shown in Table 1, even though there were statistically significant demographic differences among the immigrant groups, the differences were not striking. Still, we ensured that demographic differences did not contaminate our results by controlling for demographics in our regression analysis.
Measures
We attempted to include in our model only values that are: (1) cultural, (2) work-related and (3) likely to differ between the local and immigrant subsamples. On the basis of reviews of available culture measures (Taras 2009b; Taras et al. 2009), we identified 27 cultural values that have been included in popular models of culture. We then conducted a survey of leading cross-cultural management scholars to evaluate to what extent each of the dimensions is perceived by the experts as cultural and likely to affect individual behavior in the workplace. The culture experts were selected using the following procedure. For a different meta-analytic research project, we identified 508 empirical studies that involved culture measurement. The authors of the studies were ranked by the number of publications and those who authored or coauthored five or more papers were contacted with an invitation to complete the survey. Most of them were university professors specializing in cross-cultural research. Of 43 contacted scholars, 28 provided their evaluations.
Table 1. Demographic characteristics, by region.
Variables Africa Arab China
Former
USSR Hong Kong India Iran Korea Latin America Pakistan Poland Romania Taiwan Other Canada
Age 32.9 28.1 35.5 33.7 32.6 33.7 27.2 29.2 32.0 35.7 31.9 37.1 33.7 33.3 27.3 Age at immigration 26.9 20.9 32.0 28.1 18.3 29.6 24.4 25.4 27.2 26.3 29.7 34.1 28.1 22.1 NA Years in Canada 6.0 7.2 3.5 5.6 14.3 4.1 2.8 3.8 4.8 9.5 2.2 3.0 5.6 11.2 NA Gender, % male 53.7 58.2 50.1 22.8 47.8 50.8 62.1 34.8 40.5 40.0 36.4 52.0 42.8 52.8 45.2 Student, % 48.8 22.9 29.2 12.6 23.9 45.5 48.3 50.9 30.1 26.0 29.4 34.4 12.6 30.6 31.0 Education in country
of origin, years
12.1 10.6 14.5 13.3 11.3 14.2 12.3 13.9 13.6 12.3 13.8 15.2 13.3 9.6 NA
Education in Canada, years 4.2 4.9 1.9 2.8 4.7 2.0 3.0 3.2 3.0 3.7 1.1 1.6 2.8 6.5 NA Education, total years 16.3 15.5 16.4 16.1 16.0 16.2 15.3 17.1 16.6 16.0 14.9 16.8 16.1 16.1 16.0 Immigrant network size:
Number of immigrants from the region in the city
663 7129 9002 3806 3903 8501 1232 2295 3017 2752 302 403 3,661 303 NA
Sample size 41 201 717 127 67 132 58 46 153 23 33 25 53 36 450
V.
Taras
et
al.
while Asian, Eastern European and Latin American countries tend to score at the high end of the continua.
Given our focus on acculturation of individuals, we developed our measures specifically for individual level of analysis. That is, similar to how it had been done with the CPQ4 instrument (Maznevski, DiStefano, Gomez, Noorderhaven and Wu 2002), our items were worded to solicit individual beliefs, rather than evaluations of national-level phenomena (items starting with ‘In your personal opinion. . . as opposed to ‘In this society . . .) and the test factor structure and psychometric properties were assessed using individual-level data (for a recent review of challenges and best practices with regard to developing individual versus national level culture measures see Taras et al. 2009). The constructs were measured using six items for power distance (e.g. ‘In business, people in lower positions should not question decisions made by top managers’); six items for gender egalitarianism (e.g. ‘Business meetings usually run more effectively when they are chaired by a man’) and five items for status attribution (e.g. ‘One’s family background is usually a good predictor of one’s future effectiveness in the workplace’). The responses were collected using a seven-point Likert-type scale ranging from completely disagree to completely agree. The internal reliabilities were 0.82, 0.68 and 0.71, respectively.
Acculturation at the visible artifact level was operationalized through measures that included self-assessed proficiency in the host-country’s written and oral language, preference for North American music, TV, news sources and cuisine. These measures were combined into a single visible acculturation construct. The internal reliability of the construct was 0.62. To aid interpretation, we converted all value and artifact acculturation measures to a common 1 – 100 scale and scored them so that low scores represent a greater degree of acculturation. In other words, a negative HLM regression coefficient in our report shows that the corresponding factor speeds up acculturation pace.
We also recorded respondents’ age at immigration, education received in the country of origin and in Canada, gender, student status and contact frequency with the host culture, which was measured as self-reported percent locals constitute among the individuals the immigrant respondents interact with on a regular basis at work and at home (Table 2). Please note that, strictly speaking, the latter is a measure of ratio of contact frequency with locals versus immigrants, but for simplicity we use the term ‘contact frequency’ hereafter. Finally, using the 2008 Canada Census report we also added our group-level moderator, the compatriot network size, which was measured as the number of immigrants from each of the 15 regions in our data collection city. Table 3 provides a complete variable correlation matrix.
Results
Despite a few significant mean differences across subsamples, the immigrant groups did not differ substantially in terms of their cultural values or artifacts (Table 2). As expected, locals scored significantly lower than did immigrants from any of the represented regions along all three cultural value dimensions.
Table 2. Acculturation at value and artifact levels, means.
Value acculturation Visible acculturation
Region PD GE SA Written English Oral English Music TV News Food Overall index
Africa 50.1 49.8 61.4 39.9 38.4 50.0 27.8 60.3 53.0 44.9
Arab 42.9 51.6 50.3 44.2 47.9 57.0 54.0 54.7 56.9 52.5
China 47.5 53.4 56.9 58.9 57.2 63.9 54.0 47.1 42.9 54.0
Former USSR 43.8 47.7 51.8 40.5 49.6 46.3 51.3 57.0 45.0 48.3
Hong Kong 35.5 33.2 51.7 29.2 39.9 51.9 39.2 47.2 52.8 43.4
India 41.8 49.7 50.7 48.2 49.4 54.4 60.2 59.8 51.3 53.9
Iran 41.5 48.4 52.4 50.7 47.2 62.0 66.9 60.3 65.8 58.8
Korea 46.9 40.9 57.2 58.4 52.4 54.5 48.2 49.1 56.3 53.2
Latin America 41.4 37.4 50.8 50.4 58.9 37.7 57.4 58.6 68.3 55.2
Pakistan 44.9 52.1 49.2 28.5 42.5 42.1 62.1 71.3 53.3 50.0
Poland 42.5 46.9 52.7 56.4 57.0 46.5 41.1 64.4 55.6 53.5
Romania 46.5 49.7 56.5 60.4 51.4 56.8 44.8 63.6 53.0 55.0
Taiwan 44.4 44.8 55.6 53.7 52.3 56.3 49.0 43.2 49.8 50.7
Other 37.1 37.8 48.4 38.1 49.2 35.4 30.6 61.1 62.9 46.2
All immigrants 44.9 48.9 54.1 51.3 53.3 56.0 52.7 52.6 52.7 53.1
Canada 31.1 31.6 37.7 NA
Note: PD, power distance; GE, gender egalitarianism; SA, status attribution. Low values for power distance, gender egalitarianism, status attribution as well as visible acculturation represent a greater degree of acculturation, i.e. lower scores represent cultural values more similar to those of Canadians, as well as lower scores represent better English proficiency, lower consumption of media and food from country of origin.
V.
Taras
et
al.
Table 3. Correlation matrix and reliabilities.
1 2 3 4 5 6 7 8 9 10 11
1 Power distancea (0.71) 0.34 0.38 0.05 0.09
2 Gender egalitarianisma 0.37 (0.82) 0.35 0.08 0.24
3 Status attributiona 0.34 0.32 (0.68) 0.03 0.16
4 Student status (student¼1)b 0.05 20.01 20.04 20.02
5 Gender (male¼1)b 0.02 0.15 0.05 20.01
6 Time in Canada 20.22 20.27 20.15 20.17 20.06
7 Education in country of origin 0.19 0.30 0.23 20.12 20.12 20.50
8 Education in Canada 20.28 20.38 20.27 0.07 20.07 0.58 20.71
9 Visible acculturation indexa 0.24 0.23 0.19 20.04 0.05 20.29 0.23 20.28 (0.62) 10 Contact frequency 20.22 20.26 20.23 20.01 20.04 0.29 20.24 0.27 20.27
11 Age at immigration 0.12 0.19 0.14 20.26 0.12 20.40 0.62 20.59 0.24 20.23
12 Immigrant network sizec 0.04 0.15 0.06
20.05 0.07 20.05 0.06 20.05 0.02 20.07 0.17
Note: Reliabilities, when applicable, are provided in parenthesis on the diagonal, derived using immigrant subsample only.
All correlations above^0.05 are significant at 95% confidence level; all correlations above^0.07 are significant at 99% confidence level. Correlations below the diagonal are for immigrant sub-sample only, correlations above the diagonal are for the Canadian-born sample only. a
Lower values for power distance, gender egalitarianism, status attribution as well as visible acculturation index represent a greater degree of acculturation, i.e. lower scores represent cultural values more similar to those of Canadians, as well as lower scores represent better English proficiency, lower consumption of media and food from country of origin. b
For student status and gender, both dichotomous variables, the reported values are point-biserial correlation coefficients. c
Immigrant network size used as Level-2 variable in HLM analysis; the coefficient provided here is a simple uni-level correlation coefficient.
Internati
onal
Journa
l
of
Huma
n
Resour
ce
Managem
ent
Table 4. The results of the HLM regression.
PDa SAa GEa
0 1 2 3 4 0 1 2 3 4 0 1 2 3 4
Intercept 44.4 42.9 43.9 44.0 44.3 53.6 53.5 54.1 54.2 54.6 45.9 43.1 44.8 45.0 45.4
Controls
Studentb 2.1 2.9 2.25 1.99 21.94* 20.62 21.52* 21.74* 20.05 1.71 0.43 0.25
Genderc 0.80 20.02 20.04 20.10 1.49 0.51 0.73 0.66 6.36** 4.39** 4.65** 4.51**
Level 1 Predictors
Years in Canada (T) 20.05 0.67* 0.46* 0.11 0.51 0.36 20.07 0.68* 0.63
Visible acculturationa 0.26** 0.23** 0.22** 0.18** 0.15** 0.14** 0.25** 0.21* 0.19*
Education home, years 0.06 0.05 0.06 0.23 0.34* 0.33* 0.31 0.47** 0.47**
Education host, years 21.08** 21.16** 20.17** 20.84** 20.90** 20.91** 21.79** 21.85** 21.90**
Level 1 Moderators
Contact frequency (C) 20.03 20.03 20.06** 20.06** 20.06* 20.06*
Interaction (TxC) 20.01** 20.01** 20.01* 20.01* 20.01** 20.01**
Age at immigration (A) 20.09 20.10* 20.14** 20.14** 20.21 20.19
Interaction (TxA) 20.01 20.01 20.01 20.01 20.01 20.01
Level 2 Moderators
Immigrant group size 0.01** 0.01** 0.01**
Variance component,t00 15 15 7.2 8.3 11.9 10.94 11.9 11.3 10.8 11.9 33.6 32.7 26.6 27.3 29.4
Variance component,d2 302 302 273 266 261 238 237 218 212 206 489 480 408 394 392
r2 0.00 0.10 0.12 0.14 0.00 0.07 0.09 0.11 0.03 0.27 0.31 0.32
Change inr2 0.10 0.02 0.02 0.07 0.02 0.02 0.24 0.04 0.01
N¼1713
** Statistically significant atp,0.01 level * Statistically significant atp,0.05 level Allr2and Change inr2significant at 95% level
aPower distance, status attribution, gender egalitarianism, visible acculturation:lowscore represent more acculturation. b
Student: student¼1, non-student¼0. cGender: female¼0; male¼1.
V.
Taras
et
al.
the length of residence in the host country, age at immigration, education obtained in the country of origin and host country, visible acculturation, contact frequency with locals. Table 4 reports the HLM regression results with robust standard error estimates and thus the report provides conservative estimates of statistical significance. We provide the results for power distance first, followed by a summary of the results for status attribution and gender egalitarianism.
Our hypotheses predict that both individual and immigrant network characteristics would have a significant effect on value acculturation. The zero model in Table 4 (Equation 1), which essentially is a one-way ANOVA with random effects, tests whether the intercepts vary significantly across immigrant subsamples.b0is the intercept andris
the individual-level variance component andg00andu0are the intercept and the
group-level variance component. The error terms are assumed to be normally distributed with means of zero and variancess2andt00, respectively.
Level-1:PD¼b0þr Level-2:b0 ¼g00þu0
ð1Þ
The results show that the estimated value of the variance componentt00is significantly
greater than zero, confirming a significant variation in power distance scores across immigrant groups and providing a basis for further analyses. That the variance component is significant indicates that immigrant group characteristics moderate acculturation pace and warranting a second-level moderator analysis. The results for status attribution and gender egalitarianism are similar. The variance within- and between-group components is significant for both dimensions providing the basis for further analysis and suggesting existence of individual- and group-level moderators.
Model 1 (Equation 2) includes only the control variables: student status and gender. The results show that student status and gender have no significant effect on acculturation along any of the three cultural value dimensions, with an exception of highly significant effect of gender on internalization of gender egalitarianism values (Table 4). Although we did not hypothesize that women adopt gender egalitarianism values faster than men do, our empirical finding strongly suggest that this is the case.
Level-1:PD¼b0þb1ðgenderÞ þb2ðstudent statusÞ þr Level-2:b0 ¼g00þu0
b1¼g10
b2¼g20
ð2Þ
By comparing the output from Models 0 and 1, we can calculate a measure similar to
R2used in OLS (Equation 3). In our case, however, the coefficient represents not the total amount of variance accounted for by the model, but the percentage of variance accounted for by the additionally included Level-1 predictors.
R2¼d
2
ANOVA2d 2
Fixed_Slopes
d2ANOV ð3Þ
control variables, in particular gender, explain an additional 3% of variance in the data compared to the ANOVA model.
Model 2 adds predictors of acculturation, namely length of residence in Canada, visible acculturation, education attained in the country of origin and education attained in Canada. As expected, immigrants who are more visibly acculturated tend to have values that are closer to those of the locals. Also, supporting the proposition that education has a value indoctrinating effect, more education in the host country is associated with a smaller value differences between immigrants and locals. In contrast, more education in the country of origin is associated with a greater value difference, though the relationship is significant only for status attribution and gender egalitarianism and varies depending on the model specification.
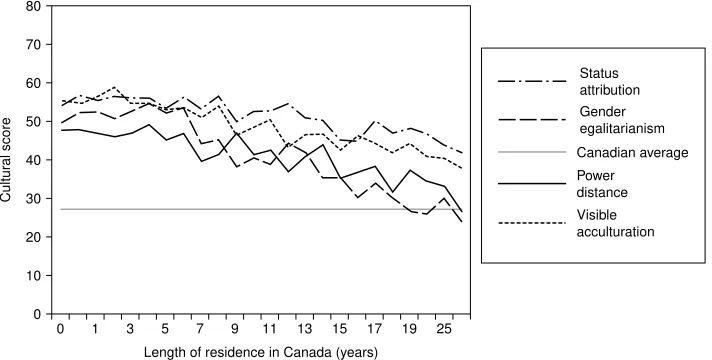
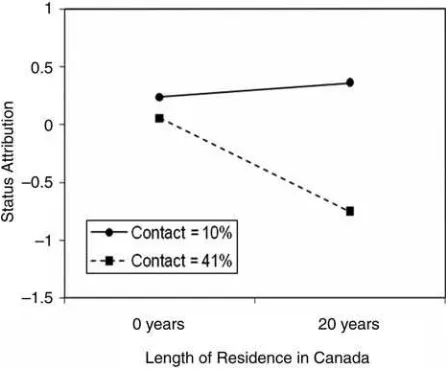
As for the direct effect of time, the results are mixed. The bivariate correlations between length of residence and cultural values and artifacts are mostly significant (Table 3), and Figure 1 shows that immigrants do acculturate over time. However, the change is rather slow and assimilation is not complete even after two decades. Furthermore, the HLM regression coefficients are mostly insignificant or with a counter-hypothesized sign (Table 4). These inconsistencies are reconciled by the results from Models 3 and 4, which add individual- and group-level moderators. Model 3 tests the moderating roles of age at immigration and frequency of contact with locals. The results provide a consistent support for the proposition that immigrants who have more frequent contact with locals acculturate faster than those whose contacts with locals are limited. The moderating effect is so strong that it can reverse the direction of acculturation. The breaking point is roughly at 15%, meaning that if locals constitute less than 15% of the people the immigrants contact with on a regular basis, the person is likely to display negative acculturation. As Figure 2 shows, an immigrant in whose personal network locals constitute about 40% is likely to change his or her values toward those of locals by about 1 standard deviation over a course of two decades. In contrast, if locals constitute only 10% of an immigrant’s network, more time spent in the host country may actually mean negative acculturation and a rejection of values of the host country.
The results of moderator analysis failed to provide statistically significant support for the moderating effect of the age at immigration. Even though the direction of the
80
Length of residence in Canada (years)
relationship was consistently in the predicted direction, the regression coefficients failed to achieve robust statistical significance indicating that even though younger immigrants are likely to acculturate faster the moderating effect of the age at immigration may be trivial. Finally, the results revealed a critical moderating effect of the environment on acculturation. The size of the immigrant group added in Model 4 was significant for all three dimensions. Equation 4 details how this Level-2 moderator effect was tested.
Level-1:PD¼b0þb1ðgenderÞ þb2ðstudentÞ þb3ðtime in CanadaÞ þb4 ðvisible acculturationÞ þb5ðeducation in country of originÞ þb6
ðeducation in host countryÞ þb7ðcontact frequencyÞ þb8
ðtime*contact frequencyÞ þb
9ðage at Im migrationÞ þb10
ðtime*age at Im migrationÞ þr
Level-2:b0¼g00þu0
b1¼g10
b2¼g20
b3¼g30þg31ðImmigrant group sizeÞ þu0
b4¼g40
b5¼g50
b6¼g60
b7¼g70
b8¼g80
b9¼g90
b10 ¼g100
ð4Þ
The findings strongly suggest that immigrants from underrepresented countries acculturate faster, while immigrants who have ample opportunities to socialize with their
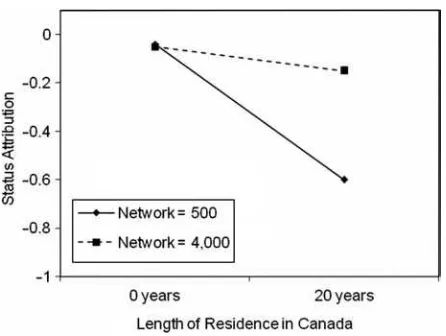
countrymen acculturate slower. Figure 3 graphically represents the moderating role of immigrant network size on acculturation pace. For example, immigrants from countries represented by about 500 individuals, such as Romania or Poland in the case of our data collection city, are likely to substantially change their values toward those of locals, roughly a 0.8 standard deviation change over a course of 20 years. In contrast, immigrants from regions that are represented by about 4000 individuals in their community, as for example India or Latin America in the case of our data collection city, are likely to display a much slower pace of acculturation, only about 0.2 standard deviations over the same period.
Discussion
The effects of cultural differences on individual behaviors and perceptions in the workplace have been well documented, showing the need for a culturally sensitive approach in the diverse workplace (Taras et al. 2010a). The effects of culture have been traditionally studied in cross-national context with comparisons made across countries. Several large-scale culture comparison projects (e.g. Hofstede 1980; Schwartz 1992; House et al. 2004) have mapped cultural regions of the world and it is fairly well-known what management practices are most suitable for different countries. However, little research has been devoted to studying cultural values of immigrants who constitute a substantial part of the labor force and consumer base in most industrialized countries. Although numerous studies addressed issues of acculturation, most acculturation research, unfortunately, explored cultural change exclusively at the level of cultural artifacts, such as changes in language proficiency, clothing style and cuisine tastes. While these are important elements of culture, they have no established effect on individual behavior in the workplace, which limits the value of this research for managers.
The present study is among the first to address acculturation at both the artifact and the value levels. Although cultural values are of primary interest in business research as values largely determine workplace attitudes and behaviors, knowing the relationship between cultural artifacts and values allows for a better understanding of how much visible acculturation can explain acculturation of tacit cultural values. Next, although not longitudinal per se, our cross-sectional research design incorporated the length of residence in the host country providing a segue from research on static cross-national Figure 3. Moderating effect of network size on acculturation over time along the status attribution dimension.
cultural value differences to cultural value dynamics. Furthermore, we explored the effects of a number of individual- and group-level predictors and moderators of acculturation pace and direction, including age at immigration, education in home and host countries, gender as well as such critical and underexplored moderators as contact frequency between immigrant and local employees and environment characteristics, namely the size of the immigrant compatriot group.
As expected, our results indicate that individual cultural values are changing over time as one is exposed to a foreign culture. However, value acculturation is fairly slow with the change being close to negligible in the first 10 years. This suggests that culturally sensitive practices are necessary even if immigrant employees, customers or business partners relocated to the host country a significant time ago.
Our findings support a positive relationship between visible artifact and tacit value acculturation. However, the accuracy and validity of judgments about value acculturation based solely on visible artifact acculturation is limited as the latter explains only up to 4% of variation in the former. Thus, if an immigrant becomes fluent in local language, develops taste to local food, music and clothing style and prefers local media, it suggests but does not ensure that the person’s cultural values have changed too. This implies that questionnaire- or interview-based assessment of cultural values of immigrant employees is needed, as judgments about values based on observable artifacts may lead to wrong conclusions and undermine efforts of developing business practices that match cultural values of employees.
The findings for the effect of time on acculturation are not uniform. A number of moderating factors may not only speed up or slow down but even reverse the direction of value acculturation. First, the analysis revealed an indoctrinating effect of education. Education received in the country of origin was found to slow down acculturation, while education received in the host country was found to speed up acculturation. However, the effects of the two are not necessarily inverse. The effect of education in the host country is stronger and is a very good predictor of the extent of acculturation, while the effect of education of the country of origin is limited so more education prior to immigration does not always mean less acculturation.
Furthermore, our results showed that interaction with locals speeds up acculturation. Conversely, a lack of contacts with the host culture may not only slow down the integration process, but even reverse it. Specifically, immigrants in whose networks locals constitute less than roughly 15% are likely to show negative acculturation over time. While many would expect that most immigrants interact with locals more than that, in our particular sample over 20% of the respondents fall into this category and thus are likely to never assimilate and possibly eventually reject the host-country values. The finding at least partially explains the host-culture-rejection phenomenon and has huge implications for managers and immigration policy makers. Essentially, it highlights the danger of ethnic segregation, be it in the workplace norms or residential ghettoes.
effect. It appears that even if contacts with locals are frequent, a large immigrant network creates enough drag in the form of reminders of the home culture through ethnic restaurants, shops, religious institutions and clubs that slows down acculturation pace.
Implications
The results of the study provide a basis for a more accurate estimate of cultural values of immigrant employees, customer or business partners and would be of interest for managers and policy makers. Our findings could aid selection and development of immigrant settlement and adaptation programs, both at the organization and national levels. For instance, if assimilation is desired, immigrant selection system should favor applicants from underrepresented countries and those who are expected to pursue a degree in the host country and more likely to interact with locals. Furthermore, work design and personnel development programs that promote inter-ethnic contact and policies that encourage formal education in host country and settlement away from centers with high concentration of immigrants from the same country all are likely to aid acculturation.
However, in rare cases, assimilation may not be desired as ‘going native’ can have a negative impact on performance. Research has shown that cultural value differences can prevent group think and aid creativity, innovation and performance (Stahl, Maznevski, Voigt and Jonsen 2009). Furthermore, as expatriates set an example and spread practices of the headquarters, they are often used for indirect control in overseas offices (Harzing 2001). As this control system depends on a close alignment of expatriates’ values with those of their parent company, cultural value retention, as opposed to acculturation, may be sought. Additionally, it has been suggested that immigrants who retain their cultural values longer are more likely to be agents of trade between their home and host countries, thereby facilitating international corporation and trade (Ghorbani 2008). Thus, if acculturation is not desired, selecting individuals with more education from their country of origin and limiting their unessential contact – fraternization – with locals and education in the host country may be used to slow down the acculturation pace. It may also be advised to send expatriates in groups so that they can socialize with their countrymen and not feel social contact deprivation without interacting with the locals.
Limitations and future research directions
We could not consider all relevant issues within the frames of a single study and a number of questions remained unanswered. Although time was incorporated in our analysis, our research design was cross-sectional. A longitudinal design would be preferable, but it would take decades to replicate the same time span and this would be a task for future research. Next, there is a possibility of a selection bias in our sample. For example, the findings for the effect of the ethnic community size may be contaminated by the selective settlement bias. It is possible that immigrants whose values closely resemble those that are dominant in their country of origin choose to settle in areas where their ethnic communities are large, while those whose values differ choose areas where their country of origin is underrepresented. Thus, it may not be the size of the ethnic community that moderates acculturation pace, but the difference in values may determine the community size. More refined tests may be needed to establish casualty and test these competing propositions. Also, our study omitted a number of potentially relevant variables. For example, acculturation patterns may differ depending on whether the culture of the host society is tight or loose (Gelfand, Nishii and Raver 2006). It has been suggested that
individuals from tight cultures may acculturate faster in loose cultures, while those from loose cultures may be slower to internalize values of culturally tight societies (Murphy and Anderson 2003). Because our study was conducted only in one country, we could not test the moderating effect of cultural looseness/tightness. Along the same lines, it could be suggested that perceptions about national superiority/inferiority can moderate accultura-tion. An immigrant from a country that is perceived as less developed who moved to a country that is perceived as a more desirable place to live may try much harder to assimilate than someone who is moving in the opposite direction. Finally, we cannot be unequivocally certain that the cultural change observed in our immigrant sample reflects acculturation toward Canadian values. It is possible that the value shift is a result of maturation, home-country separation, change in social status or income level or a larger cultural shift in a society as a whole in response to economic or political environment changes. These are classic problems associated with a cohort design. A study with a true longitudinal design would be needed to address these important questions.
Furthermore, future research may explore the differences in acculturation patterns in short-term expatiates versus permanent immigrants and issues of re-acculturation of repatriates. Finally, acculturation is a two-way process that affects both immigrants and locals. In theory, interaction affects not only the minority but also the majority. Although acculturation of the minorities toward the dominant group’s values is likely to be occurring faster than vice versa, the minority’s influence on the ‘old’ ethnic group may also be substantial and future research may want to explore this issue.
References
Allport, G.W. (1954),The Nature of Prejudice, Cambridge, MA: Addison-Wesley. Axelrod, R.M. (1984),The Evolution of Cooperation, New York: Basic Books.
Baumeister, R.F., and Leary, M.R. (1995), ‘The Need to Belong: Desire for Interpersonal Attachments as a Fundamental Human Motivation,’Psychological Bulletin, 117, 497 – 529. Berry, J.W. (2003), ‘Conceptual Approaches to Acculturation,’ in Acculturation: Advances in
Theory, Measurement and Applied Research, eds. K.M. Chun and P.B. Organista, Washington, DC: APA, pp. 17 – 37.
Black, J.S., and Mendenhall, M. (1991), ‘The U-Curve Adjustment Hypothesis Revisited: A Review and Theoretical Framework,’Journal of International Business Studies, 22, 225 – 247. Brandtstaedter, J., and Greve, W. (1994), ‘The Aging Self: Stabilizing and Protective Processes,’
Developmental Review, 14, 52 – 80.
Buss, D.M. (1990), ‘The Evolution of Anxiety and Social Exclusion,’Journal of Social and Clinical Psychology, 9, 196 – 201.
Cook, T.D., and Campbell, D.T. (1979),Quasi-Experimentation: Design and Analysis Issues for Field Settings, Boston, MA: Houghton Miffin Company.
Cheng, K. (1998), ‘Can Education Values be Borrowed? Looking Into Cultural Differences,’
Peabody Journal of Education, 73, 11 – 30.
Chiang, F. (2005), ‘A Critical Examination of Hoftede’s Thesis and Its Application to International Reward Management,’International Journal of Human Resource Management, 16, 1545 – 1563. Doidge, N. (2007),The Brain That Changes Itself: Stories of Personal Triumph From the Frontiers
of Brain Science, London: Penguin Books.
Gelfand, M.J., Nishii, L.H., and Raver, J.L. (2006), ‘On the Nature and Importance of Cultural Tightness-Looseness,’Journal of Applied Psychology, 91, 1225 – 1244.
Ghorbani, M. (2008), ‘Immigrant Effect in Melting Pot and Multicultural Societies: A Comparison Between the US and Canada,’ Paper presented at the Academy of International Business Annual Meeting.
Harzing, A.W.K. (2001), ‘Of Bears, Bumble-Bees, and Spiders: The Role of Expatriates in Controlling Foreign Subsidiaries,’Journal of World Business, 36, 366 – 380.
House, R.J., Hanges, P.J., Javidan, M., Dorfman, P.W., and Gupta, V. (eds.) (2004), Culture, Leadership, and Organizations: The GLOBE Study of 62 Societies, Thousand Oaks, CA: Sage Publications.
Jackson, J.W. (1993), ‘Contact Theory of Intergroup Hostility: A Review and Evaluation of the Theoretical and Empirical Literature,’International Journal of Group Tensions, 23, 43 – 65. Maseland, R., and van Hoorn, A. (2008), ‘Explaining the Negative Correlation Between Values and
Practices: A Note on the Hofstede – GLOBE Debate,’Journal of International Business Studies, 40, 527 – 532.
Maznevski, M.L., DiStefano, J.J., Gomez, C., Noorderhaven, N.G., and Wu, P.-C. (2002), ‘Cultural Dimensions at the Individual Level of Analysis: The Cultural Orientation Framework,’
International Journal of Cross-Cultural Management, 2, 275 – 295.
Murphy, E.F., and Anderson, T.L. (2003), ‘A Longitudinal Study Exploring Value Changes During the Cultural Assimilation of Japanese Student Pilot Sojourners in the United States,’
International Journal of Value-Based Management, 16, 111 – 129.
Ouarasse, O.A., and van de Vijver, F.J. (2005), ‘The Role of Demographic Variables and Acculturation Attitudes in Predicting Sociocultural and Psychological Adaptation in Moroccans in the Netherlands,’International Journal of Intercultural Relations, 29, 251 – 272.
Pekerti, A.A., and Sendjaya, S. (2010), ‘Exploring Servant Leadership Across Cultures: Comparative Study in Australia and Indonesia,’The International Journal of Human Resource Management, 21, 754 – 780.
Powell, J.W. (1881), ‘Annual Report of the Bureau of Ethnology to the Secretary of the Smithsonian Institution,’US Bureau of American Ethnography, 1, 1 – 603.
Redfield, R., Linton, R., and Herskovits, M. (1936), ‘Memorandum on the Study of Acculturation,’
American Anthropologist, 38, 149 – 152.
Rokeach, M. (1973),The Nature of Human Values, New York: Free Press.
Rudmin, F.W. (2009), ‘Constructs, Measurements and Models of Acculturation and Acculturative Stress,’International Journal of Intercultural Relations, 33, 106 – 123.
Schein, E.H. (1967), ‘Attitude Change During Management Education,’Administrative Science Quarterly, 11, 601 – 628.
Schwartz, S.H. (1992), ‘Universals in the Content and Structure of Values: Theoretical Advances and Empirical Tests in 20 Countries,’ in Advances in Experimental Social Psychology, ed. M.P. Zanna, San Diego, CA: Academic Press, pp. 1 – 65.
Stahl, G.K., Maznevski, M.L., Voigt, A., and Jonsen, K. (2009), ‘Unraveling the Effects of Cultural Diversity in Teams: A Meta-Analysis of Research on Multicultural Work Groups,’Journal of International Business Studies, 40, 1 – 20.
Steel, P., and Taras, V. (2010), ‘Culture as a Consequence: A Multilevel Multivariate Meta-Analysis of the Effects of Individual and Country Characteristics on Work-Related Cultural Values,’
Journal of International Management, 16, 211 – 233.
Taras, V. (2009a), ‘Acculturation Survey Catalogue: Original Items, Scoring Keys and Psychometric Properties of 53 Instruments for Measuring Acculturation,’ http://vtaras.com/files/ Acculturation_Survey_Catalogue.pdf (accessed 25 December, 2008).
Taras, V. (2009b), ‘Catalogue of Instruments for Measuring Culture,’ http://vtaras.com/files/ Culture_Survey_Catalogue.pdf (accessed 1 January, 2009).
Taras, V., Kirkman, B.L., and Steel, P. (2010a), ‘Examining the Impact of Culture’s Consequences: A Three-Decade, Multi-Level, Meta-Analytic Review of Hofstede’s Cultural Value Dimensions,’Journal of Applied Psychology, 95, 405 – 439.
Taras, V., Rowney, J., and Steel, P. (2009), ‘Half a Century of Measuring Culture: Approaches, Challenges, Limitations, and Suggestions Based on the Analysis of 112 Instruments for Quantifying Culture,’Journal of International Management, 15, 357 – 373.
Taras, V., and Steel, P. (2009), ‘Beyond Hofstede: Challenging the Ten Testaments of Cross-Cultural Research,’ in Beyond Hofstede: Culture Frameworks for Global Marketing and Management, ed. C. Nakata, Chicago, IL: Macmillan/Palgrave, pp. 40 – 61.
Taras, V., Steel, P., and Kirkman, B.L. (2010b), ‘Negative Practice – Value Correlations in the GLOBE Data: Unexpected Findings, Questionnaire Limitations and Research Directions,’
Journal of International Business Studies, 41, 1330 – 1338.
Taras, V., Steel, P., and Kirkman, B.L. (2011), ‘Improving National Cultural Indices Using a Longitudinal Meta-Analysis of Hofstede’s Dimensions,’ Journal of World Business, doi: 10.1016/j.jwb.2011.05.001, in press.
Tayeb, M. (1998), ‘Transfer of HRM Practices Across Cultures: An American Company in Scotland,’International Journal of Human Resource Management, 9, 332 – 358.
Trompenaars, F. (1993),Riding the Waves of Culture: Understanding Diversity in Global Business, Chicago, IL: Irwin Professional Publishing.
Westhuizen, D., Pacheco, G., and Webber, D.J. (2011), ‘Culture, Participative Decision Making and Job Satisfaction,’The International Journal of Human Resource Management, 1, 1 – 19. Yeganeh, H., and Su, Z. (2011), ‘The Effects of Cultural Orientations on Preferred Compensation