SEMINAR AND EXAMINATION
MSc in Information Technology for Natural Resource Management Bogor Agricultural University
Name : Candra Dewi
Student ID : G051060021
Research Tittle : Spatial Multi Criteria Analysis for Mud Volcano Vulnerable Area in Sidoarjo Regency, East Java Province
The Advisory Board
Supervisor : Dr. Ir. I Wayan Astika, M.Si Co-Supervisor : Dr. Gatot H. Pramono, M.Sc
External Examiner : Prof. Dr. Ir. Kudang Boro Seminar, M.Sc
Day/Date : Friday/ August 1, 2008
Time : 14.30 – 16.30
Location : Class Room A, MIT Building – SEAMEO BIOTROP
STATEMENT
Hereby I, Candra Dewi, do declare that this thesis entitled “Spatial Multi Criteria Analysis for Detecting Mud Volcano Vulnerable Area in Sidoarjo Regency, East Java Province” is my own work and has not been submitted in any form for another degree or diploma programs (course) to any University or other institution. The content of the thesis has been examined by the advising committee and the external examiner.
Bogor, August 2008
ABSTRACT
CANDRA DEWI (2008). Spatial Multi-criteria Analysis for Detecting Mud Volcano Vulnerable Area in Sidoarjo Regency, East Java Province. Under the supervision of I WAYAN ASTIKA and GATOT H. PRAMONO.
Managing an area for further planning requires information on risk level of area from natural hazard. Since May 29th 2006, a sea of hot mud has been gushing from the ground in Sidoarjo, East Java which caused economic, social, health and environmental impacts. Determining vulnerable area of hot mud volcano is important to provide information on the extent of the areas affected by the hazard. Vulnerability analysis requires set of factors determining dangerous level of particular area from a defined hazard source. Vulnerability analysis for natural hazard also deals with vagueness arising from expert judgment on related parameters.
The objectives of this research were to develop multi-criteria evaluation method using fuzzy analysis approach for mud volcano vulnerable area and to develop mud volcano vulnerable map using proposed method. This research handles imprecision and subjectiveness involved in expert knowledge by using Fuzzy Analytical Hierarchy Process (AHP). The alpha cut analysis and lambda function was performed in Fuzzy AHP process to assess the confidence level of experts about their preference.
The method was then applied to generate mud volcano vulnerability for settlement area in Sidoarjo. The criteria used in the evaluation consist of subsidence, bubble gases, mud flooded and water quality. The experts that give their judgment in form of Pairwise Comparison Matrix (PCM) represent all elements of the society such as The National Sidoarjo Mudflow Mitigation Team (BPLS), Settlement Agency of Sidoarjo, Centre of Environmental Geology, academic disaster researchers and the public as a victim of Lapindo mud. Having established Fuzzy AHP to obtain criterion performance, the spatial analysis was done by applying this performance to criterion layer to create vulnerability area. The sensitivity analysis of the method was analyzed by using alpha cut (values 0.4, 0.6 and 0.8) and lambda function (values 0, 0.5 and 1). Performing these alpha cut and lambda value showed the highest sensitivity could be observed at alpha 0.4 and lambda 0.
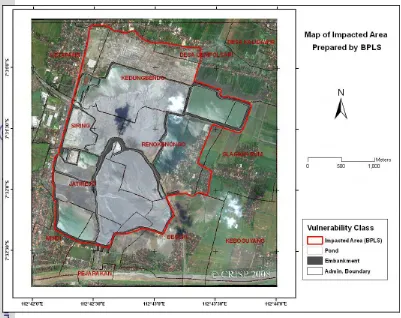
The comparison of vulnerability map resulted from applying Fuzzy AHP method at 100% confidence level with impacted area prepared by BPLS showed that these two maps have different class of vulnerability. The result of multi-criteria analysis showed that settlement areas located in impacted area were mostly categorized as high and moderate vulnerable class, while impacted area prepared by BPLS was categorized as high hazardous area. However, the surface area of the merged class Z1 and Z2 from vulnerability analysis covered area was almost same with impacted area prepared by BPLS.
SUMMARY
CANDRA DEWI (2008). Spatial Multi Criteria Analysis for Detecting Mud Volcano Vulnerable Area in Sidoarjo Regency, East Java Province. Under the supervision of I WAYAN ASTIKA and GATOT H. PRAMONO.
Managing an area for further planning require information about risk level of the area from natural hazard. Since May 29th 2006, a sea of hot mud has been gushing from the ground in Sidoarjo, East Java that caused several economic, social, health and environmental impacts. Determining vulnerable areas of mud volcano are important for the government of Sidoarjo to provide information about the extent of the areas affected by the hazard and the areas that still potential to be further developed to reduce the impact of hazards.
Vulnerability analysis requires set of factors determining dangerous level of particular area from a defined hazard source. Vulnerability analysis for natural hazard also deals with vagueness arising from expert judgment on related parameters. The objectives of this research were to develop multi criteria evaluation method using fuzzy analysis approach for mud volcano vulnerable area and to develop mud volcano vulnerable map using proposed method. This research handles imprecision and subjectiveness involved in expert knowledge by using Fuzzy Analytical Hierarchy Process (AHP). The alpha cut analysis and lambda function is performed in Fuzzy AHP process to assess the confidence level of experts about their preference
Determining criteria for mud volcano vulnerable analysis was done by examining a relevant literature, interview and discussion with some expert from several institutions. A number of physical criteria used in evaluation were identified based on the impact of hazard in a surface. These criteria consist of subsidence, bubbles gases, mud flooded area and water quality, while bubble gases consist of methane, hydrogen sulfide and carbon dioxide.
Defining class boundaries of the criteria require expert knowledge. The importance of one criterion to the other criterion in Pairwise Comparison Matrix is obtained from expert judgment. The experts who gave their judgment represent all elements of the society such as The National Sidoarjo Mudflow Mitigation Team (BPLS), Settlement Agency of Sidoarjo, Centre of Environmental Geology, academic disaster researchers and the public as a victim of Lapindo mud.This crisp PCM is used as an input of vulnerability assessment using Fuzzy AHP approach.
PCM from AHP was fuzzified to get the Fuzzy PCM by using triangular membership which has three values (Lower, Middle, and Upper). This fuzzification is performed over criteria weight matrix and criterion rating matrices within the values ranging from 1/9 to 9. Fuzzy extent analysis then was applied on fuzzy PCM to obtain the fuzzy performance rating of each alternative with respect to all criteria and fuzzy weight. A fuzzy weighted performance then was obtained by multiplying the fuzzy weight with the fuzzy performance.
confidence about the preference or judgment that has been made. Applying the α -cut lower than 1 result the interval performances over the fuzzy weighted performance. The crisp performance from these intervals then was obtained by applying lambda function. Lambda function enables to include the decision maker or expert attitude about judgment has been made.
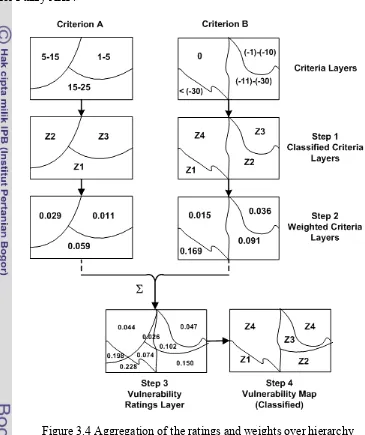
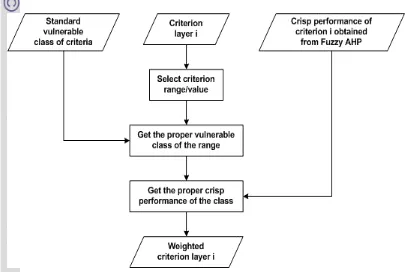
The crisp performance values of each criterion acquired from fuzzy AHP analysis were used to generate vulnerability map. Firstly, criteria layers are classified accordingly to the vulnerability class (Z1 – Z4). The next step is to apply crisp performance value that is acquired from fuzzy AHP process to each criterion map to obtain weighted criteria layers. After that, combines the weighted value of criterion map by summing up the crisp performance value of map layers. This will give the final result of vulnerability ratings at the final level. The final vulnerability ratings are then classified into final vulnerability map. The classification will be based on the value for Z1 – Z4 acquired from performances/weights calculation.
The method was applied to generate mud volcano vulnerability for settlement area in Sidoarjo by implementing spatial analysis. Based on vulnerability analysis at 100% confidence of expert, it was found that the high hazardous area (Z1) covers about 10.9% of the total settlement area, while 25% were considered as moderate hazardous area (Z2), 49.6% as low hazardous area (Z3) and 14.4 as not impacted area (Z4).
Sensitivity analysis is used to enlighten the effect of uncertainty in expert knowledge. The Fuzzy-AHP provides the sensitivity analysis that can be performed by changing in the values of the alpha (α) and lambda (λ). This research used alpha values 0, 0.6 and 0.8 to address the confidence of expert preference and lambda values 0, 0.5 and 1 to fit the attitude of the expert about their preference or judgment.
Based on vulnerability analysis at alpha 0.4 and lambda 0, the low hazardous class (Z3) covers 51.4% of the available settlement area, 37% of the area is categorized as high hazardous class (Z1), 8.2% of the area as moderate hazardous (Z2) and 3.4% of the area recognized as not impacted class (Z4). At alpha 0.4 and lambda 0.5, class Z3 decreases to 37% of the area although it still covers the largest area, class Z2 covers 36.1% of the total area, class Z4 covers 26.9% of the total area, while class Z1 is restricted, it does not occupy any area. At alpha 0.4 and lambda 1, the classes perform the same order as under λ = 0.5. Area with low hazardous class consist of 38.6% of the total area, followed by moderate hazardous covering 36.5% and not impacted class with 24.9% of the total area. The high hazardous area is not available under this lambda value.
Based on vulnerability analysis at alpha 0.8 and lambda 0, the low hazardous class covers 50% of the available area, 25% of the belongs to moderate hazardous class, 14.1% of area is categorized as not impacted class and 10.9% area is recognized as high hazardous class. At alpha 0.8 and lambda 0.5, class Z3 dominate with 50% of the total area and Z2 is restricted only to 32.7% of the area. Class Z4 cover 13.6% of the area and class Z1 only 3.6% of the area. At alpha 0.8 and lambda 1, 50.2% of the area belongs to moderate hazardous class, followed by class Z2 that covers 35.8% of the area and Z4 with 13.6%. The high hazardous area tightens to 0.4% of the area.
The sensitivity analysis at these alpha and lambda values mentioned above illustrate that the alpha cut shows the interval performance according to the vagueness of expert confidence, while the lambda can be used to measure the vagueness of expert knowledge at specific attitude value between these intervals. Performing the three scenarios shows that the highest sensitivity can be observed at alpha 0.4 and lambda 0. The class Z3 and Z4 are no more sensitive at optimum alpha value, while class Z2 is no more sensitive for λ≥ 0.5 at all alpha values. The choice of alpha 0.6 and 0.8 at λ≤ 0.5) illustrate the vulnerability area that is nearly the same, especially for lambda 0.
COPY RIGHT
Copy right ® 2008, Bogor Agricultural University Copy right are protected by law,
1. It is prohibited to cite all or part of this thesis without referring to and mentioning the source
a. Citation only permitted for the sake of education, research, scientific writing, report writing, critical writing or reviewing scientific problem.
b. Citation does not inflict the name and honor of Bogor Agricultural University.
SPATIAL MULTI CRITERIA ANALYSIS FOR
DETECTING MUD VOLCANO VULNERABLE AREA
IN SIDOARJO REGENCY, EAST JAVA PROVINCE
CANDRA DEWI
A Thesis submitted for the degree of Master of Science of Bogor Agricultural University
MASTER OF SCIENCE IN INFORMATION TECHNOLOGY
FOR NATURAL RESOURCE MANAGEMENT
GRADUATE SCHOOL
BOGOR AGRICULTURAL UNIVERSITY
BOGOR
Research Title : Spatial Multi Criteria Analysis for Detecting Mud Volcano Vulnerable Area in Sidoarjo Regency, East Java Province
Name : Candra Dewi
Student ID : G051060021
Study Program : Master of Science in Information Technology for Natural Resource Management
Approved by, Advisory Board
Dr. Ir. I Wayan Astika, M.Si Dr. Gatot H. Pramono
Supervisor Co-Supervisor
Endorsed by,
Program Coordinator Dean of the Graduate School
Dr. Ir. Hartrisari Hardjomidjojo, DEA Prof. Dr. Ir. Khairil A. Notodiputro, MS
ACKNOWLEDGEMENTS
First of all I would like to express my thanks and gratitude to Allah Swt, the Most Merciful whom granted my ability and willing to complete the thesis. My greatest thanks are also to my family for their love and support.
I wish to thank my supervisor Dr. Ir. I Wayan Astika, M.Agr and my co-supervisor Dr. Ir. Gatot H. Pramono, M.Sc. for their guidance, technical comments and constructive criticism through all month of my research.
I would like to thank to Dr. Ir. Hartrisari Hardjomidjojo, DEA as Program Coordinator and Prof. Dr. Ir. Kudang Boro Seminar as the external examiner of this thesis for their positive ideas and inputs. I would like to thank to Brawijaya University especially Mathematic Department for granting me fellowship to study in MSc in IT for NRM, Biotrop, IPB, Bogor, Indonesia.
My truthful thank to Mr. Handoko and the other BPLS personnel, Centre of Environmental Geology staff, Mr. Amien Widodo and Mr. Yahya for supporting my thesis. Without their support, this research would not be possible.
I would like to thank to SEAMEO-BIOTROP management and staff, and also IPB Postgraduate directorate that support our administration, technical, and facility. I would like to thank to all the member of lecturers who taught me the very importance knowledge for my future.
CURRICULUM VITAE
Candra Dewi was born in Tulungagung, East Java, Indonesia on November 14, 1977. She finished her Elementary, Junior, and High school in Government School, Tulungagung. She received her undergraduate diploma from Sepuluh Nopember Technology Institute, Faculty of Industrial Technology in field of Informatics in 2001. Since 2004 to present, she has been working as lecturer in Computer Science Study Program, Department of Mathematics, Faculty of Mathematics and Natural Science, Brawijaya University of Malang.
TABLE OF CONTENT
Page
STATEMENT ... i
ABSTRACT... ii
SUMMARY ... iii
COPY RIGHT... vi
ACKNOWLEDGEMENTS ... ix
CURRICULUM VITAE ... x
TABLE OF CONTENT ... xi
LIST OF FIGURE... xiv
LIST OF TABLE ... xvi
LIST OF APPENDIX ... xviii
I. INTRODUCTION ... 1
1.1 Background ... 1
1.2 Research Objective... 4
1.3 Research Question... 4
1.4 Scope of the Research ... 5
1.5 Research Output ... 5
II. LITERATURE REVIEW... 7
2.1 Natural Hazard Assessment ... 7
2.1.1 Mud Volcanoes in East Java, Indonesia... 7
2.1.2 Volcano Hazard Assessment... 9
2.2 Vulnerability Assessment ... 9
2.4 Use of GIS In Natural Hazard Assessments ... 16
2.5 Multi-criteria Decision Analysis (MCDA) ... 18
2.6 Spatial Multi-Criteria Decision Making... 19
2.7 Analytical Hierarchy Process... 21
2.8 Fuzzy Logic in Decision Making... 24
2.9 Fuzzy AHP ... 25
2.10 Previous Related-Research... 26
III. METHODOLOGY... 29
3.1 Time and Location ... 29
3.1.1 General Overview of Study Area... 29
3.1.2 Geological Condition ... 30
3.1.3 Climatology... 30
3.1.4 Demography... 31
3.2 Required Tools ... 31
3.3 Framework of Vulnerability Analysis... 32
3.3.1 Identification of Evaluation Criteria ... 33
3.3.2 Hierarchical Structure of The Criteria... 35
3.4 Data Preparation... 35
3.4.1 Data Collection ... 35
3.4.2 Generating Criterion Map ... 36
3.5 Multi-criteria Evaluation... 36
3.5.1 Normal Pairwise Comparison Matrices ... 36
3.5.2 Fuzzy AHP ... 38
3.6 Generating Vulnerability Map ... 44
3.7 Sensitivity Analysis... 46
3.8 Map Comparison... 46
IV. RESULT AND DISCUSSION ... 48
4.1 Evaluation Criteria ... 48
4.2 Hierarchical Structure of The Criteria... 57
4.3 Criterion Map ... 58
4.4 Crisp Pairwise Comparison Matrix... 65
4.5 Fuzzy AHP Approach in Vulnerability Analysis... 67
4.6 Vulnerability Map ... 70
4.7 Sensitivity Analysis... 73
4.8 Comparative Evaluation... 81
V. CONCLUSIONS AND RECOMMENDATIONS ... 84
5.1 Conclusions ... 84
5.2 Recommendations ... 85
REFERENCES... 87
LIST OF FIGURE
Page
Figure 2.1 The continuous mudflow has submerged various villages ... 8
Figure 2.2 The suggested task of vulnerability analysis to identify vulnerable people and property ... 10
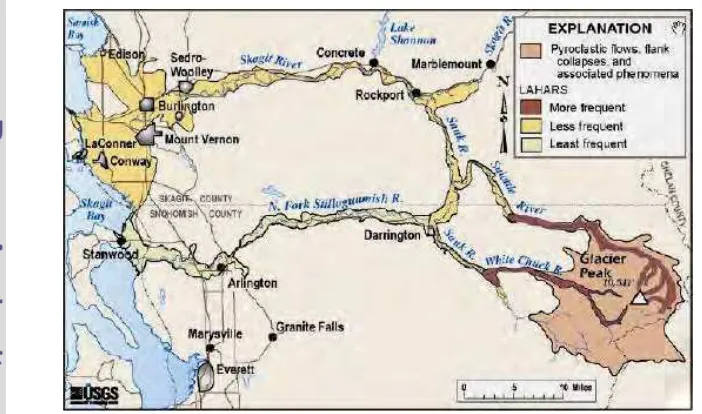
Figure 2.3 Volcanic hazard zone map... 16
Figure 2.4 General schema of discrete (a) and continuous (b)multi-criteria methods ... 18
Figure 2.5 Loose (a) and tight (b) multi-criteria spatial DSS coupling strategies 21 Figure 3.1 The study areas in Sidoarjo, East Java... 29
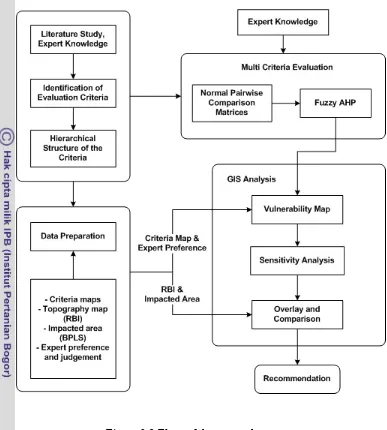
Figure 3.2 Flow of the research process... 33
Figure 3.3 Fuzzy AHP steps for vulnerability Analysis ... 39
Figure 3.4 Aggregation of the ratings and weights over hierarchy... 44
Figure 3.5 The process to generate weighted criterion layer ... 45
Figure 3.6 Map of impacted area prepared by BPLS... 47
Figure 4.1 Hierarchical structure of the criteria ... 58
Figure 4.2 Subsidence criterion map... 59
Figure 4.3 The plotting of bubble gas points ... 60
Figure 4.4 The process of generating bubble gas criterion map ... 60
Figure 4.5 Bubble gas criteria maps... 61
Figure 4.6 The process of generating mud flood frequency criterion map... 62
Figure 4.7 Mud flooded criterion map ... 63
Figure 4.8 The plotting of water observation points ... 64
Figure 4.10 Water quality criterion map ... 65
Figure 4.11 Weighted criteria layers at alpha 0.6 and lambda 0... 71
Figure 4.12 The vulnerability map at alpha 0.6 and lambda 0... 73
Figure 4.13 Vulnerability class map at alpha 0.4 under several lambda value... 77
Figure 4.14 Vulnerability class map at alpha 0.6 under several lambda value... 78
Figure 4.15 Vulnerability class map at alpha 0.8 under several lambda value... 80
LIST OF TABLE
Page
Table 2.1 Frequency scoring ... 14
Table 2.2 Area of impact scoring... 15
Table 2.3 Severity scoring... 15
Table 3.1 Demography of study area ... 31
Table 3.2 Software component ... 32
Table 3.4 Conversion of crisp PCM to fuzzy PCM ... 40
Table 4.1 Subsidence classification of impact with reference to building... 50
Table 4.2 Methane hazard class ... 52
Table 4.3 Carbon Dioxide hazard class... 54
Table 4. 4 Mud flood hazard classification... 55
Table 4.5 Relation between Score and Water Quality Status ... 56
Table 4.6 Hazard vulnerability criteria for mud volcano... 57
Table 4.7 Crisp PCM for criteria weighting ... 66
Table 4.8 Crisp PCM for subsidence criterion to vulnerability class ... 66
Table 4.9 Fuzzified Pairwise Comparison Matrix ... 67
Table 4.10 Fuzzy weight of criteria ... 68
Table 4.11 Fuzzy performance of subsidence criterion ... 68
Table 4.12 Fuzzy weighted performance of subsidence criterion... 69
Table 4.13 Alpha cut analysis for subsidence criterion ... 69
Table 4.14 Crisp performance value of subsidence criterion obtained at three different lambda values ... 70
LIST OF APPENDIX
Page
Appendix 1 Concentration of Bubble Gas ... 93
Appendix 2 Physical and Chemical Concentration of Water Criterion ... 94
Appendix 3 List of Expert... 96
Appendix 4 Input PCM of All Criteria over the Hierarchy ... 96
Appendix 5 Geometric Mean of Input PCM for All Criteria... 102
I. INTRODUCTION
1.1 Background
Land use management and policy decisions are almost always based on the analysis of the factors pertaining to each particular issue. The concentration of managing area at the strategic level deal with further development in order to assess the performance of intervention measures and to reassess the priorities for intervention in the light of ongoing developments. This activity must consider risk level of area from natural disasters source such as earthquakes, floods, volcanic eruptions, landslides, etc.
Hazard related problems could be solved through planning studies and detailed projects about hazard prone areas. Determining hazard vulnerable areas is important for decision makers searching for an area that is potential enough for further development. The key is the ability to incorporate appropriate hazard information and use it effectively, considering its complexity and diverse nature.
Since May 29th 2006, a sea of hot mud has been gushing from the ground in Sidoarjo, East Java, 35 kilometers south of Indonesia's second largest city, Surabaya. Thousands of people have been forced to move from their homes when hot mud continued spurting from the ground near a gas exploration well on Indonesia's most densely populated island.
One year on, the mud has buried several villages, housing estates, farm lands, and nearly 100 factories, schools, mosques, shops, and offices. More than 50,000 people have lost their homes and many more have lost their livelihoods (Flinders, 2007). Estimations are that with the mudflow continuing unstopped for possibly years, over 11,000 people will be permanently displaced. Because the stability of the surface in the area is affected, more residents may have to move to safer places. Many houses in the west already have broken walls and floors (Pohl, 2007).
Data and information about the extent of the area affected by the hazard is urgently required in order to manage the planning of a medium term strategy based on a number of options including the worst case scenario. Identifying vulnerable area of hot mud volcano is important for the government of Sidoarjo to provide information about the area that is dangerous enough and critical to relocate people in this area to a safer place. Besides, this activity also presents information on area which is still effective and potential for further development planning to reduce the impact of natural hazards.
Multi-criteria evaluations techniques can provide tools for analysing the complex trade-offs between choice alternatives with different environmental and socio-economic impacts. Multi-criteria decision analysis (MCDA) offers a flexible, problem solving environment, where the decision problem can be explored, understood and redefined; tradeoffs between multiple and conflicting objectives investigated; and priority actions set (Ascough, et al, 2000).
Vulnerability analysis for natural hazard deals with uncertainty arises due to the lack of information about system behavior (vagueness, ambiguity, fuzziness) and inexactness of measurement (impreciseness, fuzziness) (Zischg et al, 2005). Expert knowledge that involved in multi-criteria decision making will include some vagueness and imprecision to judge the parameters.
Using Boolean logic is impossible to model the uncertainties since it only judge the range into crisp value (true or false), which limit the analysis to specific region. Probabilistic theory provides methods dealing with uncertainty related to randomness and cannot be applied when it is imprecise and incomplete. Fuzzy logic provides mathematical methods aids in information that are imprecise, incomplete and vague. The value expresses in continuous degrees of belonging to a set, ranging from 0.0 to 1.0.
the techniques of spatial multi-criteria analysis and fuzzy logic. Yalcin and Akyurek (2002) generate a composite map for decision makers by using some
effective factors causing flood. The study reviewed the role of GIS in decision-making and then outlined the evaluation approach for many criteria in decision process. The uncertain knowledge in multi-criteria decision making was held by considering standardized criteria as fuzzy measures.
Vulnerability analysis for mud volcano hazard involves incorporation of expert knowledge at various levels of decision-making. Expert cannot be sure and certain all the time, vagueness and imprecision involved in expert knowledge can be well addressed using fuzzy logic. In this research Fuzzy AHP (Analytical Hierarchy Process) was used to asses the vagueness that involved with expert knowledge.
1.2 Research Objective
The objectives of the research are:
1. To develop multi-criteria evaluation method using fuzzy analysis approach for mud volcano vulnerable area.
2. To develop mud volcano vulnerable map of Sidoarjo Regency using performance value is obtained from multi-criteria evaluation on the basis of fuzzy analysis approach.
1.3 Research Question
Research question related to the first objective are:
1. What are the required evaluation criteria to assess mud volcano vulnerable model?
2. How to incorporate the expert knowledge and uncertainty to judge the parameters involve in it?
3. How sensitivity of the process can be measured? Research question related to the second objective is:
4. How to apply multi-criteria evaluation and fuzzy analysis approach for developing mud volcano vulnerable map?
1.4 Scope of the Research
1. Study area is chosen in Sidoajo Regency, East Java (as working area of The National Sidoarjo Mudflow Mitigation Team/BPLS).
2. The analysis is only performed for the area outside the mud embankment and limited to settlement area.
3. Multi-criteria decision making for Vulnerability Analysis is performed using Fuzzy Analytical Hierarchy Process (Fuzzy-AHP).
4. The usefulness of vulnerability map resulted from this research only appropriate for duration of the research study.
1.5 Research Output
by applying GIS spatial analysis to identify settlement area is significantly vulnerable to mud volcano hazard. Vulnerable map will be compared with existing impacted area of mud volcano.
II. LITERATURE REVIEW
2.1 Natural Hazard Assessment
Natural hazard is “the probability of occurrence within a specific period of time in a given area, of a potential damaging phenomenon” (Cepero, 2003). The disasters that natural hazards can cause are largely the result of actions by man that increase vulnerability, or lack of action to anticipate and mitigate the potential damage of these events.
Typically, a number of types of hazards resulted from a volcanic activity. Each hazard poses different risks affecting different areas. This is the key difference between eruptions and the other principal natural hazards, floods and earthquakes. The most threatening hazards include pyroclastic falls, pyroclastic flows and surges, lava extrusions (flows and domes), lahars, debris avalanches and volcanic gases. This study deals with mud volcano hazard.
2.1.1 Mud Volcanoes in East Java, Indonesia
common and can occur both on the surface and at ocean bottoms worldwide. They are often associated with petroleum deposits.
The Sidoarjo mud flow or Lapindo mud, also informally abbreviated as
Lusi, a contraction of Lumpur Sidoarjo (lumpur is the Indonesian word for mud), is an ongoing eruption of gas and mud in the subdistrict of Porong, Sidoarjo in East Java, Indonesia (20 kilometers south of Surabaya). It is considered to be a mud volcano. It appears that the flow will continue indefinitely and so far all efforts to stem the flow have failed (Awad, 2006).
Figure 2.1 The continuous mudflow has submerged various villages
e mud was ranging from f the mudflow, to 0.1 to 0.6 metres at the edges
writing, the flow is continuing.
On 21 June 2006, Lapindo Brantas (the owner of the well) calculated the volume of mud emitted since 29 May 2006, based on surface and depth measurements using Global Positioning System. On that date, the volume was estimated to be 1.1 million m3 of mud. The depth of th
3.5 to 6.4 metres around the source o
2.1.2 Volcano Hazard Assessment
When a normally quiet volcano begins to show signs of restless activity, people
ture eruptions (USGS, 2000). Even when a volcano is not showing signs of restlessness, these answers are important for
planning purposes, including emergency-response planning and deciding where
sources and valuable environmental features that are within
ensure adequate data and information have been made available for use in the typically want to know what type and size of eruption might occur and where potentially hazardous areas are located. Answers to these questions are critical to people and public officials who have to prepare for impending volcanic activity. Volcano-hazard assessments help to provide the answers.
Volcano-hazard assessments identify the location of potentially hazardous areas and estimate the severity of fu
term
to build new infrastructure, such as new buildings, power-generating facilities, and transportation routes.
2.2 Vulnerability Assessment
When the areas vulnerable to the identified hazards have been delineated and mapped, the subcommittee is then positioned to identify the extent of the community's potential vulnerability to each hazard. This is done by identifying the people, property, economic re
the hazard areas, and then including this information on the hazard maps being prepared by the Working Group and/or the Department. It is offering suggestions on gathering and using available information and services to complete the vulnerability assessment.
analysis. This information could be limited to simple data (the address and legal definition of the property) or, preferably, GIS produced data with property appraisal maps which show property boundary lines (e.g., "cadastral" coverage). The example types of local data gathering tasks that may be needed are displayed at Figure 2.2 below.
Figure 2.2 The suggested task of vulnerability analysis to identify vulnerable people and property (Source: Florida Disaster, 2008)
flood plains (Florida Disaster, 2008). Much of this information should be available in most counties from the emergency management office, the nd other local government agencies. Each of the
eated, the population that may be e areas should also be defined. Census data are readily availab
ent and etc
cal Mitigation Strategy. he number and type of "critical" facilities will depend, of course, on the
unity. Because more developed communities could h
comprehensive planning department, a
type of local data gathering tasks that may be needed is discussed more completely below.
♦ Population in The Hazard Zones
One major objective of the Local Mitigation Strategy will be to protect people from the health and safety impacts of disasters. Therefore, with the hazard areas for specific types of threats delin
threatened within thos
le to planners for this purpose, and should assess such additional population factors within the hazard areas.
♦ Critical Facilities
Every community will have facilities that are "critical" to important community functions, beginning with, of course emergency response and safety operations. The example of critical facilities such as school, hospital, fire department, police department, highway patrol, electrical system, water treatm
. It is important that the potential impacts of disasters on these facilities are estimated so that can ensure that mitigation initiatives needed to protect them are identified and given an appropriate priority in the Lo
T
unique characteristics of each comm
♦ Locations of Repetitive Losses
Another of the objectives of the Local Mitigation Strategy will be to minimize repetitive losses from disasters. Areas experiencing such repetitive losses
its Local Mitigation Strategy and mit t
types of disaster damages, identification of repetitive losses cou i
• iness and industry due to repeated utility
• ents of the infrastructure, e.g., coastal
nts such as hazardous materials
ensure that evacuation from such areas is feasible under various disaster scenarios. Another reason may be to define initiatives that could be helpful in
f their health and safety impact
should be identified to the Department for incorporation in the modeling and/or considered directly as it develops
iga ion initiatives. For other
ld nclude such factors as the following: Economic damages to bus
outages,
Repetitive damages to compon roadways and bridges, etc.,
• Repetitive public safety threats from eve
accidents or civil disorder, and
• Structures or facilities repeated damaged by high winds.
♦ Information Regarding Evacuation Zones
For several reasons, evacuation zones may also have been identified to help in the preparation of the Local Mitigation Strategy to identify these zones on the maps being prepared. One reason is to determine if mitigation initiatives are needed to
♦ Locations of Vulnerable Environmental Resources
Assessing the hazard zones is helpful to identify whether they encompass valuable environmental, historic or cultural resources that may be vulnerable to the hazard. Vulnerable resources could include features such as aquifer recharge zones, potable water sources, historic buildings, and other such features. If the vulnera
vent could cause ting the damage caused
ons or facilities at may be subject to disaster impacts. For example, it may be widely known that
ific wash out after every heavy rainstorm, or that a
certain
unity is exposed for each hazard. A judgment regarding the bility of these types of resources is known, then the Local Mitigation Strategy can also consider mitigation initiatives to lessen the potential for damage.
♦ Hazardous Materials Facilities
Facilities where hazard materials are stored represent a unique situation regarding their vulnerability to disasters, for the impact of the e
the accidental release of dangerous materials, further exacerba
by the disaster itself. It will be worthwhile to assess the vulnerabilities of any such facilities that are located in the identified hazard zones.
♦ Historical Information Regarding Hazard Vulnerabilities
An important source of information to complete the vulnerability assessment process is "local knowledge" regarding specific locati
th
spec sections of roadways
electrical transmission line fails often during windstorms.
2.3 Vulnerable Analysis
risk of
s. There are several factors to consider when assessing vulnera
od of the event occurring again in the
future. This ra long-term (30
years at least) data. Examination of past events helps to determine the like
of ven in the future.
Table 2.1 Frequency scoring (Source: Heinz, 1999)
Approx. Rec ce
(years)
Approx. Probability
Frequency Score
a specific type of event will be an important tool for used later in prioritizing mitigation initiatives as they are developed from the vulnerability assessment results.
Vulnerability is concerned with the qualitative or quantitative examination of the exposure of some component of society, economy or the environment to natural hazard
bility, and these include: the frequency of the hazard, the size of the area affected by the disaster, and the severity or amount of damages that has resulted.
1. Frequency
Evaluating the number of times that the natural hazard has impacted in the past provides a measure of the likeliho
ting is derived from an investigation of trends in the
lihood similar e ts occurring
urren Annual Subjective Description
1 100.0% Frequently recurring hazards, multiple
recurrences in one lifetime 5
50 2.0% Typically occurs at least once in lifetime of
average building 4
250 0.40% ccurring at least once in lifetime
of average building 3
25% chance of o
500 0.20% 10% chance of occurring at least once in lifetime
of average building 2
1000 0.10% Highly infrequent events, like maximum
considered earthquake 1
2. Area of Impact
A second criteria used in evaluating vulnerability to natural hazards is to determine the impact, or size of the area affected by the disaster. Some hazard events impact only a small region, while others can affect the entire area. The
area of imp iate area is
im vent. Again, historical data is used to investigate damage and loss records of previous hazard events to develop an estimate of where
expected im cts or the a ccur.
able 2.2 A g (Source: Heinz, 1999)
Mean Affected Area
(sq. miles)/event Subjective Description Area Impact Score
act determination indicates how much of the immed pounded by a single e
pa mount of property damage may o
T rea of impact scorin
0 No affected area 0
1 Highly localized (city block scale) 1
10 Single zip code impact 2
50 City scale impact 3
100 County scale impact 4
500 Regional impact (e.g. statewide) 5
3. Severity
Severity, e range of the
x
Previous damage reports and other hist ical data (e.g. newspaper articles, personal accountings, video clips, etc,) are used.
Table 2.3 Severity scoring (Source: Heinz, 1999)
Severity Score Earthquake (MMI) Hurricane (SSI) Average Flood Elevation (ft)
or magnitude criteria, is used to determine th
severity of damage (from minor to devastating) e pected from a single event. or
0 3 0 0
1 4 1 1
2 5 2 8
3 7 3 12
4 9 4 14
2.4 Use of GIS In Natural Hazard Assessments
Geography Information System (GIS) is a computer system, which has the capabil
that is very different than other kind of database
application system. This aspect is the ab spatial or
non-spatia ata could
be displayed in the form of region boundary together with the attributes in the form of alphabet or numbers.
ities to input, retrieval, analyze, and data display that are very important in the decision making process. The system will consist of hardware, software and brain-ware which are design to efficiently input, save, update, manipulate, analysis, and display all different kind of geographical information (ESRI 1990).
GIS technology was developed and integrated from parallel development in automated several broadly related fields such as cadastral and topographical mapping, thematic cartography, civil engineering, geography, mathematical studies of spatial variation, soil science surveying and photogrammetry, rural and urban planning, utility network, remote sensing and image analysis (Burrough,. 1986). GIS has one aspect
[image:35.595.123.474.522.729.2]he damage the hazards can cause,
no location, floodplains, erosion patterns, etc.) re usually enough to conduct a GIS preliminary evaluation of the natural hazard
tential. Similarly, GIS can be used in hazard assessments at the sub national level for resource analysis and project identification. At the local level, planners can use a GIS application has been used as tools to assess and to map hazards such as earthquakes, hurricanes, flood, volcanic hazard, etc which it deals with how the information can be incorporated into development planning to reduce the impact of natural hazards. The process is complicated, however, by entirely new data sets on assessment of various natural hazards, separately and in combination, and by the need to analyze these hazards with respect to existing and planned development, choose among means of mitigating t
carry out an economic analysis of the alternatives of mitigation versus no mitigation, and determine the impact of these alternatives on the economic and financial feasibility of the project.
GIS applications in natural hazard management and development planning are limited only by the amount of information available and by the imagination of the analyst. Readily available information on natural events (e.g., previous disaster records), scientific research (papers, articles, newsletters, etc.), and hazard mapping (seismic fault and volca
a
situation and guide development planning activities.
GIS to formulate investment projects and establish specific mitigation strategies for disaster prevention activities.
2.5 Multi-criteria Decision Analysis (MCDA)
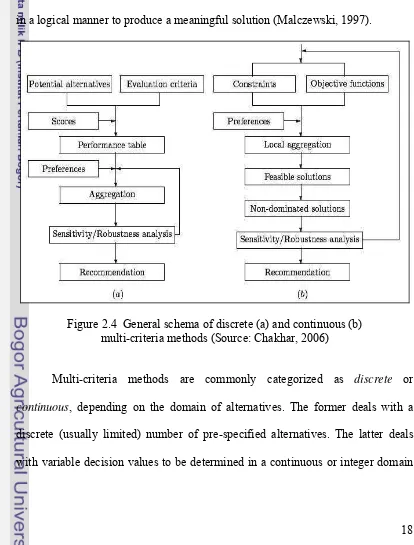
[image:37.595.97.511.265.810.2]Decision Analysis is a set of systematic procedures for analyzing complex decision problems. These procedures include dividing the decision problems into smaller more understandable parts; analyzing each part; and integrating the parts in a logical manner to produce a meaningful solution (Malczewski, 1997).
Figure 2.4 General schema of discrete (a) and continuous (b)
Multi-criteria methods are commonly categorized as discrete or
continuous, depending on the domain of alternatives. The former deals with a discrete (usually limited) number of pre-specified alternatives. The latter deals with variable decision values to be determined in a continuous or integer domain
of infinite or large number of choices. Several authors classify them as (i) multiple attribute decision-making (MADM), and (ii) multiple objective decision-making
(MODM). In this presentation, the discrete/continuous classification is chosen since it is in accordance with the conventional representation of data in the GIS (vector vs. raster) and it is more general than the MADM/MODM classification. The other classification depends on the certainty of the decision. If the decision maker has perfect knowledge of the decision environment and the amount of knowledge available is enough, then the decision is considered as decision under certainty. However, most of the real world decisions involve some aspects that are nknown and difficult to predict. This type of decisions is referred as decisions can be further subdivided into u
under uncertainty. The decisions under uncertainty
fuzzy and probabilistic decision making (Leung, 1988 and Eastman, 1993). The probabilistic decisions are handled by probability theory and statistics. And the outcome of a stochastic event is either true or false. However, if the situation is ambiguous, the problem is structured as the degree of how much an event belongs to a class. This type of problems is handled by fuzzy set theory (Zadeh, 1965 in Zischg, 2005).
2.6 Spatial Multi-Criteria Decision Making
as large numbers of factors need to be identified and considered, with high correlated relationships among the factors (Malczewski 1999).
The goal of spatial MCDM is to achieve solutions for spatial decision problem
ement and analysis component contain a robust set of tools that are available in full-fledged GIS systems. his may include analytical tools for ex
techniques. These techniques can be used to generate data inputs (criterion maps) to mult
s that take the input from multiple criteria. These criteria, also called attribute have to be identified very carefully to ensure that the final goal could be achieved. The performance of the objective is measured with the help of the attributes. In hierarchy, a set of criteria should be decomposable, non-redundant, complete, minimal, and computational (Prakash, 2003). The hierarchy serves two purposes: to provide the overall view of the complex relationships in the situation and to allow decision makers to assess whether they are comparing the issues of same order or magnitude. The basic reason behind the hierarchical structuring of a decision problem is that the elements being compared should be homogenous.
Spatial data analysis is in many ways the most important part of Geography Information System (GIS), because it includes all of the transformations, manipulations, and methods that can be applied to geographic data to add value to them, to support decisions, and to reveal patterns and anomalies that are not immediately obvious. It is desirable that the geographical data manag
T
ploratory data analysis such as statistical analysis and mathematical modeling
evaluating the complex phenomenon, such as the environmental decision problems that are characterized of having multiple and often conflicting objectives.
Figure 2.5 Loose (a) and tight (b) multi-criteria spatial DSS coupling strategies (Source: Malczewski, 1999)
upled strategy involves accessing MC
the tw therefo criteria
level o programming skills.
2.7
Thoma
analyz competing objectives
Either loose or tight coupling strategies [Jankowski, 1995] can be implemented for facilitating the integration of GIS and MCDM techniques (Figure 2.5). The loose coupling approach combines the capabilities of separate models for GIS functions and MCDM by transferring files through a file exchange mechanism [Jankowski, 1995]. A tightly co
DM analysis routines from within GIS software [Jankowski, 1995]. It allows o components to run simultaneously and to share a common database;
re, program control remains within the GIS when performing the decision analysis. In general, the tight coupling approach requires a high f knowledge of the GIS in question and considerable
Analytical Hierarchy Process
are princip
♦
ecision hierarchy from the general to more
riteria into different
gro teria in its decision outputs.
The tematic procedure for representing
hie the basic rationality by
bre en
gui ents (which
are re-examined) to express the relative strength or
involved and multiple alternatives are available. The method is based on three les are explained below (Saaty, 1980):
Decomposition, to decompose a complex decision problem into simpler decision problems to form a d
specific until a level of attributes are reached. Each level must be linked to the next higher level. Typically a hierarchical structure includes four levels: goal, objectives, attributes and alternatives.
♦ Comparative judgment, to perform cardinal rankings for objectives and
alternatives are required. It involves 3 steps: (1) development of a comparison matrix at each level of hierarchy (2) computation of weights for each element of the hierarchy and (3) estimation of consistency ratio which is mentioned in pairwise comparison section.
♦ Synthesis of priorities, to combine the relative weights of the levels
obtained in the above step to produce composite weights. This is done by means of a sequence of multiplications of the matrices of relative weights at each level of the hierarchy.
The decision making in AHP is a process that continuous from analyzing the decision environment to understand and arrange the c
ups and levels that reach the evaluation of the cri Analytical Hierarchy Process is a sys
rarchically the elements of any problem. It organized
aking down a problem into its smaller and smaller constituent parts and th des decision makers through a series of pairwise comparison judgm
inte ents in the hierarchy (Saaty, 1980). The judgments
tha numbers. The AHP includes procedures
and pr
imates and correspond to what known as hard numbers. AHP has several
uired range, the quality of the judgments should be imp
to its flexibility, easy to use. It is also incorpo
nd the use of 1 to 9 scales can be thought as the disadvantages of this method. The ratio scale makes sense when dealing with something like
nsity of impact of the elem
t have been made then translated to
inciples that used to synthesize the many judgments to derive priorities among criteria and down to alternative solutions. The numbers that obtained are ratio scale est
basic steps to be employing as follows (Saaty, 1980): 1. identify the problem and determine the goal,
2. structure the hierarchy from the top,
3. construct a set of pairwise comparison matrices,
4. there are n(n-1)/2 judgments required to develop each matrix in step 3, 5. determined the consistency using the eigenvalue,
6. horizontal processing, 7. vertical processing,
8. calculate the consistency ratio.
The consistency ratio (CR) should be about 10% or less to be acceptable. If the CR does not fall in the req
roved.
The AHP has widespread use due
distanc
2.8
poses by Dr. Lofti A. Zadeh in 1965
ts, which have vagueness and imprecision in their characteristics. At e, or area which is natural ratio scales, but not when dealing with like comfort, image, or quality of life, for which no clear reference levels exists. Furthermore, for large problems too many pairwise comparisons must be performed (Malczewski, 1999).
Fuzzy Logic in Decision Making
Fuzzy decision making techniques emerged as a result of the normal decision making methods inability to address the imprecision and vagueness. In the real world decision making process there any many goals, constraints and consequences that are precisely unknown. In such situation fuzzy set theory becomes useful.
Burrough (1989) states that simple Boolean algebraic operations used in the evaluation process will result in significant loss of information and in this case fuzzy set theory will be useful alternative. Some important aspects of the soil, like internal heterogeneity, measurement error, complexity, imprecision, etc. are not put into account by normal land evaluation classification.
One method to obtain information on the uncertainties in the risk analysis procedure is the representation of the vagueness related to the risk parameters by fuzzy number. Theory about “Fuzzy Sets” pro
(Malczewski, 1999). Fuzzy set is defined as a class of elements or objects without any definite boundaries between them. The fuzzy logic is useful to define the real world objec
(Zadeh, 1978). Fuzzy logic is a multi-valued theory where in intermediate values such as “moderate”, “high”, “low” were used instead of yes or no, true or false as it is used in the conventional crisp theory. The fuzzy sets are defined by the embership functions. The fuzzy sets represent the grade of any element x of X hav embership to A. The degree to which an element belongs to a set is
l fuzzy sets representing linguistic concepts such as low, medium, high, a
overcome the inability of AHP to handle imprecision and subjective-ness in
r’s uncerta
m
that e the partial m
defined by the value between 0 and 1.
If an element x really belongs to A if A(x) = 1, and x not belongs to A if A(x) = 0. The higher is the membership value, the greater is the element x belong to a set A.
Severa
nd so on are often employed to define states of a variable. Such a variable is usually called a fuzzy variable. The significance of fuzzy variables is that they facilitate gradual transitions between states and, consequently, possess a natural capability to express and deal with observation and measurement vagueness.
2.9 Fuzzy AHP
To
pairwise comparison process has been extended Saaty’s AHP by Buckley and Laarhoven and Pedricz (Deng, 1999). Jeganathan (2003) has modified the methodology that that create simple, improved, and sophisticated approach using fuzzy logic.
moderate (Jeganathan 2003 in Kuswandari 2004). Optimistic attitude is represented by the highest value range, moderate attitude is represented by the middle value of range and pessimistic attitude is represented by the lowest value of range.
Triangular or trapezoidal fuzzy number is used to express the decision ith respect to each criterion. After the criteria are wei
ept of fuzzy extent analysis is applied to solve the fuzzy recipro
the problems that involved qualitative information. To avoid complex maker’s assessment on alternatives w
ghted, the overall utilities of alternatives represented by fuzzy number are aggregated by fuzzy arithmetic using Simple Additive Weighting method. To prioritize the alternatives, their fuzzy utilities need to be compared and ranked.
The conc
cal matrix for determining the criteria importance and alternative performance. To avoid the complex and unreliable process of comparing fuzzy utilities, the alpha-cut concept is used to transform the fuzzy performance matrix representing the overall performance of all alternatives with respect to each criterion into an interval performance matrix.
2.10 Previous Related-Research
The illustration a method for constructing an integrated system of GIS, multi-criteria decision method and expert systems applies by Jun (2000) to an industrial site selection problem that searches for manufacturing facilities sites in a regional scale.
comparison of fuzzy utilities, Deng introduced α-cut analysis. The method is well
designed to deal with all kind of vagueness. α-cut analysis made possible to
incorpo
M) and Ordere
rate the ambiguity in expert knowledge and using the optimism index (λ) to address the decision makers attitude.
Prakash (2003) applied multi-criteria decision making technique using Fuzzy Logic in land suitability analysis for agricultural crop. This study compared three approaches for land suitability, AHP, Ideal Vector Approach and Fuzzy AHP. The process using Fuzzy AHP incorporated the AHP, fuzzy numbers, fuzzy extent analysis, alpha cut and lambda function. The ability of the three techniques to model the sensitivity of decision making process is also investigated. This study found that Fuzzy AHP performs better than the other two approaches.
The study about hazard assessment and vulnerable analysis has been performed by some researchers. Yalcin, et al ( 2002) integrated GIS and Multi-criteria Decision Analysis (MCDA) to generate a composite map for decision makers by using some effective factors causing flood. The analysis compared Boolean Approach, Ranking Method, Pairwise Comparison Method (PC
d Weighted Averaging (OWA) Method including fuzzy concept on standardization of the criterion values. The study stated that using fuzzy logic reduced the error due to the standardization and classification of the value, but the application of fuzzy measures in Multi-criteria Evaluation in general and OWA in particular require further research.
the techniques of spatial multi-criteria analysis and fuzzy logic. The results suggest that the proposed methodology may provide a new approach for analysing vulnerability that can add to understanding of human/hazards interaction.
III. METHODOLOGY
3.1 Time and Location
This research was conducted from March to July 2008 including process of developing method and implementation of method. Developing the method was accomplished at Bogor Agricultural University, while implementation of method was conducted for study area in Sidoarjo Regency, East Java Province.
3.1.1 General Overview of Study Area
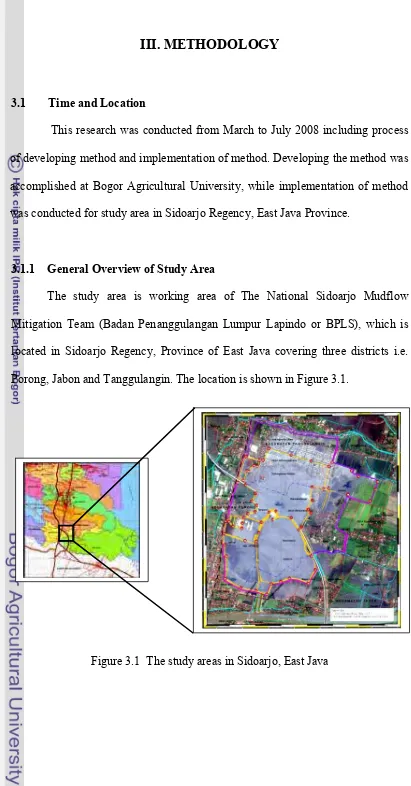
[image:48.595.102.513.49.835.2]The study area is working area of The National Sidoarjo Mudflow Mitigation Team (Badan Penanggulangan Lumpur Lapindo or BPLS), which is located in Sidoarjo Regency, Province of East Java covering three districts i.e. Porong, Jabon and Tanggulangin. The location is shown in Figure 3.1.
Sidoarjo is located about 20 km South of Surabaya (the capital of East Java Province). The boundary of the study area lies between the latitude of 7o30’35” - 7o32’47” S and longitude 112o41’59” - 112o44’00” E (President Regulation No. 14/2007). Porong River flows through the Southern part of the study area where mud is emptied into the Java Sea.
3.1.2 Geological Condition
Based on Geology Technique Map Malang Sheet, the sand of the area surrounding mud flood centre point belongs to alluvium (Pusat Lingkungan Geologi, 2007). This alluvium is in the form of river sediment that consists of sandy silt which is dominantly spreading on top layer followed by sand and sandy clay. Generally, the strength level of soil and rock for this formation is very low (Pusat Lingkungan Geologi, 2007).
The geologic map of Porong – Banjarpanji shows a well-defined surface structure called Watukosek fault zone (IAGI, 2007). Watukosek fault is parallel and very close to the hot mudflow centre point near the Banjarpanji-1 well. Similar patterns and directions from the fracture and mudflow centre can be interpreted as the mudflow is related to the fracture zone (IAGI, 2007).
3.1.3 Climatology
temperture is 37 oC. The lowest temperature occurs on July-August, while the highest temperature occurs on October-November.
The average rainfall of the area is 170 mm with 82.8 rainy days. Wet season occurs between November to April, while dry season between May to October. In the wet and dry seasons the relative humidity is around 76.4 – 78.4% and 73.6 – 78.8% respectively.
3.1.4 Demography
Demography is an important aspect on development planning. The demography of the study area is shown in Table 3.1 which is based on number and composition of population, distribution and sex.
Table 3.1 Demography of study area (Source: Bureau of Statistical Centre, 2006)
District Area (Ha)
Number of Village
Population Male Female
Head of Household
(KK)
Porong 2,982 19 64,019 34,690 29,329 21,670
Jabon 8,100 15 43,945 23,670 20,275 11,557
Tanggulangin 3,229 19 90,684 35,501 55,183 24,162
3.2 Required Tools
Table 3.2 Software component
No. Software Function
1 Map Info 7.0 For spatial data process
2 Arc View 3.3 For spatial data process and analysis 3 ER Mapper 6.4 For image georeference
4 Ms. Excel 2003 For tabular and Fuzzy AHP process 5 Ms. Word 2003 For report writing
3.3 Framework of Vulnerability Analysis
Figure 3.2 Flow of the research process
3.3.1 Identification of Evaluation Criteria
situation); (3) decomposable (i.e. is amenable to partitioning into subsets of criteria, which may be necessary to facilitate a hierarchical approach to decision analysis); (4) non-redundant (i.e. avoids the double-counting of decision consequences); and (5) minimal (i.e. has the property of the smallest complete set of criteria characterizing the consequences of a decision). Developing criteria could be done through literature studies, analytical studies and survey of opinions.
This research used literature study and survey of opinion in form of interview and discussion to develop evaluation criteria. Literature study was done to understand the relevant topics of mud hazard in Sidoarjo. Sources of the study include journal papers about impacts of hazard in Sidoarjo, monitoring reports of Lapindo hazard by BPLS, and internet sources of official or reliable institutions.
3.3.2 Hierarchical Structure of The Criteria
The relationship between the objectives and attributes has a hierarchical structure in MCDA (Malczewiski, 1999). At the highest level the objectives can be distinguished, while at the lower levels the attributes can be decomposed.
3.4 Data Preparation 3.4.1 Data Collection
The main activity of the data collection is to extract list of data according to need analysis and expert knowledge to support evaluation criteria. The data is extracted from the discussion with experts from BPLS and Centre of Environmental Geology, Bandung.
Data collected consists of secondary data including spatial data and non spatial data derived from supporting literatures, field survey of previous researches and related maps of the region. To obtain the expert judgment regarding the scoring of the criteria, structured questionnaire and interview were used.
3.4.2 Generating Criterion Map
Having established a set of criteria for evaluating alternative decision, each criterion should be represented as a map layer in the GIS database. The criterion map represents the spatial distribution of an attribute that measure the degree to which its associated objectives are achieved.
The main purpose of generating criterion map is to create hazard criterion map appropriate to vulnerability input map. This procedure for generating criterion maps is based on GIS functions, which include geographical data input; data storage and management; data manipulation and analysis (Malczewski, 1999).
3.5 Multi-criteria Evaluation
This research uses AHP (Normal) Pairwise Comparison Matrix to standardize the criteria and Fuzzy AHP to describe multi-criteria evaluation.
3.5.1 Normal Pairwise Comparison Matrices
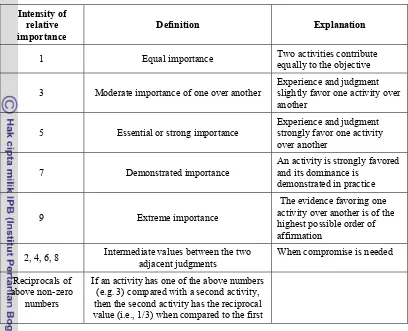
Table 3.3 Scale of Relative Importance (Source: Saaty, 1980)
Intensity of relative importance
Definition Explanation
1 Equal importance Two activities contribute equally to the objective
3 Moderate importance of one over another
Experience and judgment slightly favor one activity over another
5 Essential or strong importance
Experience and judgment strongly favor one activity over another
7 Demonstrated importance
An activity is strongly favored and its dominance is
demonstrated in practice
9 Extreme importance
The evidence favoring one activity over another is of the highest possible order of affirmation
2, 4, 6, 8 Intermediate values between the two adjacent judgments
When compromise is needed
Reciprocals of above non-zero
numbers
If an activity has one of the above numbers (e.g. 3) compared with a second activity, then the second activity has the reciprocal value (i.e., 1/3) when compared to the first
Multi-criteria decision analysis requires the values of the various criteria where the measurement of the values depends on the subjectivity of the personal judgement of decision makers or experts. The evaluation criteria need to be standardized into common scale because they are represented by different measurement scales. The value from PCM can be used for the purpose of rating or standardizing (Malczewski, 2003). Criteria standardization is normally done on 0 to 1 scale, or 0-10 or 0-100, etc. The criteria at the lowest level that have different suitability classes are standardized using the maximum Eigenvectors approach on 0 to 1 scale.
respect to a criterion which is based on the requirements. These classes will be rated based on the importance of vulnerability class with respect to a particular criterion.
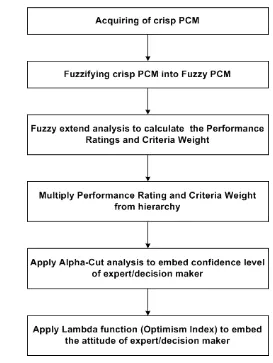
3.5.2 Fuzzy AHP
Figu steps fo erabilit
3.5.3 uzzy AHP Ap n Vulnerabil nalysis
the fuzzy AHP approach, triangular fuzzy numbers were used for the fuzzification of the crisp PCM. The crisp PCM is fuzzified using the triangular fuzzy number f = (l, m, u). The l (lower bound) and u (upper bound) represents the vague range that might exist in the preferences expressed by the decision maker or experts. Conversion from crisp
re 3.3 Fuzzy AHP r vuln y Analysis
F proach i ity A
In
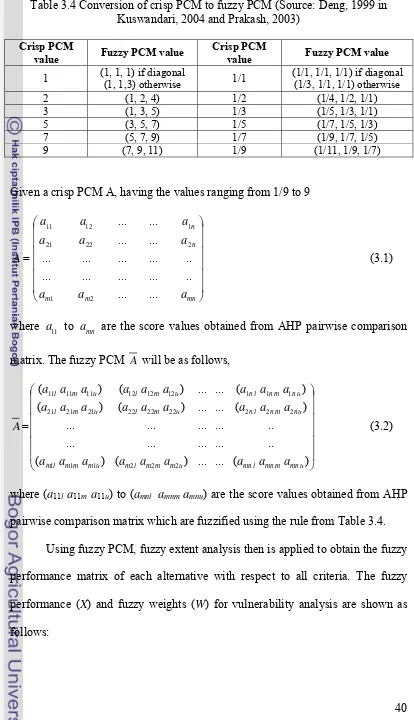
[image:58.595.164.437.78.441.2]Table 3.4 Conversion of crisp PCM to fuzzy PCM (Source: Deng, 1999 in Kuswandari, 2004 and Prakash, 2003)
Crisp PCM
value Fuzzy PCM value
Crisp PCM
value Fuzzy PCM value
1 (1, 1, 1) if diagonal
(1, 1,3) otherwise 1/1
(1/1, 1/1, 1/1) if diagonal (1/3, 1/1, 1/1) otherwise
2 (1, 2, 4) 1/2 (1/4, 1/2, 1/1)
3 (1, 3, 5) 1/3 (1/5, 1/3, 1/1)
5 (3, 5, 7) 1/5 (1/7, 1/5, 1/3)
7 (5, 7, 9) 1/7 (1/9, 1/7, 1/5)
9 (7, 9, 11) 1/9 (1/11, 1/9, 1/7)
Given a crisp PCM A, having the values ranging from 1/9 to 9
⎟ ⎞ ⎜ ⎜ ⎜ ⎛ = n a a a a A ... ... ... 21 1 12 11 ⎟ ⎟ ⎜ ⎜ . .. ... ... .. ⎟ ⎟ ⎟ ⎠ ⎜ ⎝ n a a a a a ... ... . .. .. ... ... ... ... ... 2 22 (3.1) parison atrix mn m
m1 2
where a11 to amn are the score values obtained from AHP pairwise com
m . The fuzzy PCM A will be as follows,
⎟ ⎟ .. ... ... ... ... ⎟ ⎟ ⎠ ⎜ ⎜ ⎜ ⎜ ⎜ ⎜ ⎝ ⎛ = ) ( ... ... ) ( ) ( ) ( ... ... ) ( ) ( ( l a a a a a a a a a a a a a a a a a a a (3.2) where (
pairwise comparison matrix which are fuzzified using the rule from Table 3.4. Using fuzzy PCM, fuzzy extent analysis then is applied to obtain the fuzzy performance matrix of each alternative with respect to all criteria. The fuzzy performance (X) and fuz ) for vulnerability analysis are shown as follows: ⎟ ⎞ ) ( ... ... ) (
) 12 12 12 1 1 1
11 11
11l a ma u a l a ma u anl anmanu
⎟ .. ... ... ... ... 2 2 2 22 22 22 21 21
21 m u l m u nl nm nu
A 2 2 2 1 1
1l mm mu ml mm mu mnl mnm mnu m
a11l a11ma11u) to (amnl amnm amnu) are the score values obtained from AHP
∑
n ⎡∑∑
m n ⎤−1 k ⎡ l k ⎤−1 =j i
1 = =
⎥ ⎦ ⎢ ⎣ ⊗ = i j j i j i a a x 1 1 = = ⎥⎦ ⎢ ⎣ ⊗ =
j i j
j i j
i
j b b
w
1 1 1
(3.3)
here
f vulnerable class i
uzzy PCM
∑
∑∑
=
w
xi = fuzzy performance value o
wj = fuzzy weight value of criteria i
ai= vulnerable level of class i to class j in the f A
bi= importance of criteria i to criteria j in the fuzzy PCM B
i = 1, 2, 3,…, n; number of rows/columns (vulnerable class) in the PCM
j = 1, 2, 3,…,k; number of rows/columns (criteria) in the PCM
The result in fuzzy performance matrix (X) and fuzzy weights (W) will be like shown below,
⎞ ⎜ ⎜ ⎜ ⎛ ) ( ) ( 2 2 2 1 1 1 u m l u m l x x x x x x (3.4) ⎟ ⎜ ⎜ = ... ... ...
W (3.5)
⎟ ⎠ ⎜
⎝(xil xim xiu)
⎟ ⎟ ⎟ ⎟ ⎠ ⎞ ⎜ ⎜ ⎜ ⎜ ⎝ ⎛ ) ( ... ... ... ) ( ) ( 2 2 2 1 1 1 ju jm jl u m l u m l w w w w w w w w w where X ⎟ ⎟ ⎜ ⎜ = ... ... ... ... ... ... j X ⎟ ⎟ ⎟ ⎟
j = performance matrix of vulnerable class for criteria j
W = weight matrix of criteria
A fuzzy weighted performance matrix (P) can thus be obtained by multiplying the weight from the weight vector with the decision matrix over the hierarchy.
(
)
=⎜⎜ ⎟ ⎟ ⎜ ⎜ = = * ... ... ... ... ... .. 2 2 2 2 22l m u l m
w w w w X P ⎟ ⎟ ⎠ ⎜ ⎜ ⎝ ⎟ ⎟ ⎠ ⎜ ⎜ ⎝ ... ... ... ... ... ... u n m n l n u i m i l i
where P
⎟ ⎟ ⎟ ⎟ ⎞ ⎜ ⎛ ⎟ ⎞ ⎜
⎛(x1l x1m x1u) (p1l p1m p1u)
⎜ ⎟ ⎜ ) ( . ) ( ) ( ) ( u ju jm jl j j j p p p p p p x x x x x x (3.6) α
preference or judgment and the result will be a single value having the membership 1 in the fuzzy performance set. It means no further step is required. If α-cut is less than 1 then there is degree of vagueness from the expert or decision
maker related to the preference or judgment. On the other hand if the α-cut = 0, it expresses the highest vagueness of the expert or decision maker regarding the preference and judgment; therefore the possible performance will be whole
n 1 will need further evaluat
j = fuzzy weighted performance matrix of criteria j
The next step is to calculate the interval performance matrix using the -cut over the result above. Alpha-cut is known for enabling to include the decision maker or expert confidence about the preference or judgment that has been made. Applying the α-cut will result to the interval performances. The α-cut value
ranges from 0 to 1. If the α-cut = 1 then the expert is very sure about the
⎟ ⎟ ⎟ ⎟ ⎜ ⎝[ , ] ... ] ,
[ <