Published Online: February 2015
http://dx.doi.org/10.17654/FJMSFeb2015_393_408
Volume 96, Number 4, 2015, Pages 393-408 ISSN: 0972-0871
Received: September 9, 2014; Accepted: December 1, 2014 2010 Mathematics Subject Classification: 90B06, 90C10.
Keywords and phrases: dispatching problem, busway, Transjakarta, integer programming.
∗
Corresponding author Communicated by K. K. Azad
BUSES DISPATCHING PROBLEM IN URBAN
TRANSPORT SYSTEM
Amril Aman, Nurisma, Farida Hanum and Toni Bakhtiar∗
Department of Mathematics Bogor Agricultural University Jl. Raya Darmaga, Bogor 16880 Jawa Barat, Indonesia
e-mail: [email protected] [email protected] [email protected] [email protected]
Abstract
framework to model the operation of Transjakarta, busway transport
system in the metro city of Jakarta. An integer programming is established to determine the optimum number of dispatched buses
from the initial shelter under minimum operational cost. Optimum dispatching leads to a minimum waiting time and assures passengers’
comfort.
1. Introduction
Urban areas are locations having a high level of accumulation and
concentration of economic activities and are complex spatial structures.
Thus, transportation in big cities and other developed areas has high
complexity due to the modes involved, the multitude of origins and
destinations, the amount and variety of traffic including congestion and the
fragility of public transportation systems, and the continuous growth of urban
population. These major challenges are experienced not only by households
and businesses, but also by the urban community at large. Therefore,
transport may become a binding constraint on both economic and social
aspects, along with enlarged negative impacts on health and on the
environment. According to [7], one of the most notable urban transport
problems is the public transport inadequacy, where it mainly relates to the
over used of public transit systems. During busy hours, crowdedness creates
discomfort for passengers as the system copes with a temporary surge in
demand, but in the other side, low ridership makes many services financially
unsustainable.
The dispatching problem is a dynamic decision problem commonly
encountered in transport system as well as in manufacturing sites, batch
jobs in computing and web server farms. In this paper, we present a buses
dispatching model with primary objective is to minimize the number of
dispatched buses from initial shelter each time-slot. Instead of treating the
service demand as a given continuous function, we split the time horizon in discrete time-slots and determine the dispatching rate for each of these
Existing studies on the buses dispatching problem in urban transport
system are some. A critical review of recent planning methodologies and
selected decision support systems for optimizing urban bus transport services
is provided by [2]. In [1], the concept of timed transfer procedure used
in transit systems is examined and its feasibility is evaluated using four
strategies based on simple two-route case to determine the conditions
under which timed transfer provides improved service levels compared to
unscheduled transferring. From the perspective of bus tracking technology, it
is reviewed in [4] the real-time control technology to evaluate the benefits of
tracking bus locations and executing dynamic schedule control through the
simulation of a generic timed transfer terminal under a range of conditions.
In [8], genetic algorithm is used to optimize the bus dispatching problem,
which coordinates with the arrival of the passengers and improves service
level by reducing the average passenger waiting time. Similarly, it is
revitalized in [5] the efficiency of the public transportation system by
addressing the problem of defining a bus region dispatch and simultaneous
arrival, and analyzing the differences between the line dispatching and the
regional dispatching model. It attempted to find the optimal timetable for
given regional buses, which enables the transfer of passengers from one
route to another with a minimum waiting time. A model that minimized
passengers’ travel costs and vehicles’ operation cost under constraints of
passenger volume, time, and frequency is established in [3]. A linear and
single bus route optimal dispatching model is discussed in [6]. The model
considers important issues like random travel times and random dynamic
demand and is solved by using transient little law.
The organization of this paper is as follows. After introductory part in the
first section, we provide in Section 2 the considered deterministic dispatching
model. Problem statement, assumptions, defined parameters and variables are
also described in this section. In Section 3, we verify our model to the case of
2. Bus Dispatching Model
2.1. Problem statement and assumptions
In the present work, we consider a busway route or corridor consisting of
a number of shelters or bus-stops served by company which has a number of
buses, each bus has certain capacity and operational cost. We aim to analyze
the relationship between the number of embarked passengers and the number
of dispatched buses. Particularly we attempt to determine the minimum
number of dispatched buses from initial shelter each time-slot. Information
on the maximum number of passengers under minimum operational cost can
also be provided. We made the following assumptions in order to simplify
the analysis: (1) the track of busway is secured from other vehicles such that
there is no obstacle during the operation of busway, (2) time for fuel supply
and time-stop due to traffic light is ignored, (3) buses are homogeneous in
capacity and move between shelters under constant speed, (4) adjourned
passengers leave the line and will not be considered in the next period, (5)
required trip time between two consecutive shelters refers to one time-slot,
(6) buses dispatched at the same time-slot will bound for the same shelter, (7)
passengers flow is only considered in one direction, (8) head-time between
buses dispatched at the same time-slot is ignored, and (9) each bus may
operate more than one loop a day.
2.2. Parameters and variables
To facilitate our analysis, we define following parameters and indices.
We define by K
( )
i the capacity of bus departed at time-slot i (in person), byC the operational cost (in rupiah per kilometer), by D
( )
i the elapsedrefers to the first shelter where buses initially dispatched. Without loss of generality, we may assume that we have more time-slots than shelters, i.e.,
.
N M ≥
We introduce the following decision variables. K
(
i, j)
denotes the total capacity of buses departed from shelter j at time-slot i, NB(
i, j)
denotes the number of buses operated at shelter j at time-slot i, P(
i, j)
denotes the number of passengers supposed to be departed from shelter j at time-slot i,(
i j k)
Pw , , represents the number of lining-up passengers from shelter j to
shelter k at time-slot i, Pw
(
i, j)
represents the total number of lining-uppassengers at shelter j at time-slot i, Pon
(
i, j)
and Poff(
i, j),
respectively, denote the total number of getting-on and getting-off passengers at shelter jat time-slot i, Pa
(
i, j)
represents the total number of adjourned passengersat shelter j at time-slot i, Pob
(
i, j)
denotes the total number of on-board passengers at shelter j at time-slot i, S(
i, j)
refers to the total number of available seats at shelter j at time-slot i just before passengers get-on the bus,(
i j)
S0 , refers to the total number of available seats after embarkment and disembarkment at shelter j at time-slot i, and U
(
i, j)
quantifies the utility level of bus departed from shelter j at time-slot i. In this case, the utility value is calculated by the ratio between the total number of on-board passengers and the total capacity of buses.2.3. Programming
In this part, we formulate the bus dispatching problem as an integer programming model. The objective of the model is to minimize operational cost expended by bus company throughout the period. The operational cost can be minimized by adjusting the number of dispatched buses at initial shelter. Thus, the objective function of the problem is given by
( )
( )
∑
=
= M
i
B i
N i D C z
1
. 1 , :
Subsequently, constraints involve in this problem mainly imposed by the transport demand between origin-destination points, infrastructure and operational instrument availability, and those related to regulation and standard.
1. The total number of lining-up passengers at shelter j at time-slot i is the whole lining-up passengers with various destinations:
( )
∑
(
)
= = = N k M i k i P i P 2w ,1 ,1, , 1, 2,..., , (2)
(
)
∑
(
)
> ≤ = = j k i j M i k j i P j iPw , , , , 1, 2,..., , . (3)
2. The total number of getting-off passengers at shelter k at time-slot
i is equal to those departed from shelter j to shelter k at preceding time-slots:
(
)
∑
−(
(
)
)
= ≤ = − − = 1 1off , , , , 1, 2,..., , .
k j i k M i k j j k M P k i
P (4)
From constraint (4) we obtain, for instance,
(
5, 4)
(
2,1, 4)
(
3,2, 4)
(
4,3, 4).
off
P P
P
P = + +
3. The number of passengers supposed to be departed at certain shelter
and time-slot is equal to summation of that at preceding shelter
and time-slot and the difference between lining-up and getting-off
passengers, i.e., for i =1, 2,..., M, j =1, 2,..., N −1, and j ≤ i, we have
(
i, j)
P(
i 1, j 1, k)
Pw(
i, j)
Poff(
i, j).
P = − − + − (5)
In case of first shelter and first time-slot, we have P
( )
i,1 = Pw( )
i,1correspondence between one time-slot and trip time between two shelters applies.
4. The total capacity of dispatched buses each time-slot should be greater than eighty percent of the number of passengers supposed to be departed from first shelter each time-slot:
( ) ( )
( )
(
,)
, 1, 2,..., .max 8 . 0 1 ,
1 P j j i M
i K i N i M j
B ≥ ≤ − − = (6)
5. The total capacity of buses departed from shelter j at time-slot i is equal to the multiplication between the number of dispatched buses at first shelter and bus capacity:
(
i, j)
N( ) ( )
i,1 K i, i 1, 2,..., M 1, j i.K = B = − ≤ (7)
6. Constraints (8)-(15) relate to the number of getting-on passengers departed from certain shelter and time-slot.
• If the number of lining-up passengers at shelter 1 and time-slot i is greater than or equal to its capacity, then the number of getting-on passengers is the same as capacity. And if smaller, all lining-up passengers will get-on the buses. Thus, for i =1, 2,..., M,
( )
,1( )
,1 on( )
,1( ),
,1w i K i P i K i
P ≥ → = (8)
( )
,1( )
,1 on( )
,1 w( ).
,1w i P i P i K i
P < → = (9)
• The total number of available seats at shelter 1 at time-slot i just before passengers get-on the bus is equal to the capacity of the bus:
S
( )
i,1 = K( )
i,1, i =1, 2,..., M. (10)For the next shelters, the number of available seats is affected by the total number of on-board passengers as well as that of
getting-off passengers. Thus,
(
i, j)
K(
i, j)
Pob(
i 1, j 1)
Poff(
i, j),
S = − − − +
. , ..., ,
2 M j i
We also have the following conditional constraints for i =1,2, , 1 ..., , 2 , 1 ,
..., M j = N − and j≤ i:
(
i, j)
K(
i, j)
S(
i, j)
K(
i, j),
S ≥ → = (12)
(
i, j)
K(
i, j)
S(
i, j)
S(
i, j),
S < → = (13)
(
i, j)
Pw(
i, j)
Pon(
i, j)
Pw(
i, j),
S ≥ → = (14)
(
i, j)
Pw(
i, j)
Pon(
i, j)
S(
i, j).
S < → = (15)
7. Constraints below relate to the total number of on-board passengers. At the first shelter, this number is identical to that of getting-on passengers. While for the next shelters, it may be influenced by the number of getting-off passengers. Therefore, we posses
( )
,1 on( )
,1, 1,2,..., ,ob M i i P i
P = = (16)
(
,)
ob(
1, 1)
off(
,)
on( ).
,1ob i P j i P j i P j i
P = − − − + (17)
Constraint (17) should be considered for i = 2,..., M, j =
, 1 ..., ,
2 N − and j ≤ i. The following conditional constraints should also be applied:
(
,)
0 ob(
,)
0, ,ob i j j i P j i
P ≤ → = ≤ (18)
(
,)
0 ob(
,)
ob(
,)
, .ob i j j i P j i P j i
P > → = ≤ (19)
8. Next we must satisfy the following constraints in order to quantify the remaining available seats after embarkment and disembarkment of passengers at certain shelter and time-slot.
• The total number of available seats after embarkment and disembarkment at shelter j at time-slot i is equal to the difference between the total number of available seats just before passengers get-on the bus and that of getting-on passengers, i.e.,
(
,)
(
,)
on(
,)
, .0 i j S i j P i j j i
• The following conditional constraints must also apply:
(
,)
(
,)
0(
,)
(
,)
, ,0 i j K i j S i j K i j j i
S ≥ → = ≤ (21)
(
,)
(
,)
0(
,)
0(
,)
, .0 i j K i j S i j S i j j i
S < → = ≤ (22)
9. The total number of adjourned passengers at shelter j and time-slot
i is equal to the difference between the total number of lining-up passengers and that of getting-on passengers:
Pa
(
i, j)
= Pw(
i, j)
− Pon(
i, j)
, j ≤i. (23)10. We need the following constraints to assure the trip continuity of
each bus:
( )
1,1 N( )
i,i , i 2,..., N,NB = B = (24)
( )
,1 B(
1,)
, 2,..., , 2,..., i,B i N i j j i M j N
N = + − = = (25)
where Ni denotes the index of last shelter to be bounded for when a bus is departed at time-slot i. From (25), we may have, for instance,
(
2,1)
N(
3, 2)
N(
N2 1, N2).
NB = B ="= B +
11. Utility level of buses at shelter j at time-slot i is defined by the ratio between the total number of on-board passengers and the total
capacity of buses, i.e.,
(
)
(
(
)
)
, . ,, ,
ob
i j j
i K
j i P j i
U = ≤ (26)
12. The total number of buses operated throughout the period does not
exceed the number of available buses in a corridor:
( )
∑
=
≤ M
i
B i B
N
1
. 1
, (27)
14. Non-negativity constraints: P
( ),
i, j Pw( ),
i, j Poff( ),
i, j Pon( ),
i, j(
,),
ob
j i
P NB
(
i, j),
K(
i, j),
S(
i, j),
S0(
i, j)
and U(
i, j)
are non-negative for all i and j.3. Transjakarta Case
To illustrate the feasibility of the model, we consider a buses dispatching problem of Transjakarta transport system, also known as busway, a BRT system introduced by the Government of Jakarta. Starting with one corridor in 2004, currently Transjakarta manages twelve corridors consisting of more than 200 shelters. The system covers about 200 kilometers length, served by more than 600 units of bus. On average, Transjakarta delivers more than 350 thousands passengers a day.
last time-slot just connects two consecutive shelters, e.g., Blok M to Al-Azhar or Bundaran Senayan to GBK as indicated by last row of Table 2. We further assume that the operational unit cost is 10435 rupiahs per kilometer. Data of passengers is for 2011 and obtained from The Management of Transjakarta (UPTB, Unit Pengelola Transjakarta Busway). We aimed to determine the number of dispatched buses at each time-slot which minimized the total operational cost. We then compared our result which obtained by using operation research/management science (OR/MS) approach with that accomplished by UPTB.
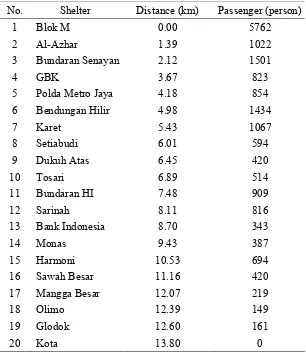
Table 1. Shelters and their daily riderships (2011)
No. Shelter Distance (km) Passenger (person)
1 Blok M 0.00 5762
2 Al-Azhar 1.39 1022
3 Bundaran Senayan 2.12 1501
4 GBK 3.67 823
5 Polda Metro Jaya 4.18 854
6 Bendungan Hilir 4.98 1434
7 Karet 5.43 1067
8 Setiabudi 6.01 594
9 Dukuh Atas 6.45 420
10 Tosari 6.89 514
11 Bundaran HI 7.48 909
12 Sarinah 8.11 816
13 Bank Indonesia 8.70 343
14 Monas 9.43 387
15 Harmoni 10.53 694
16 Sawah Besar 11.16 420
17 Mangga Besar 12.07 219
18 Olimo 12.39 149
19 Glodok 12.60 161
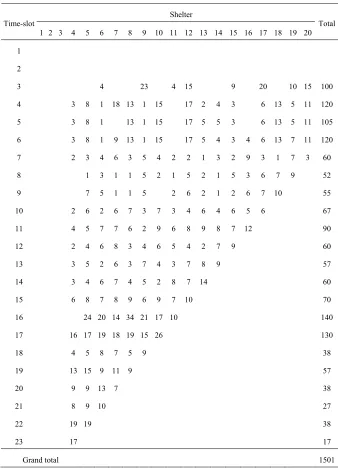
Table 2. The number of passengers departed from Bundaran Senayan to other shelters
Shelter Time-slot
1 2 3 4 5 6 7 8 9 10 11 12 13 14 15 16 17 18 19 20 Total
1 2
3 4 23 4 15 9 20 10 15 100 4 3 8 1 18 13 1 15 17 2 4 3 6 13 5 11 120 5 3 8 1 13 1 15 17 5 5 3 6 13 5 11 105 6 3 8 1 9 13 1 15 17 5 4 3 4 6 13 7 11 120 7 2 3 4 6 3 5 4 2 2 1 3 2 9 3 1 7 3 60
8 1 3 1 1 5 2 1 5 2 1 5 3 6 7 9 52
9 7 5 1 1 5 2 6 2 1 2 6 7 10 55
10 2 6 2 6 7 3 7 3 4 6 4 6 5 6 67
11 4 5 7 7 6 2 9 6 8 9 8 7 12 90
12 2 4 6 8 3 4 6 5 4 2 7 9 60
13 3 5 2 6 3 7 4 3 7 8 9 57
14 3 4 6 7 4 5 2 8 7 14 60
15 6 8 7 8 9 6 9 7 10 70
16 24 20 14 34 21 17 10 140
17 16 17 19 18 19 15 26 130
18 4 5 8 7 5 9 38
19 13 15 9 11 9 57
20 9 9 13 7 38
21 8 9 10 27
22 19 19 38
23 17 17
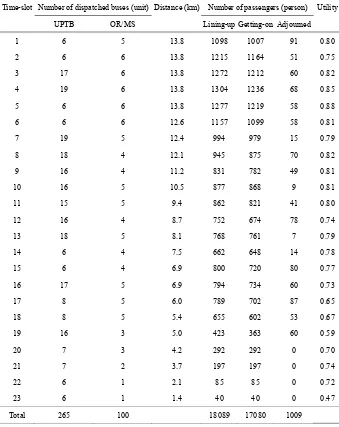
Table 3 describes the minimum number of dispatched buses and the
number of passengers. It is shown that while UPTB dispatched 265 trips
per session to transport passengers, calculation based OR/MS suggests a
less number, it is only 100 trips required. By multiplying the number of
dispatched buses, distance coverage, and operational unit cost according to
(1) we corroborate that the total cost is 10366129 rupiahs. Obviously this is a
60 percent cost reduction. However, the consequence of dispatching less
number of trips is that not all lining-up passengers could be departed, i.e.,
there were 1009 adjourned passengers (5.6 percent). This would not be a case
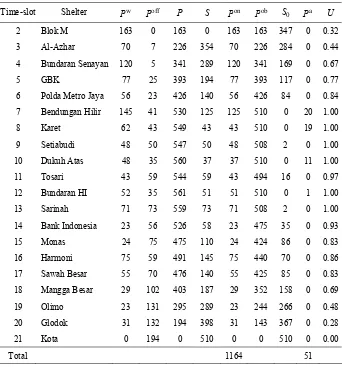
of UPTB which decided to depart more trips. The numbers of getting-on and
adjourned passengers presented in the table were acquired from passengers
flow, as for the case of departure at time-slot 2 is depicted by Table 4. We
can inspect that Table 4 accounts all the numbers affected by flow of
passengers time by time. It is added up that the total numbers of getting-on
and adjourned passengers are 1164 and 51, respectively, as summarized in
Table 3. Utility value of 75 percent is come out by averaging utility values
Table 3. The number of dispatched buses and passengers
Number of dispatched buses (unit) Number of passengers (person) Time-slot
UPTB OR/MS Distance (km)
Lining-up Getting-on Adjourned Utility
Table 4. Flow of passengers departed at time-slot 2
Time-slot Shelter Pw Poff P S Pon Pob S0 a
P U
2 Blok M 163 0 163 0 163 163 347 0 0.32
3 Al-Azhar 70 7 226 354 70 226 284 0 0.44
4 Bundaran Senayan 120 5 341 289 120 341 169 0 0.67
5 GBK 77 25 393 194 77 393 117 0 0.77
6 Polda Metro Jaya 56 23 426 140 56 426 84 0 0.84
7 Bendungan Hilir 145 41 530 125 125 510 0 20 1.00
8 Karet 62 43 549 43 43 510 0 19 1.00
9 Setiabudi 48 50 547 50 48 508 2 0 1.00
10 Dukuh Atas 48 35 560 37 37 510 0 11 1.00
11 Tosari 43 59 544 59 43 494 16 0 0.97
12 Bundaran HI 52 35 561 51 51 510 0 1 1.00
13 Sarinah 71 73 559 73 71 508 2 0 1.00
14 Bank Indonesia 23 56 526 58 23 475 35 0 0.93
15 Monas 24 75 475 110 24 424 86 0 0.83
16 Harmoni 75 59 491 145 75 440 70 0 0.86
17 Sawah Besar 55 70 476 140 55 425 85 0 0.83
18 Mangga Besar 29 102 403 187 29 352 158 0 0.69
19 Olimo 23 131 295 289 23 244 266 0 0.48
20 Glodok 31 132 194 398 31 143 367 0 0.28
21 Kota 0 194 0 510 0 0 510 0 0.00
Total 1164 51
4. Concluding Remark
We have developed a simple deterministic buses dispatching problem
with the main objective is to minimize the number of departed buses from
initial shelter each period. The state equations of the model were built based
on the flow of lining-up, getting-on, getting-off and adjourned passengers. In the case of Transjakarta transport system, we have demonstrated that
OR/MS approach elaborated in this paper can significantly reduce the
For example, it is realized that assumption 5 is too restrictive. Loosing this
assumption may expose the stochastic property of the model. In this case, for
instance, trip time between shelters is a random variable and passengers arrival should be considered according to Poisson process. Readers may
follow [6] for the direction.
Acknowledgement
This research was funded by Directorate General of Higher Education of Republic of Indonesia under scheme of Fundamental Research Grant, No. 26/IT3.41.2/L1/SPK/2013.
References
[1] M. Abkowitz, R. Josef, J. Tozzi and M. K. Driscoll, Operational feasibility of timed transfer in transit systems, J. Transp. Eng. 113 (1987), 168-177.
[2] M. Advani and G. Tiwari, Review of capacity improvement strategies for bus transit service, Indian J. Transp. Manag. October-December (2006), 363-391.
[3] C. Sun, W. Zhou and Y. Wang, Scheduling combination and headway optimization of bus rapid transit, J. Transp. Sys. Eng. IT 8(5) (2008), 61-67.
[4] M. Dessouky, R. Hall, A. Nowroozi and K. Mourikas, Bus dispatching at timed transfer transit stations using bus tracking technology, Technical Report, Department of Industrial and Systems Engineering, University of Southern California, Los Angeles, CA 90089-0193, 1999.
[5] D. He, Y. Yan, M. Wang and Z. Qiu, Research on the regional bus dispatching problem, Proceedings of the 8th International Conference of Chinese Logistics and Transportation Professionals - Logistics: The Emerging Frontiers of Transportation and Development in China, 2009, pp. 4713-4719.
[6] G. Riano and J. C. Acero, A stochastic bus dispatching model, Working Paper No. 1992/33, Universidad de Los Andes, Colombia, 2004.
[7] J. P. Rodrigue, The Geography of Transport Systems, Routledge, 2013.