TESTING MARKET SPATIAL DIFFERENTIALS:
AN APPLICATION TO INDONESIA’S
INTRANATIONAL RICE PRICE
NUGROHO ARI SUBEKTI
POSTGRADUATE SCHOOL
BOGOR AGRICULTURAL UNIVERSITY BOGOR
STATUTORY DECLARATION
I, Nugroho Ari Subekti, hereby declare that the master thesis entitled
―Testing Spatial Market Differentials: An Application to Indonesia‘s Intranational Rice Price‖ is my original work under the supervision of Advisory Committe and has not been submitted in any form and to another higher education institution. This thesis is submitted independently without having used any other source or means stated therein. Any source of information originated from published and unpublished work already stated in the part of references of this thesis.
Herewith I passed the thesis copyright to Bogor Agricultural University.
Bogor, August 2015
Nugroho Ari Subekti
RINGKASAN
NUGROHO ARI SUBEKTI. Pengujian Perbedaan Pasar Secara Spasial: Penerapan Pada Harga Beras Domestik di Indonesia. Dibimbing oleh IMAN SUGEMA and FLORIAN PLOECKL.
Karya tulis ini mempelajari faktor-faktor dari perbedaan harga beras selama musim panen dan selama Bulan Ramadhan dan Hari Raya Idul Fitri. Tulisan ini juga mempelajari jumlah dari perubahan harga beras berdasarkan data yang diambil pada pasar beras eceran selama periode tahun 2008 hingga tahun 2013. Dengan menggunakan analisis regresi Pooled Least Squares (PLS), ditemukan bahwa selama periode masa panen, perbedaan harga beras antar propinsi terkait dengan perbedaan karakteristik antar provinsi seperti population, total produksi beras, pendapatan per kapita, jumlah dari perubahan harga beras dan jarak. Namun demikian, jarak tidak mempengaruhi secara signifikan terhadap jumlah dari perubahan harga beras. Disamping itu, migrasi risen tidak memiliki dampak pada harga beras selama musim panen dan selama Ramadhan dan Idul Fitri.
Daerah di Pulau Sumatra dan grup dari pulau-pulau di area Indonesia tengah memiliki harga beras yang cenderung lebih tinggi dari harga beras di daerah Pulau Jawa dan cenderung memiliki kondisi harga beras yang lebih stabil dibandingkan di Pulau Jawa. Selanjutnya, frekuensi perubahan harga beras cenderung turun sejak tahun 2008. Di satu sisi, variabel interaksi (variabel jarak dan variabel dummy pulau mempengaruhi perbedaan harga beras selama periode musim panen khususnya di Pulau Sumatra dan Pulau-pulau di kawasan Indonesia tengah. Di sisi lain, variabel interaksi antara pendapatan perkapita dan dummy tahun mempengaruhi secara signifikan semua variabel bebas.
SUMMARY
NUGROHO ARI SUBEKTI. Testing Spatial Market Differentials: An Application to Indonesia‘s Intranational Rice Price. Under supervision of IMAN SUGEMA and FLORIAN PLOECKL
This paper examines the determinants of rice price differences during harvest seasons and the Ramadhan and Eid period. It also studies the frequency of rice price changes in Indonesian cities using data from retail rice markets during the period of 2008–2013. Using Pooled Least Squares (PLS) regression analysis, we found that during harvest season, rice price differences between provinces respond to variations in provincial characteristics, such as population; total rice production, per capita income; frequency of rice price changes (price volatility) and distance. However, distance was not found to be statistically significant influence frequency of the rice price changes. In addition, recent migration does not significantly affect rice prices during harvest season and Ramadhan and Eid period.
Regions in Sumatra Island and Middle Island group have consistently higher rice prices and lower number rice price changes than regions in Java Island group. Furthermore, rice price changes have fallen since 2008. On the one hand, the interaction variables (distance and island dummies) influence rice price disparity during harvest season particularly in Sumatra Island and Middle Island group. On the other hand, the interaction variable between percapita income and year dummies are significant in any regression.
© Copyright belongs to IPB, 2015
All Rights Reserved Law
Prohibited quoting part or all of this paper without including or mentioning the source. The quotation is only for educational purposes, research, scientific writing, preparation of reports, writing criticism, or review an issue; and citations are not detrimental to the interests of IPB
TESTING MARKET SPATIAL DIFFERENTIALS:
AN APPLICATION TO INDONESIA’S
INTRANATIONAL RICE PRICE
NUGROHO ARI SUBEKTI
Master Thesis
as a requirement to obtain a degree Master of Science in Economics Program
POSTGRADUATE SCHOOL
BOGOR AGRICULTURAL UNIVERSITY BOGOR
Thesis Title : Testing Market Spatial Differentials:
An Application to Indonesia‘s Intranational Rice Price Name : Nugroho Ari Subekti
NIM : H151120381
Approved
Advisory Committee,
Dr. Iman Sugema Dr. Florian Ploeckl
Agreed
Coordinator of Major Economics Dean of Postgraduate School
Dr. Lukytawati Anggraeni, SP, M.Si Dr. Ir. Dahrul Syah, MScAgr
ACKNOWLEDGEMENTS
I would like to thank my supervisors, Dr. Florian Ploeckl and Dr. Iman Sugema, for their aspiring guidance, invaluably constructive criticism and friendly advise during the thesis writing. I am sincerely grateful to them for sharing their truthful and illuminating views on a number of issues related to the thesis.
I am indebted to Niranjala Seimon, Augustine Bhaskarraj, and everyone at the International Student Centre for their continuous support and motivation during my study at The University of Adelaide.
I owe my deepest gratitude to the Ministry of Trade Republic of Indonesia, Bogor Agricultural University, The University of Adelaide, and the Australian Award Scholarship for giving me the opportunity to study my master‘s degree.
I would like to acknowledge Elite Editing for giving me editorial assistance and providing remarkably valuable feedback to improve the quality of my thesis. The editorial intervention was restricted to Standards D and E of the Australian Standards for Editing Practice
I would also like to thank ‗Mbak Ida‘ for helpful discussions; the honours cohort for endless good times; Kahfi ‗sahabatku‘ for making complicated data
easy to analyse; and the rest of my family, especially my wife who cares for my lovely daughter, for their support and encouragement throughout the year.
Bogor, August 2015
TABLE OF CONTENTS
TABLE OF CONTENTS xii
LIST OF TABLES xiii
LIST OF FIGURES xiii
1 INTRODUCTION 1
2 BACKGROUND 2
Food Security Policies 2
Area, Production and Yield 2
Exports and Imports 6
Rice Price 7
Domestic Rice Price 7 Domestic and World Rice Price Temporal Variations 7
Domestic Spatial Rice Price Variation 9
Domestic Rice Price Intervention 11
3 LITERATURE REVIEW 11
Determinants of Price Differences 11
Model Specification 14
Description of the Dataset and Descriptive Statistics 17
4 ESTIMATION AND ANALYSIS 19
5 CONCLUSION 26
REFERENCES 27
LIST OF TABLES
Table 2.1 Indonesia, Annual Rice Exports and Imports (1000 tonnes) 6
Table 2.2 Staple Food Price Variation 10
Table 2.3 Rice Price Coefficient Variation in 2014 11
Table 3.1 Description of the Variables 16
Table 3.2 Descriptive Statistics 18
Table 3.3 Descriptive Statistics, Fixed Variables 18 Table 4.1 Rice Price During Harvest Season Estimated Results 21 Table 4.2 Rice Price During Ramadhan and Eid Period Estimated Results 23 Table 4.3 Frequency of Rice Price Changes Estimated Results 25
LIST OF FIGURES
Figure 2.1 Indonesia Paddy Production (Tonnes) 3 Figure 2.2 Indonesian Paddy Harvested Area (1000 Ha) 3 Figure 2.3 Indonesian Paddy Productivity (Kg/Ha) 4 Figure 2.4 Rice Production Areas in Indonesia in 2013 (1000 tonnes) 5 Figure 2.5 Medium Quality Rice Price, 1969–2002 7 Figure 2.6 Domestic and World Rice Prices, 1969–2002 8 Figure 2.7 Domestic and World Rice Prices, 2001–2011 9 Figure 2.8 Spatial Rice Price Variability 2008–2013 10
1
1
INTRODUCTION
The notion of price convergence refers to the Law of One Price (LOP), according to which in all locations the value of a given good will be the same when quoted in the same currency (Dornbush 1985). An international multi-good version of the LOP is the simplest and strongest form of Purchasing Power Parity (PPP) used in determining the relative value of currencies and the exchange rate. The exchange rate, according to absolute PPP, is equal to the ratio of the foreign price to the domestic of a given aggregate bundle of products. The international PPP literature is the main motivation behind the literature on city price convergence.
Numerous studies have been conducted to investigate the empirical validity of the LOP. However, in cross-country studies price dispersions lean to dwell persistently over time, fading away only relative slowly. In Europe, there is proof of convergence for traded goods, but not for non-traded goods (Rogers 2001). In North America, the volatility of prices among Canadian city pairs is slightly lower than for US city pairs. Rogers (2001) also found that the limit effect on US-Mexican relative prices is larger than the equivalent effect on US-Canadian prices. The general conclusion of these studies is that absolute PPP does not hold for non-traded goods and services, or in the presence of transaction costs and other non-tariff trade barriers (Lafrance & Lawrence 2002).
Previous evidence about the failure of the LOP has led to investigations on the validity of PPP across cities or regions. The benefits of conducting intranational studies of price convergence rather than international studies is the lack of trade barriers and nominal exchange rate fluctuations. Parsely and Wei (1996) estimated 51 commodity prices from 48 cities in the US and found that distance between cities affected differential rates of convergence. They showed that neighbouring cities had higher rates of convergence of relative prices than cities farther apart. Other research has found that transportation costs limit price convergence between US cities (Cecchetti, Mark & Sonora 2002).
In recent years, due to rapid advances in regional cooperation, the examination of market and regional integration has been a primary issue. Intermarket price differentials are one way to measure the degree of market integration. The market is poorly integrated if price differentials are large (in relative terms) and well-integrated if they are small. Price differentials are a primary concern for the Indonesian government, which has an explicit commitment to promoting food price stability.
This study supplements to the literature by providing new evidence on two separate related issues: the determinants of market integration across provinces in Indonesia, and the determinants of price differentials between provinces. It does this by examining rice commodity markets. The thesis attempts to discover the determinants of rice price differences between cities in Indonesia. What are the factors that explain rice price dispersion and the number of rice price changes in Indonesia?
2
price dispersion during the periods of harvest and Eid also the factors which have affect the frequency of rice price alterations.
The thesis is organised as follows: chapter 2 explains the background of rice as a commodity in Indonesia. Chapter 3 contains the literature review and also the model exposition. It describes relevant studies, the dataset and a model specification for testing rice price differences and number of rice price changes in Indonesian cities. Chapter 4 gives the empirical results and chapter 5 presents conclusions.
2 BACKGROUND
Food Security Policies
Price stability and rice self-sufficiency are the essence of Indonesia‘s food security programme. This was based on food availability with twin strategies: price stability and rice self-sufficiency. In order to maintain price stability, in 1967 the government of Indonesia established the Bureau of Logistics (BULOG). The task of BULOG was to maintain stable supplies of rice and other major foodstuffs. It did this first by setting a floor rice price so that the farm gate received a rice price above production costs. Second, during harvest season BULOG bought rice that was not absorbed by the market. Third, to assist in achieving self-sufficiency the government provided significant subsidies through cheap fertiliser, pesticide and financial support during planting season.
Area, Production and Yield
3
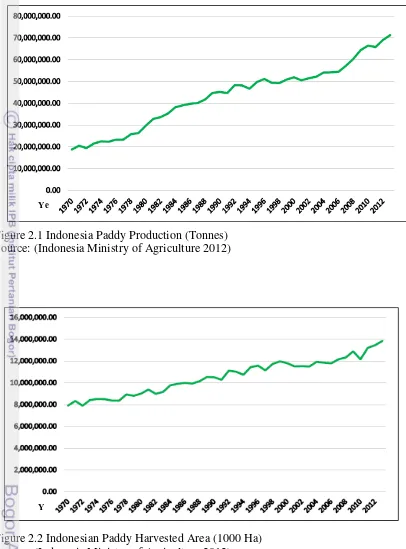
Figure 2.1 Indonesia Paddy Production (Tonnes) Source: (Indonesia Ministry of Agriculture 2012)
Figure 2.2 Indonesian Paddy Harvested Area (1000 Ha) Source: (Indonesia Ministry of Agriculture 2012)
4
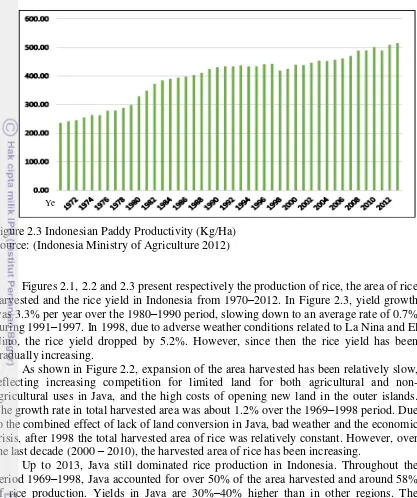
Figure 2.3 Indonesian Paddy Productivity (Kg/Ha) Source: (Indonesia Ministry of Agriculture 2012)
Figures 2.1, 2.2 and 2.3 present respectively the production of rice, the area of rice harvested and the rice yield in Indonesia from 1970–2012. In Figure 2.3, yield growth was 3.3% per year over the 1980–1990 period, slowing down to an average rate of 0.7% during 1991–1997. In 1998, due to adverse weather conditions related to La Nina and El Nino, the rice yield dropped by 5.2%. However, since then the rice yield has been gradually increasing.
As shown in Figure 2.2, expansion of the area harvested has been relatively slow, reflecting increasing competition for limited land for both agricultural and non-agricultural uses in Java, and the high costs of opening new land in the outer islands. The growth rate in total harvested area was about 1.2% over the 1969–1998 period. Due to the combined effect of lack of land conversion in Java, bad weather and the economic crisis, after 1998 the total harvested area of rice was relatively constant. However, over the last decade (2000 – 2010), the harvested area of rice has been increasing.
Up to 2013, Java still dominated rice production in Indonesia. Throughout the period 1969–1998, Java accounted for over 50% of the area harvested and around 58% of rice production. Yields in Java are 30%–40% higher than in other regions. The dominant role of Java in rice production is attributable to the fact that most of the irrigated area is located in Java, and as a consequence rice intensification programmes took place in this region.
5
Figure 2.4 Rice Production Areas in Indonesia in 2013 (1000 tonnes) Source: (Indonesia Ministry of Agriculture 2012)
6
Exports and Imports
Today, Indonesia has become one of the biggest nett rice importers in the world. Rice imports have risen steadily since Indonesia declared rice self-sufficiency in 1984. Imports of rice were 24,000 tonnes in 1985, but in the following year it climbed to 131,000 tonnes (see Table 2.1). The subsequent increase in imports was a combined result of increased domestic demand and various domestic supply shocks. In 1997–1998, total rice imports rose dramatically because of the economic crisis and severe drought. During the last decade (2000 – 2013), the rice imports fluctuate ranging from the lowest at about 250 thousand tonnes in 2008 and the highes at around 3.5 million tonnes in 2001.
Table 2.1 Indonesia, Annual Rice Exports and Imports (1000 tonnes)
Year Exports Imports Year Exports Imports
7
Rice Price
Domestic Rice Price
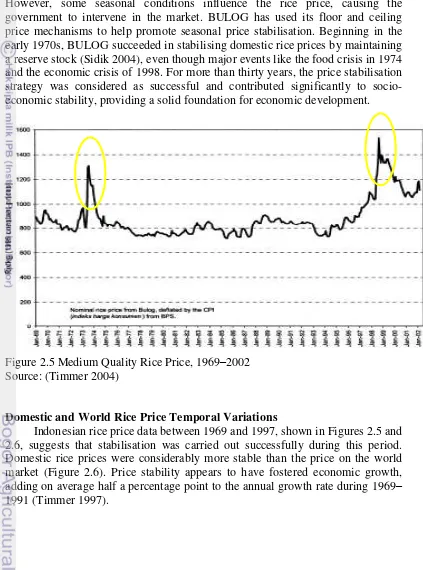
The rice price in Indonesia is basically determined on the open market. However, some seasonal conditions influence the rice price, causing the government to intervene in the market. BULOG has used its floor and ceiling price mechanisms to help promote seasonal price stabilisation. Beginning in the early 1970s, BULOG succeeded in stabilising domestic rice prices by maintaining a reserve stock (Sidik 2004), even though major events like the food crisis in 1974 and the economic crisis of 1998. For more than thirty years, the price stabilisation strategy was considered as successful and contributed significantly to socio-economic stability, providing a solid foundation for socio-economic development.
Figure 2.5 Medium Quality Rice Price, 1969–2002 Source: (Timmer 2004)
Domestic and World Rice Price Temporal Variations
8
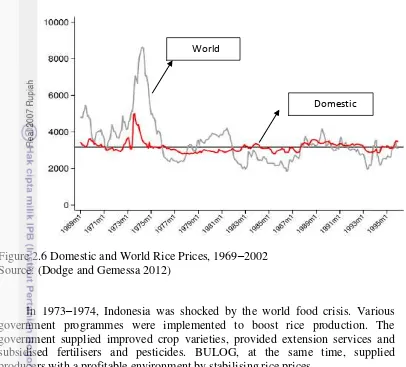
Figure 2.6 Domestic and World Rice Prices, 1969–2002 Source: (Dodge and Gemessa 2012)
In 1973–1974, Indonesia was shocked by the world food crisis. Various government programmes were implemented to boost rice production. The government supplied improved crop varieties, provided extension services and subsidised fertilisers and pesticides. BULOG, at the same time, supplied producers with a profitable environment by stabilising rice prices.
However, following the economic crisis that affected Indonesia in 1997, the government of Indonesia deregulated trade of food crops and liberalised trade of commodities including rice. Monopoly rights that had been enjoyed by BULOG were abolished by mid-1998. BULOG‘s tasks including trade policy, stockholding and domestic market purchases to set and enforce ceiling and floor prices could no longer be undertaken (Dawe 2008). This situation affected domestic rice prices, which rose above import parity, fuelled by panic buying and speculative hoarding. After the country‘s recovery, rice prices stayed about 30% above the world price and slightly above the real level of the period of rice price stability from the mid-1970s to the mid-1990s (see Figure 2.7).
9
Figure 2.7 Domestic and World Rice Prices, 2001 - 2011 Source: (Dodge and Gemessa 2012)
The global community was shocked by soaring food prices in 2007, after three decades of relatively stable price levels. The global crisis also affected domestic rice prices. By January 2008, domestic prices stood at 94% above their January 2004 level, and 27% above the world price.
Domestic Spatial Rice Price Variation
Indonesia is geographically dispersed and its many regional economies are poorly integrated. Economic diversity and geographical conditions affect price differences between regions. Inconsistent market behaviour can indicate inefficient distribution systems, since logistics and transportation problems have an enormous effect on the price and availability of rice.
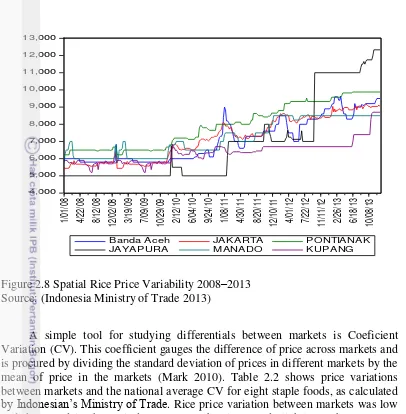
Figure 2.8 presents rice price series in six different cities representing the six different islands in Indonesia. Price differences between regions are quite high. However, regional prices tend to move together in the long term, and price stability is maintained over time.
10
Figure 2.8 Spatial Rice Price Variability 2008–2013 Source: (Indonesia Ministry of Trade 2013)
A simple tool for studying differentials between markets is Coeficient Variation (CV). This coefficient gauges the difference of price across markets and is procured by dividing the standard deviation of prices in different markets by the mean of price in the markets (Mark 2010). Table 2.2 shows price variations between markets and the national average CV for eight staple foods, as calculated
by Indonesian‘s Ministry of Trade. Rice price variation between markets was low and decreased in the period 2008–2011, but increased slightly at about 1.8 per cent in 2008 to around 3.0 percent in 2014.
Table 2.2 Staple Food Coefficient Variation
No. COMMODITY PRICE VARIATION RATIO (PROVINCE TO NATIONAL) MEAN 2008 2009 2010 2011 2012 2013 2014
11
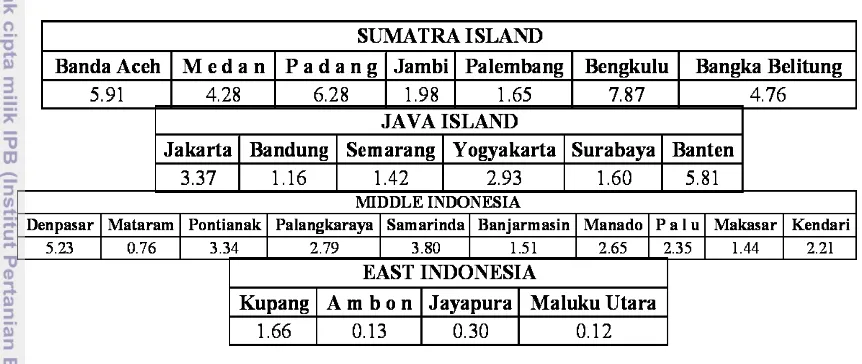
Based on the average value, Table 2.2 shows that the government has succeeded in maintaining stability in staple prices at the national level. It can be seen that the average value of the rice price is 2.3 per cent below the government target value at 2.5 per cent. By contrast, Table 2.3 portrays price variations within regions in 2014, revealing that rice prices are quite different across regions and cities. This suggests that staple food prices do not spatially converge.
Table 2.3 Rice Price Coefficient Variation in 2014
Source: (Indonesia Ministry of Trade 2014)
Domestic Rice Price Intervention
Prior to the 2007 crisis, economists and food experts argued that the private sector and international trade will promote a mechanism to stabilise supply and the rice price (Dorosh 2008). When this failed, the government began making attempts to stabilise prices in 2007 through ad hoc imports by BULOG, and eventually by giving it greater autonomy to conduct stabilisation efforts (McCulloch & Timmer 2008). Since 2009, the private sector has been allowed to export certain rice varieties where the rate of shattering (breaking of rice grain into pieces) is below 5%. It may also import other types of rice where the rate of shattering varies from 5% to 25%. At the same time the RASKIN programme, a rice subsidy for the poor, was expanded to help ameliorate the effects of the rice price hikes on the poor.
3 LITERATURE REVIEW
Determinants of Price Differences
12
here we also consider past research into determinants of spatial price disparities, with emphasis on empirical studies.
Goodwin and Schroeder (1991) examined market cattle in the US, and investigated four factors affecting market integration: distance between markets; the amount of market information reflected in prices in a particular market; the market volume; and the degree of concentration in the packing market. They found that distance is a significant deterrent to market integration. In addition, the meat packing market increased the level of market integration.
Escobal and Cordano (2008) evaluated the effect of investment in infrastructure on market integration for potatoes. They formally addressed the question of the determinants of market integration. They found that distance is important, as well as other factors that are susceptible to policy intervention such as the availability of information and transport and communications infrastructure. Goletti, Ahmed and Farid (1995) studied rice market integration and its determinants in Bangladesh in 64 districts, for the period 1989–1992. Three broad structural elements of market integration were taken into account: the density of paved roads, railway infrastructure, road distance between markets, the number of labour strikes in the area, telephones per capita, density of bank branches; volatility of policy; and differences in production per capita. The authors revealed that the distance between markets, telephone density and labour strikes affected integration negatively. Instead, integration was positively affected market integration.
Marks (2010) provided a historical account of rice market integration in Indonesia over the period 1920–2006 among different cities in the archipelago by using cointegration techniques. Nine cities were put in the study: Jakarta, Semarang and Surabaya in the island of Java, Medan and Palembang in Sumatra, Banjarmasin and Pontianak in Kalimantan and Manado and Makassar in Sulawesi. For many city pairs, they rejected the hypothesis of cointegration: Mears (1961) stated that the only factor that influence the price dispersion among regions in Indonesia is the cost of transport (cited in Marks 2010). In the period 1969–1986, there was a quite rapid adjustment to equilibrium when price differences appeared in different areas. In the subsequent period (1987–2006) alterations were limited, and the efficient functioning of markets was significantly less in this period. Although most markets still reached a long-term equilibrium, the speed of adjustment was slower.
13
Ismet, Barkley and Llewelyn (1998) examined rice market integration over time. They found that government intervention in terms of rice procurement significantly influenced market integration during the post self-sufficiency period (1985–1993) and the entire period 1982–1993. The results indicated that the larger the rice procurement, the higher the degree of market integration, suggesting that the procurement programme significantly affected dynamic price adjustments.
The period following self-sufficiency was a time when national income grew rapidly, generally between 5–8% annually. In this period PCI was found to be positively and significantly associated with market integration. This indicated that economic development encouraged market integration, perhaps reducing the need for government intervention during times of economic expansion, thereby reducing programme costs. The role of BULOG in the rice market may therefore be more important during drought periods or economic downturns. The outcomes for the entire period suggest that the purchases of rice by BULOG had a significant effect on market integration. For the post-self-sufficiency period, sales of rice by BULOG also had a significant positive effect, along with PCI. However, most other variables were not significant.
14
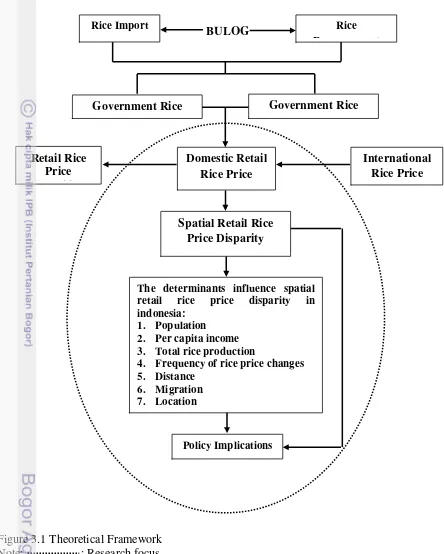
Figure 3.1 Theoretical Framework Note: : Research focus
Model Specification
Following the studies conducted by Varela, Aldaz-Carroll and Iacovone (2013) and Ismet, Barkley and Llewelyn (1998), variables such as total production in each province, PCI and distance may influence the rice price differential
The determinants influence spatial retail rice price disparity in indonesia:
1. Population 2. Per capita income 3. Total rice production
4. Frequency of rice price changes 5. Distance
6. Migration 7. Location
Policy Implications
15
between regions in Indonesia. However, in our model specification we include other variables; namely population in each province, recent migration, and number of rice price changes. In addition, island group dummy variables and year dummy variables are included. We also include variables for interaction between distance and the island group dummies and between PCI and year dummies.
A Pooled Ordinary Least Square (OLS) regression model has been applied to evaluate the determinants of spatial price differences. This is also known as a constant coefficient model, where both intercepts and slopes are constant; where time series data and cross-sectional data are pooled together, thus assuming that there is no significant cross-section or temporal effect. For rice prices during harvest season, our model is as follows:
PHARVESTit = 0 + 1 POP_2010it + 2 PCIit + 3 PROD_TOTit + 4 influence rice price changes NUM_VOLitin the regions:
NUM_VOLit = 0 + 1 POP_2010it + 2 PCIit + 3 PROD_TOTit + + 4 Population, migration and PCI capture demand-push effects. Supply conditions are captured by total production, distance, the frequency of rice price changes and island dummies.
16
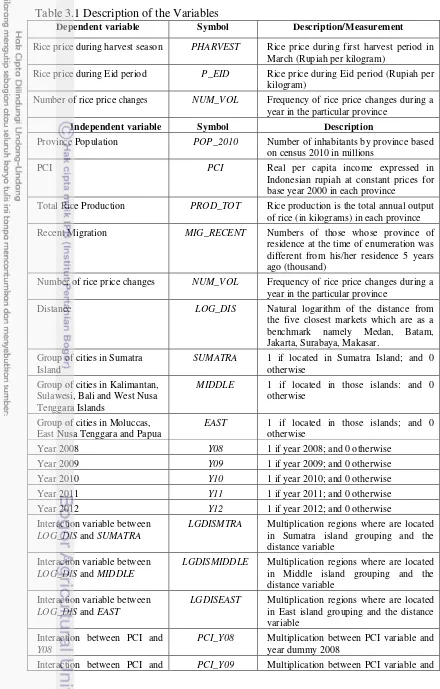
Table 3.1 Description of the Variables
Dependent variable Symbol Description/Measurement
Rice price during harvest season PHARVEST Rice price during first harvest period in March (Rupiah per kilogram)
Rice price during Eid period P_EID Rice price during Eid period (Rupiah per kilogram)
Number of rice price changes NUM_VOL Frequency of rice price changes during a year in the particular province
Independent variable Symbol Description
Province Population POP_2010 Number of inhabitants by province based on census 2010 in millions
PCI PCI Real per capita income expressed in Indonesian rupiah at constant prices for base year 2000 in each province
Total Rice Production PROD_TOT Rice production is the total annual output of rice (in kilograms) in each province Recent Migration MIG_RECENT Numbers of those whose province of
residence at the time of enumeration was different from his/her residence 5 years ago (thousand)
Number of rice price changes NUM_VOL Frequency of rice price changes during a year in the particular province
Distance LOG_DIS Natural logarithm of the distance from the five closest markets which are as a benchmark namely Medan, Batam, Jakarta, Surabaya, Makasar.
LGDISMTRA Multiplication regions where are located in Sumatra island grouping and the distance variable
Interaction variable between
LOG_DIS and MIDDLE
LGDISMIDDLE Multiplication regions where are located in Middle island grouping and the distance variable
Interaction variable between
LOG_DIS and EAST
LGDISEAST Multiplication regions where are located in East island grouping and the distance variable
Interaction between PCI and
Y08
PCI_Y08 Multiplication between PCI variable and year dummy 2008
17
Y09 year dummy 2009
Interaction between PCI and
Y10
PCI_Y10 Multiplication between PCI variable and year dummy 2010
Interaction between PCI and
Y11
PCI_Y11 Multiplication between PCI variable and year dummy 2011
Interaction between PCI and
Y12
PCI_Y12 Multiplication between PCI variable and year dummy 2012
Error term eij Error term capturing all other factors affecting price differences
Description of the Dataset and Descriptive Statistics
Table 3.2 presents the mean, standard deviation, minimum and maximum values across provinces for the principal variables used in this analysis. We use retail rice prices during the period 2008–2013 for 30 capital cities in Indonesia except three provinces including Bangka Belitung, Riau Island and West Papua due to lack of data. There are a great many rice varieties in Indonesia. The chosen variety of rice used in this study is medium quality rice, even though its market name may be different. By choosing a similar quality of rice across regions, it is assumed that any price variability is due to spatial and seasonal effects and not to the presence of physical quality and variety differences in the product.
18
Table 3.3 Descriptive Statistics, Fixed Variables
MEAN SD MINIMUM MAXIMUM
POP_2010 7801.49 10619.80 1038.10 43053.70
DISTANCE 506.83 36.63 0.00 2381.00
RECENT MIGRATION 6.99 16.60 -24.92 39.99
19
the maximum and the minimum values of each variable, showing large rice price differences from province to province. During harvest time, for example, in 2008 the lowest rice price per kilogram was Rp. 4500 and the highest was Rp. 8125, an increase of almost 100%. The highest harvest rice price occurred in 2012 at Rp. 12,000. During the Eid period, the lowest price was in 2010 at Rp. 5000 and the highest rice price reached Rp. 11,843 in 2010. Again, during Eid Mubarak 2010 the rice price differed between regions by more than 100%.
Rice production varies among regions in Indonesia. In general, the average rice yield has increased since 2008 and reached a peak in 2012 of about 2.3 million tonnes. The largest rice crop was approximately 12 million tonnes. The size of the crop may affect the number of rice price changes. In some regions the price tends to fluctuate, while in others prices are stable. For instance in 2011, the minimum number of rice price changes is one but in another place the maximum number of rice price changes is more than one hundred.
As shown in Table 3.2, PCI has been growing gradually in Indonesia since 2008. However, an immense PCI disparity exists between provinces. For instance in 2013, the largest PCI was Rp. 47.7 million. In contrast, the lowest PCI was only Rp. 2.7 million.
This PCI gap creates a migration phenomenon. Some regions may be a labour force destination and others will be abandoned by their residents. The data show (Table 3.3) that the maximum number of residents leaving a region is 24,000 and the maximum number arriving in a region is about 40,000 new persons. The greatest distance is between Jayapura and Surabaya at about 2381 kilometre. A distance of 0 refers to the five main cities as a benchmark.
4
ESTIMATION AND ANALYSIS
This chapter presents the result of the PLS regression analysis. The analysis will be divided into two parts. First, regressions are conducted with three different dependent variables, namely PHARVEST, P_EID and NUM_VOL. Second, we test the result of the PLS by making use of the Robust Standard Errors check. The usual OLS standard errors are inaccurate with clustered panel data when there are cluster effects, and Robust Standard Errors are more accurate when cluster correlations and heteroscedasticity are present (Wooldridge 2012 cited in Vuko and Cular 2014).
20
In order to simplify the identification of independent variables, they will be divided into three different classifications. The first group consists of core independent variables POP_2010, PROD_TOT, PCI, MIG_RECENT, NUM_VOL
and LOG_DIS. The second group includes island dummy variables such as
SUMATRA, MIDDLE and EAST and year dummy variables Y08, Y09, Y10, Y11
and Y12. The last group of variables consists of interaction variables between
LOG_DIS and the island dummy variables to give LGDISMTRA, LGDISMIDDLE
and LGDISEAST, and interactions between PCI and year dummy variables
PCI_Y08, PCI_Y09, PCI_Y09, PCI_Y10, PCI_Y11 and PCI_Y12.
Tables 4.1, 4.2 and 4.3 show combination between result of the PLS regression and Robust Standard Errors for the regressions on PHARVEST, P_EID
21
Table 4.1Rice Price During Harvest Season Estimated Results
Independent
variable Coefficient Std. Error t-statistic p-value
(1) (2) (3) (4) (5)
C (constant) 5602.804*** 542.1496 10.33442 0.0000
POP_2010 0.036536*** 0.012597 2.900370 0.0043
PROD_TOT -0.047572*** 0.013982 -3.402347 0.0008
PCI 0.053008*** 0.006474 8.187771 0.0000
NUM_VOL 8.479534*** 2.782518 3.047432 0.0027
LOG_DIS 245.1244*** 44.11058 5.557043 0.0000
MIG_RECENT -0.561838 3.927162 -0.143065 0.8864
SUMATRA 2516.635*** 592.9720 4.244104 0.0000
MIDDLE 964.1613 379.8524 2.538252 0.0121
EAST 1526.262 4476.482 0.340951 0.7336
LGDISMTRA -200.9904 48.41895 -4.151070 0.0001
LGDISMIDDLE -91.20796 43.51625 -2.095952 0.0377
LGDISEAST -184.2378 660.4519 -0.278957 0.7806
Y08 -2620.510*** 5.526762 -474.1493 0.0000
Y09 -2565.732*** 5.761473 -445.3258 0.0000
Y10 -1941.223*** 12.35299 -157.1460 0.0000
Y11 -1006.074*** 18.56306 -54.19761 0.0000
Y12 -463.8062*** 6.393216 -72.54663 0.0000
PCI_08 -0.013619*** 0.001067 -12.75806 0.0000
PCI_09 -0.013421*** 0.000862 -15.56572 0.0000
PCI_10 -0.004497*** 0.000384 -11.70217 0.0000
PCI_11 0.010960*** 0.000358 30.64635 0.0000
PCI_12 0.006708*** 0.000267 25.08640 0.0000
Observations 180
22
Table 4.1 presents the result of the regression analysis for the rice price during harvest time. As the table shows, the F-statistic of the model is significantly different from zero indicating that a subset of the explanatory variables explains the variation in the rice price during harvest season. The value of the coefficient of determination (R2) indicates that 68% of the variation in rice price during the harvest period is explained by the model. In addition, the adjusted R-square shows that after adjusting for the degrees of freedom the model still explains about 63% of the total variation of the model. In other words, about 37% of the systematic variation of PHARVEST is left unaccounted for by the model which has been captured by the stochastic disturbance term.
The t-ratios for each variable show that the core independent variables
POP_2010, PCI, NUM_VOL and LOG_DIS have positive sign and are statistically significant at the 1% level, since their calculated t-values were greater than the critical t-value. This means that higher values of these variables in regions increase the rice price during the harvest period. For instance, a 1% increase in distance increases the regional rice price per kilogram by about Rp. 254 ceteris paribus. However, variable PROD_TOT has a different sign. It is marked negative and statistically significant at the 1% level. It means that total rice production in each region will decrease the rice price disparity. It is inline to micro economic theory that addition in supply side will create new equilibrium. In this context, total rice production will push rice price to reduce. However,
MIG_RECENT variable does not significantly affect the rice price.
Island dummy variables are significant for SUMATRA and MIDDLE. From the regression, Sumatra Island has rice prices about Rp. 2516 per kilogram higher than Java Island. Midde Island has rice price about Rp. 964 per kilogram higher than Java. These results convince that in fact rice prices in Java Island tend to lower than other islands. All the year dummy variables have negative signs and are significant at the 1% level. This means that rice prices were significantly lower from about Rp. 2620 in 2008 to around Rp. 463 in 2012 than in 2013. In other words, we can say that the rice price rose substantially from 2008–2012 in the aftermath of the economic crisis.
23
Table 4.2 Rice Price During Ramadhan and Eid Period Estimated Results
Independent
variable Coefficient Std. Error t-statistic p-value
(1) (2) (3) (4) (5)
C (constant) 6140.999*** 441.1916 13.91912 0.0000
POP_2010 0.040046*** 0.006104 6.561144 0.0000
PROD_TOT -0.054047*** 0.012733 -4.244798 0.0000
PCI 0.046473*** 0.004236 10.97059 0.0000
NUM_VOL 10.42811* 5.559893 1.875596 0.0626
LOG_DIS 105.3166*** 16.14582 6.522839 0.0000
MIG_RECENT 0.768166 1.764200 0.435419 0.6639
SUMATRA 1848.117*** 153.7274 12.02204 0.0000
MIDDLE 522.8583** 236.3624 2.212105 0.0284
EAST -1010.285 3389.814 -0.298035 0.7661
LGDISMTRA -75.07856 45.99691 -1.632252 0.1046
LGDISMIDDLE 72.74048 47.98977 1.515749 0.1316
LGDISEAST 250.2861 494.2685 0.506377 0.6133
Y08 -2527.537*** 13.11072 -192.7840 0.0000
Y09 -2563.668*** 8.451713 -303.3312 0.0000
Y10 -1730.070*** 30.60091 -56.53654 0.0000
Y11 -1030.431*** 42.34942 -24.33165 0.0000
Y12 -560.5464*** 19.18971 -29.21078 0.0000
PCI_08 -0.013688*** 0.000901 -15.19277 0.0000
PCI_09 -0.014875*** 0.000837 -17.77722 0.0000
PCI_10 -0.002072 0.001510 -1.371440 0.1722
PCI_11 -0.016078*** 0.001078 -14.91027 0.0000
PCI_12 0.004541*** 0.000335 13.56315 0.0000
Observations 180
24
Table 4.2 shows the results of regression on rice prices during the Ramadhan and Eid period. Similar result has been emerged for F-statistic, coefficient of determination (R2) and the adjusted R-square with the regression result on rice prices during harvest season.
As shown by their t-ratios, the core independent variables POP_2010, PCI, NUM_VOL and LOG_DIS have positive sign and are statistically significant coefficient indicates that higher total rice production reduces the rice price during Ramadhan and Eid period. The variables MIG_RECENT, however, does not significantly affect prices.
As with the harvest regression, in SUMATRA and MIDDLE do the island dummy have a significant value. On the one hand, Sumatra has a higher average rice price during the period of around Rp. 1848 than Java Island. On the other hand, MIDDLE has a higher average rice price during the Eid period of around Rp. 522 than Java island. Also as with the harvest regression, the year dummies have negative coefficients and are all significant at the 1% level except for 2012 which has a level of significance of 10%. This means that from 2008–2012 the rice price was lower on average than the rice price in 2013. Again, the largest price rises were after 2009 following the food crisis.
25
Table 4.3 Frequency of Rice Price Changes Estimated Results
Independent
variable Coefficient Std. Error t-statistic p-value
(1) (2) (3) (4) (5)
C (constant) 77.91727*** 6.084935 4.185511 0.0000
POP_2010 -0.001426*** -4.233397 -4.878401 0.0000
PROD_TOT 0.002637** 2.579378 2.018988 0.0452
PCI -0.000569** -1.412984 -2.342307 0.0204
LOG_DIS -1.831962 1.919343 1.507649 0.1336
MIG_RECENT 0.181146*** -4.545900 -3.454814 0.0007
SUMATRA -53.24870** -4.429071 -2.597971 0.0103
MIDDLE -59.43433 0.574771 0.672165 0.5025
EAST 33.65754 0.017271 0.011591 0.9908
LGDISMTRA 0.037977 0.465633 0.254396 0.7995
LGDISMIDDLE 1.100725* -1.515729 -1.715037 0.0883
LGDISEAST -12.35744*** -0.268616 -4.324450 0.0000
Y08 -1.676462*** -0.160729 -4.687127 0.0000
Y09 -1.004559*** 0.767302 18.24435 0.0000
Y10 4.786582*** 1.127987 25.07464 0.0000
Y11 7.012194*** 0.406702 5.709778 0.0000
Y12 2.526135 0.029983 0.353209 0.7244
PCI_08 1.78E-05 0.023197 0.371607 0.7107
PCI_09 1.35E-05*** 0.541405 9.689521 0.0000
PCI_10 0.000304*** 0.393558 15.67703 0.0000
PCI_11 0.000213*** 0.073382 7.808865 0.0000
PCI_12 3.85E-05*** 18.61595 4.185511 0.0000
Observations 180
Source: (Author‘s calculation from PLS Regression and Robust Standard Error)
The results were quite different from the previous regressions. Overall,
26
significant at the 5 % level. This results mean that these variables have an effect on frequency of the rice price volatility. The negative sign for POP_2010 and PCI
show that population and per capita income do not increase the number of rice price changes. In other words, the demand side factors will not drive rice price volatility. It could happen since the characteristic of consumption tend to constant. However, PROD_TOT and MIG_RECENT have an effect on rice price volatility increasing. This result indicates that higher rice production will ceteris paribus
promote rice price changes. In addition, the addition of population in some regions also will push rice price volatility among regions in Indonesia. It can be deduced that the amount of the rice production and the migration are the main factors rising the number of rice price changes.
The rice price is more stable away from Java Island, since the signs of the coefficients on the island dummies SUMATRA is negative and significant at the 5% level. It can be said, for instance, that in Sumatra region rice price is more stable than that of Java with an average of 53 fewer rice price changes. It is supported by the results on the variable interactions between distance and island dummies. Two interaction variables namely LGDISMIDDLE and LGDISEAST are statistically significant at level 10%. On the one hand, distance in middle island group is significantly promoting the frequency of rice price changes. On the other hand, distance in east island group will reduce the number of rice price changes.
The year dummies captured that the frequency of rice price changes tend to increase during the research period. It can be seen from the coefficient value that the values alter from negative to positive and statistically significant except in 2012. In other word, the rice price volatility occured and tended to rise. However, during research period, PCI does not have a role to influence the frequency of rice price changes. The result of the variable interaction between PCI and year dummies portray that even though the result are significant but the values are very small to promote the rice price volatility.
5
CONCLUSION
In this thesis, we have studied the determinants of rice price differences and frequency of rice price changes in Indonesia. In a context where commodity prices have been changing rapidly, it is particularly crucial for countries like Indonesia that are abundant in natural resources to understand what factors influence rice price differentials and price volatility. On the one hand, this will allow the government to monitor rice price differences across regions using appropriate measures. On the other hand, it will allow the government to create policies to limit rice prices and rice price volatility. We deliver some light explanation on the drivers of the rice price differences and the number of rice price changes and our results can be summarized as follows.
27
the price during the harvest season. Regions in Sumatra have to pay a higher price for rice compared to those in Java Island. It is clear that the difference of quality infrastructure influence the rice price gap besides the rice production differentiation among regions in Indonesia.
The frequency of rice price changes, a volatility measure, are explained by demand side factors, including population and recent migration. On the supply side, total production in a region and the distance are the main determinants of the number of rice price changes. It can be said that the level of rice production and the distance are the key factors that influences rice price volatility in regions in Indonesia. Interestingly, demand side factors including population and recent migration will reduce the number of rice price changes among regions in Indonesia.
Corresponding with the core independent variables results, cities in Sumatra Island have higher but more stable rice prices than those on Java Island. We argue that the distance creates the rice price higher than rice price in Java island. In addition, the rice price stability exist because of the demand of rice is lower than in Java island. It is captured by the number of population and migration where majority of population live in Java island (at around two third) and the propensity of people move to Java island. The rice price differential and the frequency of rice price changes have tended to decrease since 2008. Interaction terms (distance and island grouping, PCI and year dummies) have no significance for rice price differentials and rice price changes.
Our analysis points towards two important policy implications. First of all, it is importance to invest in infrastructure, portraying that the limitations generated by remoteness and geography can be reduced by rising the infrastructure quality
— which can be obtained through improvements in the investment climate to bolster private investment and through investments in public works. Apart from the well-known direct effects that better infrastructure has on growth and development, by contributing to better integrated markets, better infrastructure: reduces price instability; decreases the costs of government intervention; and increases efficiency.
Secondly, the importance of strengthening the farmers productivities and their capacities as a significant means not only to increase heir livelihoods, but also as an instrument to push more efficient markets with faster supply responses to changes in prices.
REFERENCES
Cecchetti, SG, Mark, NC & Sonora, RJ 2002, ‗Price index convergence among United States cities‘, International Economic Review, vol. 43, no. 4, pp. 1081–1099. Retrieved May 5, 2014, from http://www.jstor.org/stable/826961.
28
Dorosh, PA 2008, ‗Regional trade and food price stabilization in south Asia: policy responses to the 2007–08 world price shocks‘, The Pakistan Development Review, vol. 47, no. 4, pp. 803–813.
Dodge, E & Gemessa, S 2012, ‗Food security and rice price stabilization in Indonesia: analysis of policy responses‘, Master in Public Administration Thesis, Harvard University.
Dawe, D 2008, ‗Can Indonesia trust the world rice market?‘, Bulletin of Indonesian Economic Studies, vol. 3, pp. 312–326.
Escobal, JA & Cordano, AV 2008, ‗Market integration for agricultural output
markets in Peru: the role of public infrastructure‘, Quarterly Journal of International Agriculture, vol. 47 no.1, pp. 25-47
Goodwin, BK & Schroeder, TC 1990, ‗Testing perfect spatial market integration: an application to regional U.S. cattle markets‘, North Central Journal of Agricultural Economics, vol. 12, no. 2, pp. 173–186.
Goletti, F, Ahmed, R & Farid, N 1995, ‗Structural determinants of market integration: the case of rice markets in Bangladesh‘, The Developing Economies, vol.33, no. 2, pp. 196–198.
Indonesia Ministry of Trade 2006, ‗Kajian Sistem Distribusi Yang Efisien dan
Efektif Secara Nasional’.
______ 2014, ‗Indikator Kinerja Utama Kementerian Perdagangan Republik Indonesia Desember 2014‘.
Indonesia Ministry of Agriculture, 2012, Produktivitas padi, produksi beras dan
area produksi padi Retrieved 5 May 2014 from
http://aplikasi.pertanian.go.id/bdsp/hasil_kom.asp
Ismet, M, Barkley, PA & Llewelyn, V 1998, ‗Government intervention and market integration in Indonesian rice markets‘, Agricultural Economics,
vol. 19, pp. 283–295.
Lafrance, R & Lawrence, S 2002, ‗Purchasing-power parity: definition,
measurement, and interpretation‘,Bank of Canada Review, Autumn, pp. 27–33. Retrieved 5 May 2014, from http://www.bankofcanada.ca/wp-content/uploads/2010/06/
lafrance_e.pdf.
McCulloch, N & Timmer, CP 2008, ‗Rice policy in Indonesia: a special issue‘,
Bulletin of Indonesia Economic Studies, vol. 44, no. 1, pp. 33–44.
Marks, D 2010, ‗Unity or diversity? On the integration and efficiency of rice markets in Indonesia, c 1920–2006‘, Explorations in Economic History,
vol. 47, pp. 310–324.
Parsley, DC & Wei, SJ 1996, ‗Convergence to the law of one price without trade barriers or currency fluctuations‘, The Quarterly Journal of Economics,
vol. 1, pp. 1211–1236. Retrieved 5 May 2014, from http://jstor.org/stable/2946713.
Rogers, JH 2001, ‗Price level convergence, relative prices, and inflation in Europe‘,International Finance Discussion Papers, No 699, Board of Governor of Federal Reserve. Retrieved 5 May 2014, from
https://www.piie.com/publications/wp/01-1.pdf.
29
Timmer, CP 1997, ‗Building efficiency in agricultural marketing: the long run role of BULOG in the Indonesian food economy‘, Journal of International Development, vol. 9, no. 1, pp. 133–145.
______ 2004, ‗Food Security in Indonesia: current challenges and the long-run
outlook‘, Center for Global Development. Retrieved 5 May 2014, http://www.google.com.au/url?sa=t&rct=j&q=&esrc=s&source=web&cd= 1&cad=rja&uact=8&ved=0CBsQFjAAahUKEwiDm4r1-
United States Departement of Agriculture 2015, ‘Indonesia Milled Rice Imports
by Year’, Retrieved 5 May 2015, from
http://www.indexmundi.com/agriculture/?country=id&commodity=milled-rice&graph=imports
Varela, G, Aldaz-Carroll, E & Iacovone, L 2013, ‗Determinants of market integration and price transmission in Indonesia‘, Journal of Southeast Asian Economies, vol. 30, pp. 19–44.
30
BIOGRAPHY
Author was born in Kulon Progo on 6th September 1987 as a fourth child of Mrs. Sumaryati and Mr. Tukiyo. The author pursued his undergraduate study in Economic Development, Diponegoro University and graduated on 2004. In 2012, the author was accepted in a double degree program between Master of Science in Economics, Bogor Agricultural University, and Master of Applied Economics, The University of Adelaide, Australia, funded by the Ministry of Trade RI and the Australia Award Scholarships.