The Impact of Solvent of Absorption CO
2
from
Biogas Vinasse
Dewi Astuti Herawati
*, D. Andang Arif Wibawa
+, Utya Fitriyawati
**#Department of Chemical Engineering, Setia Budi University
University of South Java, Surakarta, Jawa Tengah, Indonesia [email protected]
+
Health Sciences faculty, Setia Budi University University of Central Java, Surakarta, Jawa Tengah, Indonesia
** Graduate Student, Chemical Engineering, Setia Budi University
Abstract
—
Reduced energy reserves that occurred in Indonesia today, it needed a new source of alternative energy. Biogas is one of the alternative energy sources.Typical
biogas contains 50
–
65% methane (CH4), 30
–
45%
carbon dioxide (CO2), moisture and traces of
hydrogen sulphide (H2S).
Purification of biogas done to remove the impurities (inhibitor) on biogas such as carbon dioxide (CO2). Chemical absorption involvesformation of reversible chemical bonds between the solute and the solvent. Chemical solvents generally employ either aqueous solutions of alkaline salts (i.e. sodium, potassium and calcium hydroxides)
.
In the process of purification chosen liquid NaOH, KOH and Ca(OH)2 because theirs asabsorbent material is highly reactive with CO2. This study
aims to determine the The CO2 absorption using NaOH,
Ca(OH)2and KOH with the same consentration ( 15 % ).
Absorption method used is missed biogas in the ` alkaline solution.The results showed that the absorption by using 15 % KOH concentration produced the higest CO2absorption
with the lowest CO2 content and the highest content of
methane. The KOH solution can increased the CH4content of
biogas 70,3 % from 33,64 to 57,29 % by volume.The absorption of CO2content of biogas was 100 % from 30,18 %
to 0 % by volume.The NaOH solution can increased the CH4
content of biogas 67,07 % from 55,37 to 82,56 % by volume.The absorption of CO2content of biogas was 100 %
from 42,33 to 0 % by volume . The absorption of CO2
content usage Ca(OH) solvent was the lowest from the others.
Key words–absorption, CO2, CH4, Biogas
I. INTRODUCTION
Reduced energy reserves that occurred in Indonesia today, it needed a new source of alternative energy. Biogas is one of the alternative energy sources. Biogas is sustainable energy source that contains 50-75% methane gas, 30-50% carbon dioxide, small amounts of other gases (CO, N2, H2, H2S, O2),
depending on the substrate [4-5] .The high of CO2content of
biogas would interefere in the combustion process. Chemical absorption involves formation of reversible chemical bonds between the solute and the solvent. Chemical solvents generally employ either aqueous solutions of alkaline salts (i.e.
sodium, potassium and calcium hydroxides) [7]. In the process of purification chosen liquid NaOH, KOH and Ca(OH)2 because theirs as absorbent material are highly
reactive with CO2. . Some authors studied the purification of CO2 content by absorption usage NaOH solvent increased
CH4content from 49,95 to 64,56 % of volume [2]. According
[6] studied that absorption CO2 content by added 2 M lime
water (Ca(OH)2), would increase Metane content from 44,814
to 69,871 % in porous of nozel. Methode of decreasing CO2
content by absorption usage KOH solvent would increase usage KOH solvent would increase CH4 from 15 to 75 %
volume [3].This study aims to determine efficiency of CO2
reduction by the CO2absorption using NaOH, Ca(OH)2and
KOH solvent on the 15 % consentration .
II. EXPERIMENTAL
A. RawMaterial
Raw materials used in this study were (a)Biogas from alcohol fermentation waste water (b) 15 % NaOH solution (c) 15 % KOH solution ( d) 15 % Ca(OH)2 solution.
.
B. Method Experiment
Biogas were produced by anaerobic fermention alkohol industrial waste water for 49 day. Once day production of biogas was measured through the water manometer and those were passed in the alkaline absorbent 500 mL solution and 15% concentration. Biogas were analyzed CO2content and
CH4content before entering the absorber solution and after
exit absorbent solution once every 7 days. The CH4and CO2
concentration was analyzed using Gas Chromatography Shimadzu GC 14B, with SUS Packed Column Porapak Q, FID detector. The schematic diagram of experimental set up is shown in Fig. 1.
Page 75 of 436
T
T
1
2
3 4
5 3 4
T
3
Fig 1. Schematic of absorbtion CO2of biogas
III. RESULTS AND DISCUSSIONS
Production rate of biogas
Microorganisme was adapted in another growth medium at the beginning of production biogas. So they did not grow very well. At the tenth day microorganism can be degradation anerobic an organic material and produced biogas. Degradation anaerobic has four phase are hidrolysis, acidogenesis, acetogenesis and metanogenesis. Biogas production was processed during fermentation as well as the aviability of nutrition or substrate.
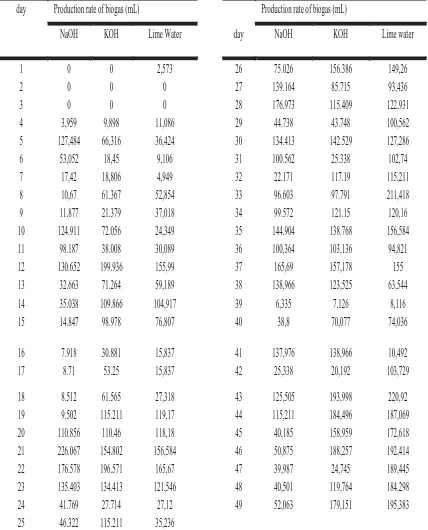
Production rate of biogas was showed at table 1.
Table 1. Production rate of biogas during the anaerobic fermentation
day Production rate of biogas (mL) Production rate of biogas (mL) NaOH KOH Lime Water day NaOH KOH Lime water
1 0 0 2,573 26 75.026 156.386 149,26 2 0 0 0 27 139.164 85.715 93,436 3 0 0 0 28 176.973 115.409 122,931 4 3,959 9,898 11,086 29 44.738 43.748 100,562 5 127,484 66,316 36,424 30 134.413 142.529 127,286 6 53,052 18,45 9,106 31 100.562 25.338 102,74 7 17,42 18,806 4,949 32 22.171 117.19 115,211 8 10,67 61.367 52,854 33 96.603 97.791 211,418 9 11.877 21.379 37,018 34 99.572 121.15 120,16 10 124.911 72.056 24,349 35 144.904 138.768 156,584 11 98.187 38.008 30,089 36 100,364 103,136 94,821 12 130.652 199.936 155,99 37 165,69 157,178 155 13 32.663 71.264 59,189 38 138,966 123,525 63,544 14 35.038 109.866 104,917 39 6,335 7,126 8,116 15 14.847 98.978 76,807 40 38,8 70,077 74,036
16 7.918 30.881 15,837 41 137,976 138,966 10,492 17 8.71 53.25 15,837 42 25,338 20,192 103,729 18 8.512 61.565 27,318 43 125,505 193,998 220,92 19 9.502 115.211 119,17 44 115,211 184,496 187,069 20 110.856 110.46 118,18 45 40,185 158,959 172,618 21 226.067 154.802 156,584 46 50,875 188,257 192,414 22 176.578 196.571 165,67 47 39,987 24,745 189,445 23 135.403 134.413 121,546 48 40,501 119,764 184,298 24 41.769 27.714 27,12 49 52,063 179,151 195,383 25 46.322 115.211 35,236
Gas production of CO2
Biogas was passed to each absorber (NaOH, KOH and Ca(OH)2at the once day. Biogas were analyzed CO2content
and CH4content before entering and after
exit the alkaline
absorbent solution every 7 days. The result can showed at table 2.
Table. 2. CO2content for Adsorber Solvent every 7 Day
Day
% volume CO2
NaOH solvent KOH solvent Lime water
in out in out in out
7 22,783 0,000 30,176 0,000 25,149 3,113
14 19,746 0,000 24,323 3,121 24,503 6,825
28 18,578 4,618 26,590 2,128 26,248 24,939
35 42,714 0,000 43,539 0,000 28,201 16,510
49 26,970 0,000 26,056 6,655 32,252 1,385
According to the table 2 it can be seen that CO2content of %
volume at the time of entry high. This can be caused by microbial activity which is only slightly producing methane gas so that the amount of CO2increases, whereas the current
decline is because bacteria tend to produce more methane that is supported with a pH optimum of about 6 - 7 The process of methanogenesis can not run optimally, proven the accumulated volume generated by these variables only slightly. Can also be caused due to this variable hydrolysis process (decomposition of organic polymers) goes up and then proceed with the process of acidogenesis and acetogenesis. The process of acidogenesis is the decomposition of organic monomers into acid - an organic acid and alcohol. In this process, the organic monomer is further described by acidogenik bacteria into an organic acid into formic acid, acetic, butyric, propinoat, lactate, ammonia, and also produced CO2, H2 and ethanol. Acetogenesis process is the change in
the organic acid and the alcohol into acetic acid. In this process, organic acids and ethanol compounds described acetogenic bacteria such as formic acid, acetate, CO2and H2.
At each phases of anerobic digestion were produced CO2gas ,
so causing the high of CO2 content. All adsorbent have
decreased of CO2content The most excellent adsorbent in the
first week of NaOH and KOH, and the absorption of CO2by
the second week of NaOH, and the most absorption of CO2
usage lime water in the first week is 87.622%. In the next week on the absorption of CO2 adsorbent may decline to
saturation of the adsorbent and can not absorb CO2too much.
It can also be caused to the influence of the reaction between CO2to produce the adsorbent can decrease CH4or other gases .
Page 76 of 436
Gas production of CH4
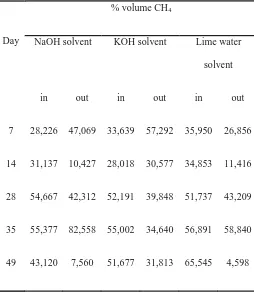
Based on table 3 below it can be seen that the levels of CH4
produced in each bioreactor always increase. At the 28thuntil the 49thlevels of CH4are stable. It is also supported by the pH
in the bioreactor was 7 so that bacteria capable of producing methane CH4. At the time of CH4into the adsorbent there is
an increase and decrease in this case due to the influence of temperature and saturation of the adsorbent. This reaction was represention its below [6].
2NaOH + CO2 → Na2CO3 + H2O
Ca(OH)2 + CO2 → CaCO3 + H2O
2 KOH + CO2 → K2CO3 + H2O
Effect of ambient temperature can affect the CH4 content to
decreased levels of adsorbent used in the form of a solution, the solvent used to dissolve the adsorbent can evaporate and it can cause decreasing the CH4content.
Table 3. Change of CH4content at biogas production
Day
% volume CH4
NaOH solvent KOH solvent Lime water
solvent
in out in out in out
7 28,226 47,069 33,639 57,292 35,950 26,856
14 31,137 10,427 28,018 30,577 34,853 11,416
28 54,667 42,312 52,191 39,848 51,737 43,209
35 55,377 82,558 55,002 34,640 56,891 58,840
49 43,120 7,560 51,677 31,813 65,545 4,598
IV. CONCLUSIONS
NaOH and KOH solution was able to reduce CO2levels
as much as 100% of the biogas produced the 7th day of each were 201 mL and 112 mL. At day 14 NaOH solution able to reduce CO2content as much as 100% with a total volume of
444 mL biogas. The biogas was decreased CO2consentration
as much as 100% by NaOH solvent. Lime water ( Ca(OH)2solution was able to reduce the CO2content as much
as 87.62%. The Absorption ability of NaOH solven and KOH solvent is almost the same. NaOH absorber solution is
able to reduce levels of CO2 are the best, so raise the CH4
content from 55,377 to 82.53% volume in the 5th weeks biogas production. Lime water to reduce the CO2content is
less effective because it produces vapors can reduce the CH4
content.
V. ACKNOWLEDGMENTS
The authors thank University of Setia Budi and Indonesian Ministry of Higher Education via Hibah Bersaing 2014 grant for financial support.
REFERENCES
[1] APHA,1995, Standard Methods for Examination of Water and Wastewater, 19th Edition. American Public Health Assosiaction,
Washington DC.
[2] Anggreini Fajar PL, Wirakartika M, S.R.Juliastuti, dan Nuniek Hendrianie, (2012). Penurunan Kadar CO2 dan H2S Pada Biogas
Dengan Metode Adsropsi Menggunakan Zeloit Alam.Jurnal Teknik Pomits. Jurusan Teknik Kimia, Fakultas Teknologi Industri, Institut Teknologi Sepuluh November (ITS), Surabaya.
[3]Hamidi N., ING. Wardana, Widhiyanuriyawan D., (2011). Peningkatan Kualitas Bahan Bakar Biogas Melalui Proses Pemurnian Dengan Zeolit Alam. Jurnal Rekayasa Mesin. Jurusan Teknik Mesin Fakultas Teknik Universitas Brawijaya, Malang.
[4]. Juanga JP, Visvanathan C, Tränkler J. Optimization of Anaerobic Digestion of Municipal Solid Waste in Combined Process and Sequential Staging. J Waste Manage Res. 2007;25:30–38.
[5]. Karellas SB. Development of an investment decision tool for biogas production from agricultural waste. Jurnal Renewable and Sustainable Energy Reviews. 2010;14:1273- 82.
[6] Masyhuri A.P., Ahmad A.M., Djojowasito G., (2013). Rancang Bangun
Sistem Penyerap Karbon dioksida (CO2) Pada Aliran Biogas Dengan
Menggunakan Larutan Ca(OH)2.Jurnal Keteknikan Pertanian Tropis dan
Biosistem. Jurusan Keteknikan Pertanian, Fakultas Teknologi Pertanian, Universitas Brawijaya, Malang.
[7] Q. Zhao, E. Leonhardt, C. MacConnell, C. Frear and S. Chen (2010) , Purification Technologies for Generated by Anaerobic Digestion, CSANR Research Report 2010 –001 Climate Friendly Farming Ch.