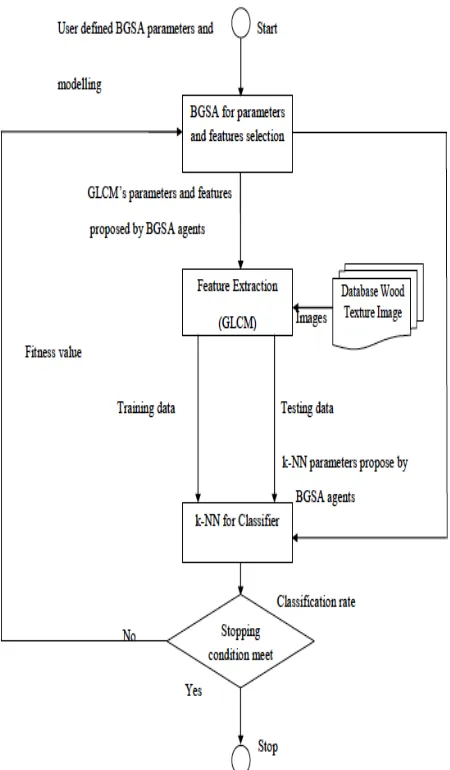
Classification System for Wood Recognition using K-Nearest Neighbor with Optimized Features from Binary Gravitational Algorithm.
Teks penuh
Gambar
Dokumen terkait
PENGENALAN CIRI GARIS TELAPAK TANGAN MENGGUNAKAN EKSTRAKSI FITUR GRAY LEVEL CO- OCCURENCE MATRIX (GLCM) DAN METODE K-NEAREST.. NEIGHBORS
MENGGUNAKAN EKSTRAKSI FITUR GRAY LEVEL CO- OCCURENCE MATRIX (GLCM) DAN METODE K-NEAREST NEIGHBORS (K- NN)”. 1.2
Metode K-NN (K-Nearest Neighbor) merupakan metode klasifikasi yang dapat digunakan untuk menentukan status gizi balita dengan menggunakan variabel data input
CONCLUSION In this study, the classification of brain tumors using K- Nearest Neighbor KNN and Support Vector Machine methods with Genetic Algorithm GA as a feature selection, namely
Data sampel yang digunakan berjumlah 25 untuk setiap motif batik lampung Hasil yang didapat adalah Metode klasifikasi K-Nearest Neighbor sudah sangat baik dalam proses pengenalan pola
As for the research on the implementation of the K-Nearest Neighbor Algorithm on the Laptop Recommendation Website [6], in this study, the user is immensely helped by the existence of a
The method used is Gray Level Co- Occurrence Matrices for feature extraction, while to determine the proximity between the test image and the training image using the K-Nearest
5 Kesimpulan Berdasarkan hasil penelitian dan pengujian yang dilakukan pada penerapan algoritma optimasi Binary Dragonfly Algorthm BDA, algoritma klasifikasi K-Nearest Neighbor KNN
