Study of the Recharge Area on Water Basin Soil
with Remote Sensing Method Using Satellite
Imagery Landsat 7 ETM + and Geographic
Information Systems ( GIS )
(Case Study : Pasuruan District )
Isniyatus Sholikhah
1, Muhammad Taufik
1, and Kukuh Sudjatmiko
2AbstracWater is natural resources that is very essential for living creatures and the environment. Along with the increase
of population , will increase the water demand and reduce the area of free land / open green space for the formation of ground water. By considering soil water conservation aspects, it is necessary to conduct a study of the recharge area on water basin soil in Pasuruan. This study was to determine the condition of the recharge area in the Basin Groundwater Pasuruan in 2003
and 2014. So it will be k[1]nown the changes of the vegetations density and land cover in the recharge area that can affect
infiltration process in order to conserve water resources in CAT Pasuruan. From these changes it would be able to make the prediction of future conditions in the recharge area in CAT Pasuruan. This study uses Remote Sensing using Satellite imagery Landsat and Geographic Information System (GIS). Studies to determine the recharge area is influenced by several parameters, that is slope of land, lithology and Rainfall. Processing results obtained vegetation density changes of the recharge area in 2003-2014, high vegetation density decreased by 4330,89 Ha, so that changes in the high vegetation density in 2025 is predicted to be 52305,39 Ha and become 52176,78 Ha in 2030. While land cover changes produce changes in forest land cover increased by 569,88 Ha , so that changes in forest land cover in 2025 is predicted to be 37563,88 Ha and became 38720,494 Ha in 2030. The relationship between vegetation density and land cover of the recharge area in 2003 - 2014 obtained high vegetation density that experienced an increase area, which is on garden land cover amounting to 1144,80 Ha, 943,02 Ha of forest, 947,79 Ha of settlements land cover and 262,53 Ha of vacant land. And that experienced an increase with low vegetation density are the fields amounting to 943,02 Ha and 277,47 Ha of vacant land. Land cover vegetations that dominates throughout the recharge area is a mahogany tree vegetation, and sengon.
Keywords Recharge Area, CAT Pasuruan, Remote Sensing.
AbstrakAir adalah sumber daya alam yang sangat penting bagi makhluk hidup dan lingkungan. Seiring dengan
bertambahnya jumlah penduduk, akan meningkatkan kebutuhan air dan mengurangi luas lahan bebas / open green untuk pembentukan air tanah. Dengan mempertimbangkan aspek konservasi air tanah, perlu dilakukan penelitian tentang daerah resapan air di lahan air di Pasuruan. Penelitian ini untuk mengetahui kondisi daerah resapan air di Perairan Basin Pasuruan pada tahun 2003 dan 2014. Sehingga akan diketahui perubahan kerapatan vegetasi dan tutupan lahan di daerah resapan yang dapat mempengaruhi proses infiltrasi untuk menghemat sumber daya air. di CAT Pasuruan. Dari perubahan tersebut maka akan dapat membuat prediksi kondisi masa depan di daerah resapan di CAT Pasuruan. Penelitian ini menggunakan Remote Sensing dengan menggunakan citra satelit Landsat dan Sistem Informasi Geografis (SIG). Studi untuk menentukan daerah resapan dipengaruhi oleh beberapa parameter, yaitu kemiringan lahan, litologi dan curah hujan. Hasil pengolahan diperoleh perubahan kepadatan vegetasi daerah resapan pada tahun 2003-2014, kepadatan vegetasi tinggi turun 4330,89 Ha, sehingga perubahan kepadatan vegetasi tinggi pada tahun 2025 diprediksi sebesar 5.2305,39 Ha dan menjadi 52176,78 Ha di 2030. Sementara perubahan tutupan lahan menghasilkan perubahan tutupan lahan hutan meningkat sebesar 569,88 Ha, sehingga perubahan tutupan hutan pada tahun 2025 diprediksi mencapai 37563,88 Ha dan menjadi 38720.494 Ha pada tahun 2030. Hubungan antara kepadatan vegetasi dan tutupan lahan daerah resapan pada tahun 2003 - 2014 memperoleh kepadatan vegetasi tinggi yang mengalami kenaikan luas, yaitu pada tutupan lahan kebun seluas 1144,80 Ha, 943,02 Ha hutan, 947,79 Ha tutupan lahan permukiman dan 262,53 Ha lahan kosong. Dan yang mengalami peningkatan dengan kepadatan vegetasi rendah adalah lahan seluas 943.02 Ha dan 277,47 Ha lahan kosong. Tanaman penutup tanah yang mendominasi sepanjang daerah resapan adalah vegetasi pohon mahoni, dan sengon.
Kata Kunci Recharge Area, CAT Pasuruan, Remote Sensing.
I.INTRODUCTION1
ater is a natural resource that is essential to living creatures and the environment , including all the people of Indonesia . Along with the increase of population , will increase the water demand. Beside that,
1Isniyatus Sholikhah and Muhammad Taufik are with Department of
Geomatics Engineering Institut Teknologi Sepuluh Nopember, Surabaya, 60111, Indonesia. E-mail: [email protected], [email protected]
the building construction also leads to reduced of free land / open green space for the formation of ground water. It can be seen from ground water use in CAT Pasuruan which currently leads in the region that hydrogeologically was a recharge area. By considering aspects of soil water conservation it is necessary to 2Kukuh Sudjatmiko is with Departemen of Dinas Energi dan Sumber
Daya Mineral Provinsi Jawa Timur. E-mail: [email protected]
conduct a study of the recharge area on water basin soil in Pasuruan. [1] .
By considering aspects of soil water conservation it is necessary to conduct a study of the recharge area on water basin soil in Pasuruan. This study was to determine the condition of the recharge area in the Basin Groundwater Pasuruan in 2003 and 2014. So it will be known the changes of the vegetations density and land cover in the recharge area that can affect infiltration process in order to conserve water resources in CAT Pasuruan. From these changes it would be able to make the prediction of future conditions in the recharge area in CAT Pasuruan.
II. METHOD
Image data used in this research is Satellite Imagery Landsat 7 ETM + and Landsat 8 at the public domain USGS (United States Geological Survey) http://earthexplorer.usgs.gov/ Path 118 and Row 65 of September 1st, 2014 and May 22th, 2003 acquisition of the data.
Vector data used in this research geologic map of the malang and probolinggo, contour map of pasuruan district, raifall map of pasuruan district, and Basin Groundwater (CAT) map of jawa timur province.
The research location at Groundwater Basin region precisely at the administrative borders of Pasuruan (Figure 1).
Figure 1. Map of Study Area
This study was to determine the condition of the recharge area in the Basin Groundwater Pasuruan in 2003 and 2014. So it will be known the changes of the vegetations density and land cover in the recharge area that can affect infiltration process in order to conserve water resources in CAT Pasuruan. From these changes it would be able to make the prediction of future
conditions in the recharge area in CAT Pasuruan. This study uses Remote Sensing using Satellite imagery Landsat and Geographic Information System (GIS).
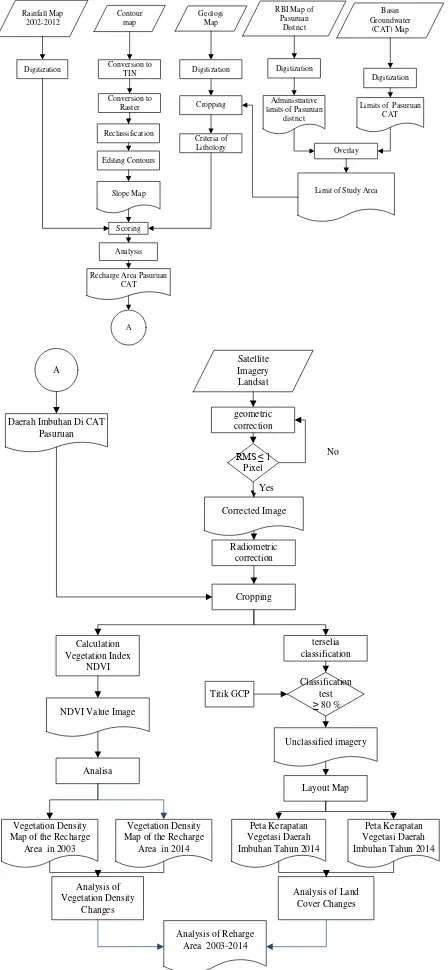
Data processing consists of determining the recharge area, land cover and the vegetation index. Determining recharge area is done by scoring the decisive parameters comprising the slope , lithology and rainfall . While the determination of the density of vegetation using vegetation index Normalized Difference Vegetation Index ( NDVI ) . NDVI has a function algorithm NDVI = ( Rnir - Rred ) / ( Rnir + Rred ) [2] .The detailed
Limits of Pasuruan CAT
Overlay
Limit of Study Area
A Map of the Recharge Area in 2003 Map of the Recharge
Area in 2014
Daerah Imbuhan Di CAT Pasuruan
Figure 2. Flow chart showing detailed procedure
II.RESULT AND DISCUSSION
Determination of recharge areas in Pasuruan CAT was influenced by several parameters , that is slope , lithology, and rainfall [3]. The procedure of determination recharge areas in Pasuruan is shown with the help of flow chart in Figure 3.
Slope
Lithology Scaling
Rainfall Scaling Scaling
Class
Overlay Data
Class
Class CAT Recharge Area Pasuruan
Reclass Scoring
Figure. 3. Flow chart showing determination of recharge areas in Pasuruan CAT procedure
.
a) Slope
The criteria of slope parameter is based Contour Map ( Figure 4).
b) Lithology
The criteria of lithologi parameter is based Geologic Map ( table 1).
TABLE 1. LEVELS RANGE DENSITY
Class NDVI Range Density Level
1 -1,0 s.d 0,32 Rare
2 0,32 s.d 0,42 Medium
3 >0,42 s.d 1 High
c) Rainfall Parameter
The criteria of rainfall parameter is based Geologic Map.
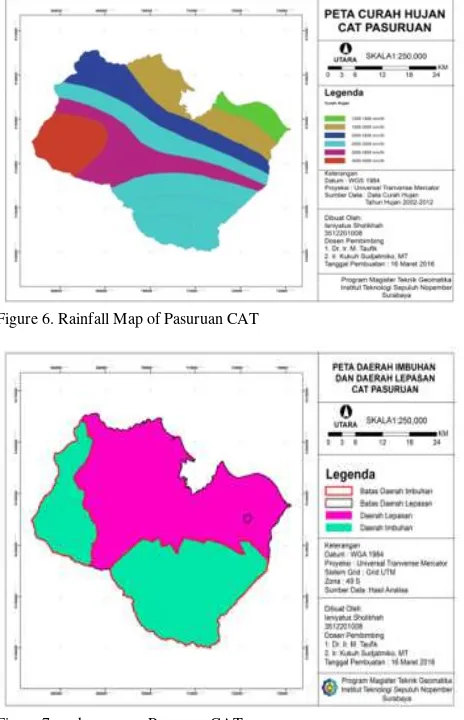
Determination of recharge areas in Pasuruan CAT is done by scoring with metode Overlay Weighted Sum method the decisive parameters comprising the slope, lithology and rainfall. The results of determination obtained main recharge areas, and, removable area ( Figure 6).
Figure 4. Slope Map of Pasuruan CAT
Figure 5. Geologic Map of Pasuruan CAT
Figure 6. Rainfall Map of Pasuruan CAT
Figure 7. recharge area Pasuruan CAT
B.
Vegetation Index
Image processing results obtained SOF (Strength of Figure ) at 0.2576 and the result of geometric correction with registration technique "Select GCP : image to image" with 10 points on Landsat 7 ETM obtained 0,436027 RMSerror value and Landsat 8 2014 obtained 0,360314 RMSerror value .
Geometric correction used to reduces radiometric errors in the image, as well as to cultivate the vegetation index algorithm that uses data from the image reflectance value.
TABLE 2.
THE RESULTS OF THE NDVI CLASSIFICATION
Vegetation Classificat
ion
Recharge Areas
(Ha) (%) ∆
2003 2014 2003 2014 (Ha) (% ) Vegetation
Rare
4436,6 4
6404,7
6 6,40 9,24 1968,
12 2,8
4 Vegetation
Medium
3885,6 6
6254,3
7 5,61 9,03 2368,
71 3,4
2
Vegetation High
60967, 17
56636, 28
87,9 9
81,7 3
-4330,
89 -6,2
6
Total 69289, 47
69295, 41
100, 00
100, 00
Processing results obtained vegetation density changes of the recharge area in 2003-2014, high vegetation density decreased by 4330,89 Ha.
To predict the condition of high vegetation density change in the future, may use linear regression equation y = -4330.x + 65298.
From the the linear regression equation, high vegetation density in 2025 is predicted to be 52305.39 ha and in 2030 became 52176.78 Ha.
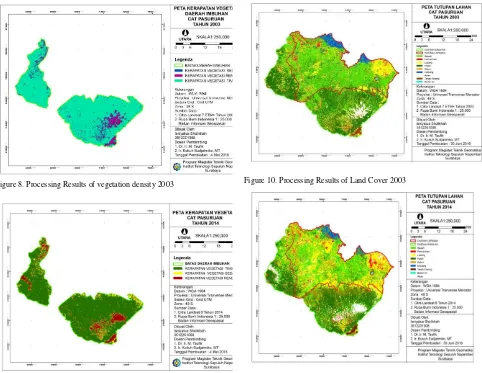
The Results of recharge area classification based on NDVI values, presented in the map ( Figure 8 and Figure 9 ).
C.
Land Cover
Land cover classification is done by the method of terselia classification, type maximum likellihood. Accuracy of processing land cover is calculated using confusion matrix and sample as many as 23 points, the
tolerance limits given is ≥ 80%. Confusion matrix calculations in 2003 amounted to 90.75% and in 2014 amounted to 98.45%.
Figure 8. Processing Results of vegetation density 2003
Figure 9. Processing Results of vegetation density 2014
Figure 10. Processing Results of Land Cover 2003
Figure 12. Land Cover of the recharge area 2003
Figure 13. Land Cover of the recharge area 2014
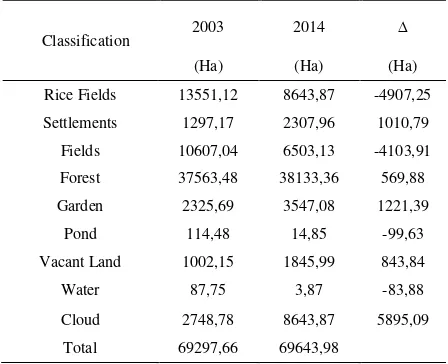
The following table are land cover area calculations of recharge area in year 2003-2014 (table 3):
TABLE 3.
THE RESULTS OF THE LAND COVER CLASSIFICATION
Classification 2003 2014 ∆
(Ha) (Ha) (Ha)
Rice Fields 13551,12 8643,87 -4907,25
Settlements 1297,17 2307,96 1010,79
Fields 10607,04 6503,13 -4103,91
Forest 37563,48 38133,36 569,88
Garden 2325,69 3547,08 1221,39
Pond 114,48 14,85 -99,63
Vacant Land 1002,15 1845,99 843,84
Water 87,75 3,87 -83,88
Cloud 2748,78 8643,87 5895,09
Total 69297,66 69643,98
From the data processing, forest cover increased by 569.88 Ha. To predict changes in forest cover in the future may use linear regression equation y = 569.8 x +36994.
From the the linear regression equation can be determined prediction changing conditions of forest cover in 2025 is predicted to be 37563.88 ha and in 2030 became 38720.494 Ha.
D. Analysis of Recharge Area changes
Analysis of reharge area changes obtained from the the relationship changes between land cover and vegetation density of recharge areas in years 2003-2014.
TABLE 4.
RECHARGE AREA CHANGES
Classification
∆
Vegetation Rare
Vegetation Medium
Vegetation High (Ha)
Rice Fields 24,03 51,21 -5321,43
Settlements -53,19 115,92 947,79
Fields 794,34 1412,91 -6311,16
Forest -100,80 -271,80 943,02
Garden 4,14 72,45 1144,80
Pond -89,10 -10,26 -0,27
Vacant Land 277,47 301,68 262,53
Water -66,42 -17,55 0,09
Cloud 1177,56 713,43 4004,19
Total
From data processing, obtained the high vegetation density that increased are: Gardens of 1144.80 hectares, 943.02 hectares of forest, settlement of 947.79 hectares and 262.53 hectares of vacant land.
And at the low density that was increase are fields amounted to 943,02 hectares, vacant land of 277.47 hectares, and clouds. Land cover vegetation that dominates in all recharge area are mahogany and sengon trees.
High vegetation density increases in forest land, this suggests that the reforestation of forest areas capable of increasing the density of vegetation on forest land cover. In addition, the increase also occurred on garden land, this indicates that the increased activity of production and planting vegetation in an effort to protect the soil surface from the impact of rain water, runoff decrease, hold soil particles through the root system and maintain stability in the soil's capacity to absorb water.
On the one hand there is an increase in the area with low vegetation density with land cover of settlement and vacant land, this indicates that there is a land conversion that could threaten the sustainability of water resources.
IV.CONCLUSION
Based on the results and analysis, it can be concluded: a) Based on the analysis it was concluded that the
determination of the recharge area obtained zones is the recharge area and loose areas.
b) Processing results obtained vegetation density changes of the recharge area in 2003-2014, high vegetation density decreased by 4330,89 Ha
c) High vegetation density in 2025 is predicted to be 52305,39 Ha and become 52176,78 Ha in 2030. d) Processing results obtained land cover changes of the
recharge area in 2003-2014, land cover forest increased by 569,88 Ha.
f) With the linear regression equation, changes in forest cover in 2025 is predicted to be 37563.88 ha and in 2030 became 38720.494 Ha.
g) The relationship between vegetation density and land cover of the recharge area in 2003 - 2014 obtained high vegetation density that experienced an increase area, which is on garden land cover amounting to 1144,80 Ha, 943,02 Ha of forest, 947,79 Ha of settlements land cover and 262,53 Ha of vacant land. And that experienced an increase with low vegetation density are the fields amounting to 943,02 Ha and 277,47 Ha of vacant land.
h) Land cover vegetations that dominates throughout the recharge area is a mahogany tree vegetation, and sengon.
EFERENREFERENCES
[1] Dinas Energi Dan Sumber Daya Mineral Provinsi Jawa Timur,
“Pemetaan Pengambilan Air Tanah Pasuruan,” 2012.
[2] T. M. Lillesand and R. W. Kiefer, Remote Sensing and Image Interpretation. New York: Wiley & Sons, 2000.
[3] Badan Geologi, “Panduan Teknis Pengelolaan Air Tanah,” Bandung, 2007.
[4] Abdurrahman, R.S, “Studi Hidrologi Mataair di Kabupaten
Kuningan. Jawa Barat”, Fakultas Geografi Universitas Gadjah
Mada : Yogyakarta, 1990.
[5] Asy’Ari, Imam, “Evaluasi Kondisi Pemanfaatan Airtanah Di
Kabupaten Pasuruan”, ITS-Surabaya, 2005.
[6] Asdak, C, “Hidrologi dan Pengelolaan Daerah Aliran Sungai”, Yogyakarta: Gadjah Mada University Press, 2004.
[7] Bowles, J.E, “Sifat-Sifat Fisis dan Geoteknis Tanah (Mekanika
Tanah)”, Jakarta : Erlangga, 1986.
[8] Danaryanto et al, “Air Tanah di Indonesia Dan Pengelolaannya.
Ditjen Geologi Dan Sumber Daya Mineral”, Departemen Energi
Dan Sumber Daya Mineral, 2005.
[9] Departemen Kehutanan, “Peraturan Menteri Kehutanan Republik Indonesia nomor: P.32/MENHUT-II/2009”, Jakarta, 2009. [10]Dinas ESDM, “Identifikasi Pengolahan Dan Pemanfaatan Air
Bawah Tanah Di Kabupaten Pasuruan”, Jawa Timur:Surabaya,
2008.
[11]Prahasta, Edi, “Konsep-Konsep Dasar Sistem Informasi
Geografis”, Bandung: Informatika Bandung, 2002.
[12]Karnieli, A., Agam, N., Pinker, R., Anderson, M., dan Goldberg,
A, “Use of NDVI and Land Surface Temperature For Drought Assesment”, Journal of Climate, Vol.24, hal. 619, 2009.
[13]Kodoatie, RJ, “Pengantar Hidrologi”, Andi Yogyakarta: Yogyakarta, 1996.
[14]Kodoatie, R.J., dan R. Sjarief,” Tata Ruang Air” Yogyakarta: ANDI, 2010.
[15]Maria, Rizka, dkk, “Pengaruh Penggunaan Lahan Terhadap Fungsi
Konservasi Air Tanah Di Sub Das Cikapundung”, LIPI : Riset
Geologi dan Pertambangan, 2014.
[16]Murtono, Teggu, dkk, “Zonasi Imbuhan Air Tanah Pada Daerah
Aliran Sungai Lahumbuti Provinsi Sulawesi Tenggara”,
Universitas Hasanudin : Geosains, 2013.
[17]Noor, Djauhari, “Geologi Untuk Perencanaan”, Graha Ilmu: Yogyakarta, 2011.
[18] Seyhan, Ersin, "Dasar-Dasar Hidrologi", Gadjah Mada University Press: Yogyakarta, 1977.
[19]USGS, “Using the USGS Landsat 8 Product”, 2003, History :http://landsat.usgs.gov/Landsat8_Using_Product.php accessed on 13 December 2015.
[20]Wedehanto, Sony, "Pengembangan Citra Landsat 7 ETM Untuk Menduga Keberadaan Air Tanah", FTSP - ITS, 2006.
[21]Wibowo, Mardi, “Model Penentuan Kawasan Resapan Air Untuk
Perencanaan Tata Ruang Berwawasan Lingkungan”, Jakarta :
Badan Pengkaji dan Penerapan Teknologi, 2006. [22]Wilson, EM, "Hidrologi Teknik", ITB : Bandung, 1993. [23]Wolf, Paul R, "Elemen Fotogrametri dengan Interpretasi Foto
Udara dan Penginderaan Jauh", Gadjah Mada University Press, Yogyakarta,1993.