PM
10as Predictor of Ventilation Efficiency of Houses in Relation to Health Effect
Rachmadhi Purwana
Abstrak
Kekhawatiran akan tingginya kadar partikulat di udara Jakarta terkait dengan efek kesehatan pernapasan. Begitu pula, konsentrasi tinggi partikulat dalam rumah ditengarai merupakan bahaya potensial kesehatan untuk penghuni rumah. Makalah ini didasari oleh sebuah penelitian potong lintang di rumah sebuah desa di Jakarta yang dilakukan untuk sebuah disertasi gelar Doktor Ilmu Kesehatan Masyarakat. Dalam kaitan dengan kesehatan, penelitian itu mengungkapkan bahwa efektivitas ventilasi lebih ditentukan oleh variasi konsentrasi partikulat rumah (PM10) daripada karakteristik fisik rumah. Di samping itu, gejala gangguan pernapasan pada anak balita ternyata berhubungan positif dengan konsentrasi PM10. Sifat-sifat fisik rumah seperti ukuran jendela, kamar dan lain-lain, kecuali kelembaban rumah, ternyata tidak berhubungan dengan variasi kesehatan para penghuninya. Penelitian ini mengisyaratkan bahwa PM10 merupakan indikator yang lebih baik untuk rumah sehat daripada ciri-ciri fisik rumah. Juga, tinggi kadar PM10 yang paling sensitif dan spesifik untuk menduga terjadinya gejala gangguan pernapasan adalah 70 g/m3. Batas konsentrasi PM10 ini cocok dengan nilai petunjuk Badan Kesehatan Dunia sebesar 70 g/m3 untuk partikel thorasik. (Med J Indones 2005; 14: 237-41)
Abstract
Concerns for the high concentration of particulates in the ambient air of Jakarta had been associated with respiratory health effects. Accordingly, the high concentration of indoor air particulate in homes was also recognized as a potential health hazard to the household. This paper was based on findings in a cross-sectional study in homes of a village, Jakarta done for a dissertation of a doctoral degree in Public Health. In relation to health aspect, ventilation effectiveness was more predicted by the variation of indoor particulates concentrations (as PM10) than the physical characteristic of the houses. Besides, respiratory symptoms rates among children under-five were positively associated to PM10 concentrations. Except for the house dampness factor, no physical features of the houses such as sizes of windows, rooms, and the like, contributed to the variability of health of the occupants. This research suggested that PM10 concentration was a better indicator for a healthy house than the physical characteristics of the house. As such, the most sensitive and specific level of PM10 concentration to predict the development of respiratory symptoms was 70g/m
3
. This cut-off concentration of PM10 agreed with the guideline value set on the level of 70g/m3 for the thoracic particles by the World Health Organization. (Med J Indones 2005; 14: 237-41)
Keywords: respiratory symptoms, overcrowding, children under-five, PM10 concentration of 70 g/m 3
, physical factors of houses.
The end of the twentieth century had seen a devastating earth-life marred by environmental pollution. Technology supposedly developed for the welfare of humankind transgressed toward threats of the welfare itself. Air pollution, notoriously known as one form of environmental pollution, escalated along with the concentration and progress of human activity commonly seen in cities such as Jakarta. In 1992,
twenty main cities of the world were declared as having critical condition of air pollution.1 Jakarta was one among those cities with high concentration of ambient suspended particulate matter related to potential increase of adverse health effects.
A report in 1994 cited that the high rate of respiratory disease mortality in Jakarta was associated to the high concentration of ambient suspended particulate matter.2 Indeed, the respiratory disease mortality rate of Jakarta was found twice the national rate.3 Further, it was assumed that the high concentration of ambient suspended particulate matter was accounted for 1.7 to 3.5 percent of crude mortality rate in 1990.4
Annual records of air quality reported that ambient suspended particulate matter in Jakarta had exceeded the ambient air standard of 260 g/m3. The concentrations were recorded in the range of 181g/m3 to 392
g/m3.5,6,7 Although ambient air pollution had raised so much concern, little was indoor-air pollution particularly the air-quality of homes, attracted such attention.
The problem of indoor-air pollution in Jakarta rooted from the overcrowding environment commonly seen in urban life of the world. The 1995 statistics showed a figure of 10,000 to 30,000 populations for every kilometer square area in Jakarta.8 Economic growth has brought Jakarta into an escalating housing demand problem that subsequently transformed many of its zones into slum and squatter areas. More than 2 million people lived in areas with low environmental standards. As many as 15.8 percent of house-size were less than 18 meters square and 33.7 percent were in the size-range of 19 to 45 meters square.9
Hardly such housing condition could support effective ventilation. With small size houses and densely populated area, indoor air pollution became a potential problem to the inhabitants. The Topeca findings in the United States revealed higher particulate concentrations indoor than that of the outdoor. This is also true for urban areas in developing countries due to indoor sources of air pollution.10, 11 Since 60 to 90 percent time of a day was mainly spent indoor, the inhabitants particularly children under-five, were potentially exposed to high concentrations of indoor suspended particulate matter than that of the outdoor.12
This research was carried out in one of the over-crowded villages, the Pekojan village, in Jakarta. It occupied 73 hectares of an area in the northern part of Jakarta. In 1996, the total population of the village was 31.158 people, making the area three times as overcrowded as Jakarta by that time. In fact, the village was a very compact area with narrow crisscross aisles (3/4 meters to 2 meters) fit for vehicles not bigger than bicycles or tricycles chariots.
METHODS
Population
This report was part of a wider cross-sectional study of a dissertation leading to a doctoral degree in Public Health. Some of the methodology described here
might have similarity with the earlier description of the study. As had been described elsewhere, this study was a population-based study of 263 children-under-five sample drawn from a list of existing 1,165 children-under-five. The children were assigned in a cross-sectional study to find a relationship between their household PM10 concentrations and their incidence of respiratory symptoms during two consecutive weeklong period of observation. The children participating were selected among those who showed no symptoms of any illness at the beginning of the study. Prior to the research, informed-consent statement was obtained from the parents of the respondents to be.
A checklist was administered to collect information
on current physical characteristics of the child’s
home, daily activities of the occupants including smoking habits, cooking, and some information on the socio-economic status of the household. Data on the incidence of respiratory symptoms of the child was obtained from a by-parents-completed questionnaire based on their observation over the following two week-long period. The mother or other member of the family should observe any respiratory symptoms shown by the child under study including cough, runny nose, phlegm, and fever. The most common symptoms or combination of symptoms were selected for further analysis.
Particulate Measurement
A medical doctor, three cadres of the local Primary Health Care Services, and two Family Planning workers collected the data. Concentrations of PM10 were collected in 204 houses of the 263 children under-five using a portable particulate monitor, the HAZ-Dust SamplerTM 10 m.
Statistical Analysis
Statistical analysis using the Receiver Operating Characteristic (ROC) shown that the most predictive value of PM10 concentration was levels of PM10
measured in the morning in children’s bed-room
Determination of the relationship between respiratory symptoms and PM10 concentration was done through a logistic regression analysis.
RESULTS
Housing Condition
This research is undertaken in an overcrowded area of Jakarta. Out of 263 children, 24.7 percent live in houses with the size less than 2.5 square meters per person and 24.0 percent in houses of 16 square meters. An average of 6 to 7 person resided in each of the houses. A total of 55.9 percent of the children lived in houses with more than one family. Some (13.7%) of the household had no bedroom. Due to lack of space, 43.7 percent of the children had to sleep together with other person making 7 to 8 persons together in a room and 73.8 percent slept on the kapok filled mattressess. Out of the whole respondents 61.2 percent of the children were found undernourished (Table 1).
Table 1. Proportion of Household Characteristics
N 263 100.0
House dampness 178 67.7
Parental smoking 184 70.0
Respiratory Infection in member of the household
34 12.9
Type of wall (plastered, bricks) 177 67.3
Mosquito spray use 139 52.9
Others smoking 117 44.5
House with more than one family 147 55.9
Bedroom size/person ratio (=< 2,5 m2/person)
Undernourished status (WAZ) 161 61.2
Window size/children’s bedroom
size ratio (less than 10 %)
179 68.1
More than one-floor house 201 76.4
Place of kitchen (part of other room) 54 20.5
Mattress filled with kapok 194 73.8
Number of persons sleeping in
Besides the overcrowding problem, the children were potentially exposed to indoor air pollutants. Seventy percent of the children lived with parents who smoked. A proportion of 44.5 percent of the children lived with person (other than their parents) who smoked. Other potential exposure to indoor air pollution were that 77.8 percent of the children lived in households that used kerosene for cooking purposes and 52.9 percent of the household used mosquito spray. Some of the children (20.5 percent) lived in household that had no indoor kitchen. In these household, cooking was done in common rooms that also served as places for sleeping and other daily activities.
Respiratory Symptoms and PM10 Concentration
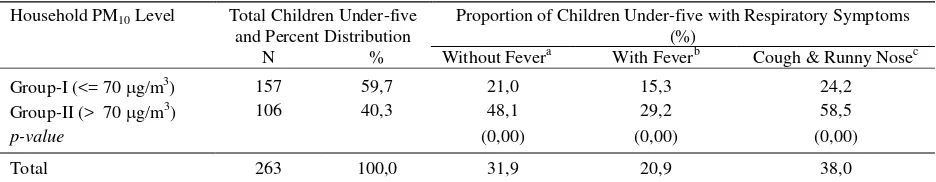
During the two week observation period, of the 263 children, 139 children (52.9 percent) developed respiratory symptoms. Three most common symptoms found are the combination of cough and runny nose (38.0 percent), any respiratory symptom (including cough, runny nose, hoarse, phlegm, or combination of cough and runny nose) without fever (31.9 percent), and any respiratory symptom with fever (20.9 percent). A total of 106 children or 40.3 percent lived in Group-II homes (PM10 concentrations higher than 70g/m3). Of these children 58.5 percent developed symptom of cough and runny nose combination while only 24.2 percent showed the same symptom among the rest of 157 children (59.7 percent) in Group-I homes. Of those who lived in Group-II homes 29.2 percent developed fever with respiratory symptoms proportionately different (p < 0.00) from the 15.3 percent with the same symptoms in the group-I homes. Any respiratory symptom without fever were found among 48.1 percent children who lived in Group-II homes and only 21.0 percent children developed the same symptoms among those who lived in Group-I (Table 2).
After a logistic regression analysis, the children in Group-II homes showed a higher odds for developing respiratory symptoms than the children in Group-I homes. The odds-ratio of respondents to suffer from combination of cough and runny nose in Group-II homes was 4.27 times (2.48 ~ 7.36; 95% confidence interval) than those of Group-I homes.
without fever, the odds ratio was 6.64 (3.17 ~ 13.90; 95% confidence interval) while respiratory symptoms with fever showed an odds ratio of 5.37 (2.27 ~ 12.70; 95% confidence interval).
None of the other physical factors such as the ratio of
window size/children’s bedroom size, types of wall,
house size, number of floors, or number of rooms in the house contribute significant role in the development of respiratory symptoms among children under investigation. Even the presence of respiratory infection among members of the household other than the children did not contribute to the development of respiratory symptoms among the children under five. Furthermore, although 61.2 percent of the children were found undernourished, this research was not able to relate undernourished factor with respiratory symptoms development of the children.
DISCUSSION
Housing Condition
Living in a slum area of a city denied most of the basic sanitation requirements for a decent life. This was found explicitly in most parts of slum areas in Jakarta where population density over-run house sizes. It was also common that a household was occupied by more than one family, making a potential exposure to various kinds of health risks including the indoor cigarette smoke from their parents as well as from other persons. Besides, overcrowding compelled children to sleep in a crowded room together with
adults and subsequently infectious disease transmission became a risk to their health status.
Health Condition
PM10 or particulate matter of 10 micrometer is a term used for a non-gaseous state of air pollutant. It is a collective term for small solid particles and liquid droplets not bigger than 10 micrometer that suspended in the air and was able to enter deep into the respiratory tract up to the alveoli region. Particulates were classified into the viable and non-viable particulates, where the viable particulates contained living matter such as bacteria, fungi, molds, or spores. The exposure to high PM10 concentration had been proven as a risk factor of respiratory disease elsewhere.13 Therefore, with all the existing indoor conditions, it was not surprising that within 2 weeks of observation 52.9 percent of the children developed respiratory symptoms. Of them, the distribution of the children who developed respiratory symptoms were in line with the concentration of indoor PM10 where those living in homes with PM10 concentration higher than 70 g/m3 significantly developed more respiratory symptoms than those living in homes with con-centration of 70 g/m3 PM10 or less. The odds-ratio to suffer from respiratory symptoms for children living in homes with concentrations of PM10 higher than 70 g/m
3
was 4.27 to 6.64 times than those living in homes with concentration of PM10 of 70g/m3 or less while house dampness (one of the physical feature) of houses contributed an odds-ratio of 1.96.
Table 2. Proportion of Children under-five with Respiratory Symptom by Level of Household PM10
Household PM10 Level Total Children Under-five
and Percent Distribution
Proportion of Children Under-five with Respiratory Symptoms (%)
N % Without Fevera With Feverb Cough & Runny Nosec
Group-I (<= 70 g/m3) 157 59,7 21,0 15,3 24,2
Group-II (> 70 g/m3) 106 40,3 48,1 29,2 58,5
p-value (0,00) (0,00) (0,00)
Total 263 100,0 31,9 20,9 38,0
a
any respiratory symptom (including cough, runny nose, or combination of cough and runny nose) without fever b any respiratory symptom (including cough, runny nose, combination of cough and runny nose) with fever c
Included to that figures are the group of children (odds ratio of 5.37) who show signs of respiratory symptoms accompanied by fever, indicating an infection. Therefore, it was logical to hypothesize that a possible transmission of respiratory infection through the air by viable PM10 occurred in those houses. Moreover, the contribution of house dampness to the development of respiratory symptoms among the children might be the clue to the viability of PM10 that transmitted respiratory infection.
With regard to the physical condition of the houses, except the house dampness factor, the development of respiratory symptoms among children was insensitive to variation of any physical features of the houses including the ratio of ventilation size to floor width, types of floor, and the like. As such, it was reasonable to conclude that in an overcrowding area respiratory symptoms were determined more by indoor PM10 concentrations in each house than the physical features of the houses. This was easily understood since houses in an overcrowded area were so densely set from each other that they were denied of their effective natural ventilation regardless of their variation of physical features. So, the effectiveness of natural ventilation of those houses was better reflected by the concentrations of PM10 in each of the house than by its individual physical features.
An R.O.C-test on the data in this research also revealed that the cut-off level of 70 g/m3 for indoor PM10 concentration was the most sensitive and specific level in predicting the development of symptoms house. Nevertheless, the nature of a cross-sectional study was called for a hypothesis building and not intended to assume a causal effect between the res-piratory symptoms development among the children under five and the concentration of PM10.
Acknowledgement
This research is made possible by the efforts of many people. A special thanks to the community in the
village of Pekojan where the study was undertaken for their involvement in this research. Also thanks to the interviewers who enthusiastically gave their time and energy for this research and to P.T. Insuma, Jakarta that lent the HAZ-Dust SamplerTM 10 m.
REFERENCE
1. World Health Organization and United Nations
Environmental Protection. Urban Air Pollution in Mega-cities of the World. Earth-watch, Global Environment Monitoring System. Blackwell; 1992.
3. Department of Health Republic of Indonesia. Household Health Survey. Jakarta: Ministry of Health R.I. Health Ecology Research Center and Central Bureau for Statistics; 1992.
4. Sutamihardja RTM. Air Quality Management. In: Urbair Jakarta Air Quality Management, 2nd Workshop, Regional Government of DKI Jakarta, Metropolitan Environmental Improvement Program. World Bank/UNDP; 1994. 5. Budihardjo E. 1993. “Air Quality Monitoring in Jakarta.
In: The First Urbair Workshop in Jakarta. Jakarta: Office for Environmental and Urban Study of DKI Jakarta; 1993. 6. Office for Environmental and Urban Study. Environmental Report: Air, Jakarta 1992-1993. Jakarta: Office for Environmental and Urban Study, DKI Jakarta; 1993. 7. Tri-Tugaswati A. Review of Air Pollution and Its Health
Impact in Indonesia. In: Environmental Research 63. Academic Press, Inc.; 1993:95-100.
8. Office for Environmental and Urban Study. Report: Air Quality Monitoring of Jakarta 1994-1995. Jakarta: Office for Environmental and Urban Study DKI Jakarta; 1995. 9. Surjadi C. Environment and Health in Jakarta, a
Situational Analysis. In: Conference City ‘93 EPH ’93, Antwerp.
10. Godish T. Indoor Air Pollution Control. Michigan: Lewis Publishers Incorporation; 1991.Spengler JD. 1991. Sources and Concentrations of Indoor Air Pollution. In: Jonathan M, Samet JD, Spengler JD editors. Indoor Air Pollution, a Health Perspective. Baltimore: The Johns Hopkins University Press; p. 33-67.
12. Lebowitz MD, Quackenboss JJ, Krzyzanowski M,
O’Rourke MK, Hayes C. Multipollutant Exposure and Health Responses to Particulate Matter. Archives of Environmental Health 1992; 47:71-75. Dockery DW, Pope III CA. Acute Respiratory Effects of Particulate Air Pollution. Annual Review of Public Health 1994; 15:107-32. 14. World Health Organization. Air Quality Guidelines for