UNIVERSITI TEKNIKAL MALAYSIA MELAKA
THE EFFECT OF CUTTING PARAMETER ON SURFACE
ROUGHNESSDURING END MILLING OF AISI D2 TOOL
STEEL
This report submitted in accordance with requirement of the Universiti Teknikal Malaysia Melaka (UTeM) for the Bachelor Degree of Manufacturing Engineering
(Manufacturing Management) (Hons.)
by
MOHD AMAL BIN ABDUL HALIM B051010230
891031-03-5575
DECLARATION
I hereby, declared this report entitled “The Effect of Cutting Parameters on Surface Roughness during End Milling of AISI D2 Tool Steel” is the results of my own
research except as cited in references.
Signature :
Author’s Name : MOHD AMAL BIN ABDUL HALIM
APPROVAL
This report is submitted to the Faculty of Manufacturing Engineering of UTeM as a partial fulfillment of the requirements for the degree of Bachelor of Manufacturing Engineering (Manufacturing Management) (Hons.). The member of the supervisory is as follow:
UNIVERSITI TEKNIKAL MALAYSIA MELAKA
BORANG PENGESAHAN STATUS LAPORAN PROJEK SARJANA MUDA
TAJUK: THE EFFECT OF CUTTING PARAMETERS ON SURFACE ROUGHNESS DURING END MILLING OF AISI D2 TOOL STEEL
SESI PENGAJIAN: 2013/14 Semester 2
Saya MOHD AMAL BIN ABDUL HALIM
mengaku membenarkan Laporan PSM ini disimpan di Perpustakaan Universiti Teknikal Malaysia Melaka (UTeM) dengan syarat-syarat kegunaan seperti berikut:
1. Laporan PSM adalah hak milik Universiti Teknikal Malaysia Melaka dan penulis. 2. Perpustakaan Universiti Teknikal Malaysia Melaka dibenarkan membuat salinan
untuk tujuan pengajian sahaja dengan izin penulis.
3. Perpustakaan dibenarkan membuat salinan laporan PSM ini sebagai bahan pertukaran antara institusi pengajian tinggi.
4. **Sila tandakan ( )
SULIT
TERHAD
TIDAK TERHAD
(Mengandungi maklumat yang berdarjah keselamatan atau kepentingan Malaysia sebagaimana yang termaktub dalam AKTA RAHSIA RASMI 1972)
(Mengandungi maklumat TERHAD yang telah ditentukan oleh organisasi/badan di mana penyelidikan dijalankan)
Alamat Tetap:
ABSTRAK
Alat keluli AISI D2 adalah bahan yang mengandungi karbon yang tinggi dan juga keluli kromium aloy merujuk kepada bahan yang sukar untuk dimesin. Pengajian ini dijalankan untuk mengenalpasti kesan pemotongan laju terhadap bahan keluli AISI D2 mengunakan jenis mata alat masukkan. Ujikaji ini dibuat menggunakan kaedah Metodologi Permukaan Sambutan (RSM) oleh pendekatan Box Behken. Kesan pembolehubah pemotongan adalah kelajuan pemotongan (Vc), kadar suapan (fz), dan lebar pemotongan (ae) yang masing-masing berada dalam julat 100-150 m/min, 0.1-0.2 mm/gigi, dan 2.0-8.0 mm. pengajian ini membuktikan bahawa pemboleh ubah yang memberikan kesan yang paling ketara terhadap kekasaran permukaan dalam turutan kebawah bermula dengan kelajuan pemotongan, kadar suapan, dan lebar pemotongan. Kesan faktor masukan terhadap tindak balas dikenalpasti dengan menggunakan analisis variant iaitu (ANOVA). Tindak balas terhadap kekasaran permukaan dioptimumkan secara serentak. Pembolehubah optimum yang menghasilkan kekasaran permukaan yang terbaik adalah dengan kelajuan pemotongan sebanyak 150 m/min, kadar suapan sebanyak 0.1 mm/gigi dan lebar pemotongan sebanyak 8mm iaitu dengan menghasilkan kekasaran permukaan sebanyak 0.189 µm.
ABSTRACT
The material of AISI D2 tool steel contains high carbon and chromium alloyed is referred as difficult material to be machining. This research was performed to identify the implications of machining variables in High Speed Machining of milling using material of AISI D2 tool steel with inserted end mill tool. The experiment work was carried out using Box-Behken techniques, a part of response surface methodology (RSM) approach by generating from the Design Expert Software. The effect of milling parameters that are cutting speed, feed rate, and width of cut were studied to evaluate their effects on surface roughness. In this study, the cutting speed, feed rate, and width of cut were in the range of 100-200 m/min, 0.1-0.3 mm/tooth, 0.2mm and 2.0-8.0 mm respectively. This study prove that the parameters that give the most significant to the surface roughness in descending order starting from cutting speed, feed rate and width of cut. The effects of input factors on the response were identified by using analysis of variance ANOVA. The responds of surface roughness then simultaneously optimized. The optimum parameters that yield the best surface roughness are cutting speed of 150 m/min, feed rate of 0.1 mm/min and the width of cut of 8mm that produce the surface roughness of 0.186 µm.
DEDICATION
I would like to thank my supervisors Dr Mohd Shahir Bin Kasim, lecturers, friends, families and to those that helps me to finishing this report and research.
ACKNOWLEDGEMENT
I would like to show my sincere gratitude to my supervisor Dr Mohd Shahir Bin Kasim for the endless support of my Degree study and research, for his patience, motivation, and knowledge. His teaching helped me in all the time of research and writing of this report. Besides my advisor, I would like to thank my entire friend that gives contribution in finishing the study. My sincere thanks to my parents, Abdul Halim Bin Abdullah and Tengku Zainab Bt Tengku Hussin for giving support whether moral or monetary support in completing this report. Last but not the least, I hope that this thesis will benefits those who read it for the good of human sake.
TABLE OF CONTENT
LIST OF ABBREVIATIONS, SYMBOLS AND NOMENCLATURE xi
CHAPTER 1 : INTRODUCTION 1
1.1 BACKGROUND 1
1.2 PROBLEM STATEMENT 5
1.3 OBJECTIVE 6
1.4 SCOPE 6
1.5 ORGANIZATION OF REPORT 7
CHAPTER 2 : LITERATURE REVIEW 8
2.4.2 FEED RATE 13
2.4.3 DEPTH OF CUT 13
2.4.4 WIDTH OF CUT 14
2.5 AISI D2 TOOL STEEL 14
2.6 CUTTING TOOL PERFORMANCE 15
2.7 SURFACE ROUGHNESS 19
2.8 SURFACE FINISH PARAMETERS 20
2.9 SURFACE QUALITY 22
2.10 HIGH SPEED MACHINING 23
2.11 RESEARCH GAP 26
CHAPTER 3 : METHODOLOGY 37
3.1 INTRODUCTION 37
3.2 PROCESS FLOW CHART 38
3.3 WORKPIECE MATERIAL 39
3.4 CUTTING PARAMETER SETUP 41
3.4.1 PARAMETER SETTING 41
3.4.2 FACTORS SELECTION OF PARAMETER RANGE 42
3.5 MACHINE SPECIFICATIONS 43
3.6 DESIGN CNC PROGRAM 44
3.7 DESIGN OF EXPERIMENT (DOE) 45
3.7.1 STEP IN DESIGN OF EXPERIMENT 46
3.8 DOE MATRIX 48
3.9 MACHINING PROCESS 50
3.9.1 SAMPLE PREPARATION 50
3.9.2 MILLING MACHINE PREPARATION 50
3.10 MEASURING SURFACE ROUGHNESS 51
CHAPTER 4 : RESULT AND DISCUSSION 52
4.1 INTRODUCTION 52
4.2 THE SURFACE ROUGHNESS 53
4.3 ANALYSIS VARIANCE OF SURFACE ROUGHNESS USING RSM 54 4.4 DEVELOPMENT OF A MATHEMATICAL MODEL OF SURFACE
ROUGHNESS 56
4.5 CLARIFICATION MODEL FOR THE SURFACE ROUGHNESS 57
4.6 THE FACTORS INFLUENCING SURFACE ROUGHNESS 61
4.7 PURTUBATION PLOT 64
4.8 OPTIMIZATION MACHINING PARAMETER USING RSM 65
4.9 VALIDATION OF OPTIMIZATION MODEL 67
CHAPTER 5 : CONCLUSION AND RECOMMENDATION 70
5.1 SUGGESTION AND RECOMMENDATION FOR FUTURE STUDY 71
5.2 PROJECT POTENTIAL 72
REFERENCES 73
LIST OF TABLE
Table 1.1: Organizational report 7
Table 2.1: Tolerances requirements for dies and moulds (Fallböhmer et al., 1996) 23
Table 2.2: Tool Geometry 27
Table 2.3: Machine Parameter 30
Table 2.4: Findings for previous research 32
Table 3.1: chemical properties of AISI D2 tool steel (Hamidzadeh et al., 2012) 40 Table 3.2: mechanical properties at room temperature (Hamidzadeh et al., 2012) 40
Table 3.3: experimental conditions 42
Table 3.4: Machine specifications 44
Table 3.5: Programming codes 45
Table 3.6: DOE matrix 49
Table 4.1: Surface roughness for machining D2 tool steel 53
Table 4.2: ANOVA for experiment 55
Table 4.3: Surface Roughness value 56
Table 4.4: Optimization Parameter 66
Table 4.5: Estimated set of optimized parameters 66
Table 4.6: Comparisons between surface roughness model and experimental result 69
LIST OF FIGURE
Figure 1.1: Surface roughness profiles 3
Figure 2.1 End mill tool 10
Figure 2.2 End mill tool inserts (Palbit cutting tool supplier) 11
Figure 2.3 Cutting parameter of end mill 14
Figure 2.4: Edge fracture 16
Figure 2.5: A typical flank wear pattern observed on the solid carbide cutter 17 Figure 2.6 Chip during material removal due to adhesion (Koshy et al., 2002) 18 Figure 2.7: roughness and waviness profiles (Lou et al., 1998) 19
Figure 2.8: Surface roughness profiles 21
Figure 2.9: Explanation of chip formation during machining of hard steel 25 Figure 2.10: Overview of cutting speed and feed rate in the literature on AISI D2 tool
steel. 35
Figure 2.11: Overview on axial and radial depth of cut in the literature on AISI D2 tool
steel. 36
Figure 3.1: Material AISI D2 tool steel 39
Figure 3.2: HAAS 3-axis CNC milling machine 50
Figure 3.3: MITUTOYO SJ-301 51
Figure 4.1: Normal Plot Graph 58
Figure 4.2: Cook’s Distance graph 59
Figure 4.3: Predicted versus Actual graph 60 Figure 4.4: comparison between the results of the surface roughness between the
experimental and model, the average error of 9% 60
Figure 4.5: Factor feed rate and cutting speed on surface roughness 62 Figure 4.6: Factor width of cut and feed rate on surface roughness 62 Figure 4.7: Cutting speed and width of cut on surface roughness 63
Figure 4.8: Perturbation plots for experiment 65
Figure 4.9: the surface roughness can be obtained from the combination of parameter in
no 1 67
Figure 4.10: The surface roughness of optimized parameter with error 8%. 68 Figure 4.11: The surface roughness of random parameter with error 9% 68
LIST OF ABBREVIATIONS, SYMBOLS AND
NOMENCLATURE
HSM High Speed Machining
CNC Computer Numerical Method
RSM Response Surface Methodology
DOE Design of Experiment
ANOVA Analysis Of Variance
PVD Physical Vapor Deposition
CVD Chemical Vapor Deposition
MQL Minimum Quantity Lubricants
CHAPTER 1
INTRODUCTION
1.1 BACKGROUND
Milling is the process of highly versatile machining operations that can be performed in various ways on flat, curved or can be vertical or irregular surface with a variety of configurations by using a tool which is called milling cutter. This experiment performed because nowadays, the machining condition has become increasingly important in satisfying manufacturing requirements in term of product quality, time consuming, customer specifications and productivity. The product quality included the surface roughness that which has a small tolerance, and lowest surface roughness, Ra. According to Yih-Fong and Ming-Der (2005), Due to increase the productivity and throughput, High-Speed Machining of CNC milling technology has been increasingly used in the producing a mould and die. By Benardos and Vosniakos (2002), the automated of flexible manufacturing systems integrate employed for that purpose along using CNC machines that will be simultaneously increase high accuracy machining and with low the processing time.
most difficult material to be machined because of its high abrasion resistance, and high strength properties (Koshy et al., 2002).
To investigate the best surface roughness, each cutting parameter of milling operation needs to be studied in detail. Any changes on the parameter greatly affect the surface roughness. Based on previous research, (Buj-Corral et al., 2012), with reducing width of cut parameter, the roughness is decreasingly regardless of feed employed during machining operation. Surface roughness basically known to be highly affected by machining parameters consists of feed rate, cutting speed and depth of cut (Davim, 2010). The shape of cutting tool also is other factor considered in influencing the surface roughness, (Yasir et al., 2009). Other researcher Iqbal et al. (2008), is found that, the material inclination angle, radial depth of cut, this parameters that significantly affects surface finish after machining.
The experiment is performed on investigate the surface roughness when finish milling at several of milling parameter under flooded coolant systems. The low of Surface roughness commonly used to determine the best cutting parameters under various cutting parameters. This study aims to find the machining that will result in the lowest value of surface roughness. The response surface methodology (RSM) method is used for carrying out the design of experiment, analysis of variance (ANOVA), mathematical modelling, validation and optimization process. The experimental design has three parameters, consequently carrying out a total number of 17 experiments. According by Öktem et al. (2005), the use of Response Surface Methodology (RSM) could develop an effective methodology in determine the optimum cutting conditions which can producing a minimum surface roughness in milling operation.
Figure 1.1 exemplifies how the surface roughness for A and B have a lot of variation in terms of amplitude and valley but A is much rougher compared to B. It can be seen from figure 1.1 (A) that the highest amplitude is 16 µm and the lowest valley is -16 µm. For figure 1.1 (B), the highest amplitude is 8 µm and the lowest valley is -8 µm. It can be concluded that elimination of variation and lower amplitude can produce a better surface roughness.
The surface roughness is important in die making industries, when a die is made with lower value of surface roughness. The product made from the die will have a good dimensional tolerance and good surface finish. In automotive industries, the surface roughness is crucial in making an engine block. The surface roughnesses of piston and block have significant effect on the efficiency of the engine. In combustion of engine block, the energy generated in between the piston and block will be dissipated through irregular surface between block wall and piston. Moreover, the surface roughness is used
Figure 1.1: Surface roughness profiles
in brake pad application especially vehicle. The brake pad requires high surface roughness to ensure the gripping force is sufficient to slow down the vehicle. Furthermore, the ball bearing is made with high precision to assure the movement of ball bearing is smoothing thus reduced the friction between ball and its housing. When the friction is reduced, it will improve the rotational speed of a particulate application. Based on the example above, it shows that the important of surface roughness in an application. Kalpakjian (2001), mentioned that surface roughness design in particular application differs. Some examples are as follows:
• Bearings balls 0.025µm • Crankshafts bearings 0.32µm • Brake drums 1.6µm
• Clutch-disk faces 3.2µm
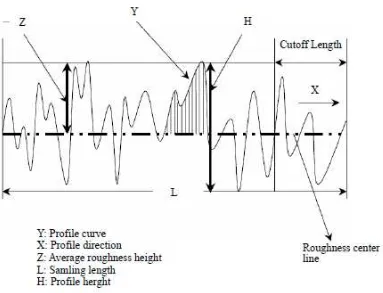
�� =�1�∫ �0� 2 (�)�� Equation 1.1
L= length
Z= Height
X= distance of measurement
Refer to Equation 1.1, as illustrated a theoretical measurement length of L is characterize as the length of profile used for the analysis of surface roughness parameters. Generally containing a few inspect length, the five successively samplings length are taken as standard. Rq is the rms parameter corresponding to Ra. Surface roughness texture can be separated into two types consists of:
a) Amplitude parameter – a measures of the vertical characteristics of the surface deviations
b) Spacing parameters – a measures of the horizontal characteristics of the surface deviations
1.2 PROBLEM STATEMENT
In identifying surface roughness quality, research on factors which control machining performance of milling machine parameter has been performed to analyze the effect of cutting parameters on surface roughness. To obtain good surface roughness during machining process, the most important thing is to make sure the parameter that will be used is suitable with the type of work piece material, otherwise probably the surface machining will be exposed to various types of defects. The improvement of quality of cutting process for high-speed machining on industries will result in increased customer demand for better quality products in the process of cutting metals. In machining process, a more precise tolerance can produce a product with better quality surface roughness. Among the metal cutting metal materials, end mill is one of the tools which are involved in the process. Surface roughness in mould and die is most important factor to represent the functionality of the products produced. Determining the accuracy of the cutting of parameters is very important before machining process is performed as to determine the level of quality of the surface. There are three parameters that are chosen in this research, cutting speed, feed rate, and depth of cut. These three parameters that had been selected are to determine the effect cutting parameters on surface roughness and the best cutting variable that can be produced the minimum value of surface roughness.
1.3 OBJECTIVE
The purposes of this study are:
I. To investigate the effect of cutting parameter namely cutting speed, feed rate and width of cut on surface roughness at the end of milling process on D2 tool steels material
II. To develop mathematical model using Response Surface Methodology (RSM) method by generating from the Design expert software
III. To identify the optimized cutting parameter under flooded coolant system.
1.4 SCOPE
The scope of the study is mainly to determine the best cutting parameter during machining operation. The selected cutting parameters consists of cutting speed, feed rate, and width of cut as variable input in order to obtain a minimum quality of surface roughness in the end mill process. The materials being used in this experiment is AISI D2 tool steel with hardness of 62HRc. The machining process is conducted by using 3-axis CNC milling machine. Strategy machining that is climb milling is used for a cutting operation which starts at the surface of the work piece where the chip is thickest. The machining process is carried out under flooded machining condition with using fresh tool for every run of experiment. The linear cutting motion is used on the machining method perform on the work piece during the machining operation. Surface roughness obtained from the machining process will be measured by using a portable Mitutoyo SJ-301. After that, the data gained will be interpreted and analyzed with using Response Surface Methodology (RSM) to obtain the best cutting condition in producing the lowest surface roughness.
1.5 ORGANIZATION OF REPORT
The report of Projek Sarjana Muda(PSM) will cover the whole project that need to be
done by fourth year student. The report cover sixth chapters consist of chapter 1 introduction, chapter 2 literature reviews, chapter 3 methodologies, chapter 4 results and discussion, chapter 5 conclusions and chapter 6 is reference. The summary of the organization of this report is represented in table 1.1:
Table 1.1: Organizational report
• Organization of report
2 • Literature review containing the theory involves that taken from journal and books.
3 • The method that have been used to achieve the objective of this research
• Suggestion and recommendation
6 • references
CHAPTER 2
LITERATURE REVIEW
2.1 BACKGROUND
Milling contains a variety of machining operations that includes variety of configurations which use milling cutter that is made up from multi tooth tool which produce lot of chip in one revolution (Kalpakjian and Schmid, 2013). Types of milling include peripheral milling, face milling, and end milling. Other operations of peripheral milling are straddle milling, form milling, slotting and slitting. In peripheral milling the axis of cutter rotation is parallel to the work piece surface (Kalpakjian and Schmid, 2013). Meanwhile for face milling operations the axis of the cutter is perpendicular to the work pieces surface (Kalpakjian and Schmid, 2013). Face milling process basically it is used to remove the upper surface of work pieces and commonly used for roughing process. In end milling process it is the same as with face milling but, it is capable to produces various profile and curves surfaces.
2.2 END MILLING
made from high speed steels or with carbides inserts, similar with face milling. The milling cutter basically rotates on an axis perpendicular to the work pieces surface during machining, and it’s also can be tilted to conform machine tapered or curves surfaces. Based on previous researches Saedon et al. (2012). Saedon et al. (2012), Material deposited onto the cutting edges and on the end face of the tool will have a direct influence on cutting forces and work piece surface roughness.
2.3 END MILL CUTTER
Figure 2.1 End mill tool
Figure 2.2 End mill tool inserts (Palbit cutting tool supplier)
The end mill cutter can be divided into two parts which are solid end mills and inserted end mill. The figure 2.1 show the milling tool holder for insert end mill is made from a hardened material and the figure 2.2 show the end inserted end mill cutter, when the tips (inserted) will be change if the tips have a bad sharpens. The material of inserts is made from physical vapour deposition (PVD) Titanium Aluminum Nitride TiAlN. Based on research by Koshy et al. (2002), TiAlN coated carbide tools were suitable, with the tool life being dependent primarily on the cutting speed. According to López de Lacalle et al. (2002), Coated tools are specially suited to those situations in which an improvement of abrasive wear resistance, a reduction of chemical affinity between workpiece material and tool material or an improvement in friction conditions is required. Thus in order to enhance machining capability of carbide cutting tools, they are normally coated with single or multi-layers of hard, wear resistant TiN, TiCN and TiAlN coatings by chemical vapour deposition (CVD) or physical vapour deposition (PVD) techniques (Prengel et al., 2001). The tool performance is of the factors that influencing the quality of surface roughness.
2.4 MACHINING PARAMETERS
in the cutting speed of machining, the feed, and the depth of cut it will simultaneously decrease the life of cutting tool during machining operation.
There have several factors also affect the tool life during machining which is type of lubricant, cutting forces, and type of tool material. According to Zhang et al. (2012), the tool life under minimum quantity lubricants (MQL) the cutting condition is using the cryogenic compressed air and the micro droplets of the biodegradable vegetable oil increase the tool life and the tool wear significantly. In their research, it is found that the lower cutting forces under Minimum Quantity Lubricants, the cutting condition has relatively slight tool wear due to its superior cooling and lubrication performances. Based on two finding above, tool life will increase when feed rate is decrease. Other factors that may increase the tool life are speed, types of lubricant and dept of cut.
2.4.1 CUTTING SPEED
Cutting speed, Vc (m/min) is defined as the surface speed at diameter of the cutter rotating moving past a work piece. Based on Liao et al. (2007), the cutting force of milling operation will decrease slightly to the cutting speed is increase. Through the research by Özel et al. (2007), the parameters which are cutting speed, feed rate, depth of cut and the radius of tool nose which significantly influence the effect of surface roughness.
Equation 1.1
Based on equation 2.1, where D is diameter (mm) of cutter and N refers to the spindle speed (rev/min).
2.4.2 FEED RATE
Feed rate, Fz (mm/tooth) is the distance, that the tool is moving or “fed”, through the work piece makes finish one revolution, divided by the number of effective cutting edges on the tool. Based on Özel et al. (2007), at the lowest feed rate and the highest cutting speed it will produce the best of surface roughness. From the equation 2.2, generally the unit of feed rate is given in mm/tooth.
��= �
��(��/����ℎ) Equation 2.2
Where v is the linear speed of the work piece or feed rate, mm/min and n is the number of teeth on the tool.
2.4.3 DEPTH OF CUT
Depth of cut, ap (mm) is a depth of cutting tool move down vertically to machining the thickness of material by one pass revolution of the cutting tool. According to Ozcelik and Bayramoglu (2006), the cutting parameters consists of feed rate, depth of cut and cutting speed is influencing on the surface roughness. Depth of cut basically is related to the efficiency of the cutting process. The deeper of the cutting process will affected the production rate. The rate of cutting is depends on the strength of the cutter and the material to be cut. For a certain cutter typically the range of cut will be recommended by the supplier. However a finer cut is usually associated with a better surface and for a long tool life. The figure 2.3 show machining operation against the work piece related to the milling parameters.
Figure 2.3 Cutting parameter of end mill
2.4.4 WIDTH OF CUT
Width of cut, ae (mm) can be described as the paths of cutting tool moving along the workpiece surface, see the figure 2.3. Basically the width of cut is less than the cutter radius. The cutter is only partially engaged and making a peripheral cut during milling operations. A highest width of cut will require a lowest feed rate. The result in a highest width of cut will affected tool and reduce the tool life (Zhang et al., 2012).
2.5 AISI D2 TOOL STEEL
process, tool steel basically machined in the annealed condition in to exhibits minimal distortion in heat treat. Tool steel material is available in round, flats and squares, flat stock and drill rod. According to Bourithis et al. (2006), the research was conducted is analyze the wear characteristics of two commercial tool steels which are AISI D2 and O1. The both of this material with have the same hardness of 60 HRC tested by using pin-on-disk. From the result obtained, the tool steel microstructure is important role to determine the wear properties of their material. Tool steels materials basically used in application of high temperature, resistant to wear, cutting tool, and mould applications (Bourithis et al., 2006). Based on Budinski (1992), the tool steel material can be classified into six categories which is: cold work, shock resisting, hot work, high speed, mold and special-purpose tool steels. Among of this material, cold work tool steels are very important part, as they are widely used for making of tool and dies. Other than that, applications that need high wear resistance and low cost is most suitable for this material, Glaeser (1992). In general by, Budinski (1992) various tool steels basically fulfil the requirements for a given application, so that final choose is guided by considering the tool life as well as the cost of material and fabrication.
2.6 CUTTING TOOL PERFORMANCE
Basically cutting tool performance can be described as the ability of tool to maintain a stable condition in term of strength, hardness, and thermal resistance. Based on the previous research by Alauddin et al. (1997), the cutting tool deteriorate are due to the edge fracture and plastic deformation. Other researcher Becze et al. (2000) found that complex tool path also affect the tools wear. Based on the figure 2.4, it can be seen that the fracture occur at the end of the tool insert.
The factors that cause the fracture are cutting speed, width of cut, and depth of cut. Other than that based on the research by Koshy et al. (2002), flank wear are caused by chipping, adhesion and attrition during milling process.
Figure 2.4: Edge fracture
Figure 2.5: A typical flank wear pattern observed on the solid carbide cutter (Koshy et al., 2002)
The figure 2.5 is show a typical flank wear occur on solid carbide tool. According to research done by Alauddin et al. (1997), found that an increased in the speed, the feed rate, and the axial depth of cut, it will decreased tool life. The figure 2.6 show the adhesion between the chip and the cutting edge at the maximum chip load location, were strong enough to support chips adhering to each other during the cutting (Koshy et al., 2002).
Figure 2.6 Chip during material removal due to adhesion (Koshy et al., 2002)
Based on Koshy et al. (2002) also the large volume of high-hardness undissolved chromium carbide particles in the D2 that are responsible for imparting good wear resistance to the material, also promote attritions wear of cutting tools and renders the material extremely difficult to machine.
2.7 SURFACE ROUGHNESS
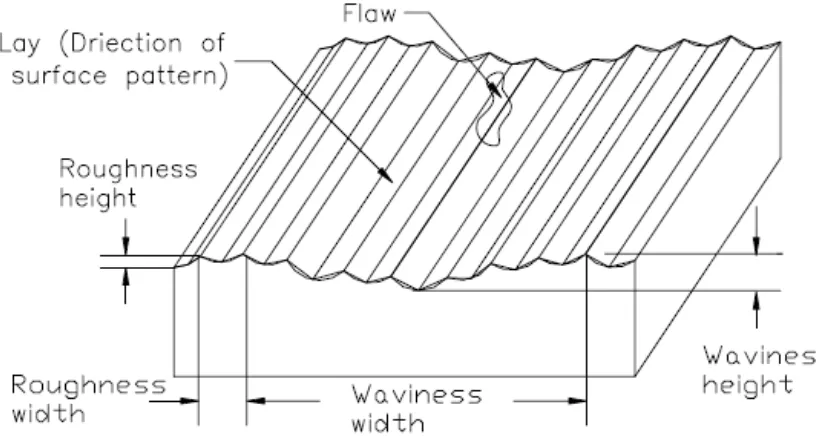
Surface roughness is defined as the surface irregularities which result from the several of machining conditions. These irregularities mean that the surfaces are combining to form surface texture. Surface roughness has proportion influences on product quality. Moreover a good quality of surface roughness obtain from the machining is significantly improves fatigue strength, corrosion resistance and creep life of the part. Other than that, the quality of surface roughness also affect several function of part or products such as contact causing surface friction, wearing, light reflection, heat transmission, ability of distributing and holding a lubricant, coating, or resistance fatigue (Lou et al., 1998). Profile of surface roughness and waviness are shown in figure 2.7
Figure 2.7: roughness and waviness profiles (Lou et al., 1998)
In machining process, the common parameters that affect the surface roughness are cutting speed, feed rate, and type of lubricant, depth of cut and width of cut. Based on Liao et al. (2007), the milling parameters of feed rate and lubricating method have significant affected on quality of surface roughness and they discover that the quality of surface roughness increased by increased the feed rate. There are several factors that contradict the feed rate in affecting the surface roughness where high cutting speed will reduced the value of surface roughness. The previous research by Ozcelik and Bayramoglu (2006), the cutting parameter is the important part in producing a minimum surface roughness and long tool life. the minimum surface roughness was obtained when the cutting parameters was set at the lowest of feed rate and highest of cutting speed (Özel et al., 2007). The differences of machining process parameters will impact the quality and specifications of the products surface. At the same time the result of the higher surface roughness can affect the product performance in terms of friction, durability, operating noise, and energy consumption.
2.8 SURFACE FINISH PARAMETERS
Basically the surface parameter is used to determine the average surface finish. The surface finish may specify in several of machining operations. One of the parameters of surface finish specifications is roughness average, Ra. This parameter also known as the arithmetic mean roughness value, arithmetic average (AA) or centreline average (CLA) (Lou et al., 1998). Ra is recognized widely used as the most common international parameter of roughness (Standard and ISO, 1997). According to Gokkaya and NALBANT (2006) The average roughness (Ra) is the area between the roughness profile and its centre line, or the integral of the absolute value of the roughness profile height over the evaluation length (Figure 2.8). Therefore, the Ra is by the following equation:
Figure 2.8: Surface roughness profiles
The Roughness average (Ra) is also namely as the arithmetic mean roughness value, arithmetic average (AA) or centre line average (CLA), see equation 4. Ra is basically known and the most used international measurement of surface roughness. The equation of Ra is shown below.
Equation 2.3
L = Sampling length y = Ordinate profile curve.
Other than that, the Root-mean-square (rms) roughness or (Rq), is root mean square parameter corresponding to Ra, see equation 2.4
Equation 2.4
Since Ra and Rq are the most widely used in determine the surface parameters in industry, Ra was selected to analyze the surface roughness in this study.
2.9 SURFACE QUALITY
The quality of surface machining can be defined as the accuracy of its manufacture with consideration to the dimension stated by the actual size of the part or products. During machining operation there have characteristics information on the machined surface. This characteristics information included of finely spaced micro irregularities left by the cutting tool. Every type of cutting tool leaves in various pattern of machining surface. This arrangement is known as surface irregularities or surface roughness. According to Fallböhmer et al. (2000), Finishing process is a critical part in industry that contribute the highest share of manufacturing lead time for die casting, injection molds, and forging dies. In the certain case of large automotive stamping dies, finish machining has significant part of the total production time (Fallböhmer et al., 1996). Quality surface machining also give the impact on benching time in polishing and grinding is about 15 percent for die casting and injection molds, 20 percent in sheet metal forming dies (Fallböhmer et al., 1996). With the finish the higher of surface quality it will allow a reduction of the benching time. In die and moulds manufactures, the main objective using high speed machining is to minimize a polishing process and decrease the processing lead time time for finishing process. Table 2.1 is showing the averages values of dimensional and form error for dies and mould
Table 2.1: Tolerances requirements for dies and moulds (Fallböhmer et al., 1996)
Average Dimensional Error (mm)
Average from Error (mm)
Injection Molds 0.020 0.015
Die Casting Dies 0.046 0.041
Stamping Dies 0.061 0.043
Forging Dies 0.028 0.023
These results were used to recommend machining practices with reduce the tolerance of product for improved surface finish quality and hence minimizing cycle time, thus improving productivity. Basically finishing process is a critical part in industry to producing a product based on mould and die. According to Lee et al. (2006) the requirements surface roughness in finishing process for plastic moulding is 0.1 µm or smaller than the value.
2.10 HIGH SPEED MACHINING
High speed machining (HSM) is not simply as high cutting speed, it should be regarded as a process where the operations are performed with very specific methods and production equipment. According to Coromant (1994), the requirements high speed machining for die and mould which is:
Cutting data
Typical cutting data for solid carbide end mills with a TiC,N or TiAlN-coating in hardened steel: 48-58 HRC.
Semi-finishing
True vc: 150-200 m/min, ap: 3-4% of the cutter diameter, ae: 20-40% of the cutter diameter, fz: 0,05-0,15 mm/z
Finishing and super-finishing
True vc: 200-250 m/min, ap: 0,1-0,2 mm, ae: 0,1-0,2 mm, fz: 0,02-0,2 mm/z
High speed machining process enable manufactures to reduce the time machining and to achieve a higher surface quality. According to Fallböhmer et al. (2000) machining of alloy steel usually hardness more than 30 HRc will result the cost effective technology by using advance machining tools. In addition machining of alloys steel in hardened state at high cutting speeds will leads to elimination of distortion and reduction of finishing operations, if the part is finish-machined after heat treatment, achievement of high metal removal rates, Lower machining costs and improved surface integrity (Tönshoff et al., 1986)
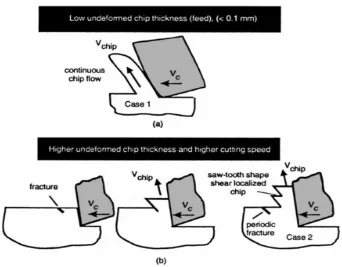
Figure 2.9: Explanation of chip formation during machining of hard steel (König et al., 1993)
The machining of hard material basically producing continuous chip formation is observed at conventional due to high cutting speeds and minimum to moderate of feed rates, Figure 2.9 a. However, at maximum of feed rates “saw-tooth” chips are produced, figure 2.9 b (K.Nakayama 1974). based on figure b, the chip pattern can cause cyclic variations of both cutting and thrust forces and the result in high frequency vibrations that affect tool life and failure (Davies et al., 1996). Recent study by Elbestawi et al. (1996) the fracture on surface of the work pieces spread inside the chip until the stress state is change from a low to high compressive stress region. Based on the findings by the researchers discussed above it can be concluded that common chip type observed in hard part machining are continuous chip at low undeformed chip thickness and saw-tooth shape at high undeformed chip thickness. The cutting edge is dependent to a high frequency force variations and also the chip formation absolutely affects the cutting forces.
2.11 RESEARCH GAP
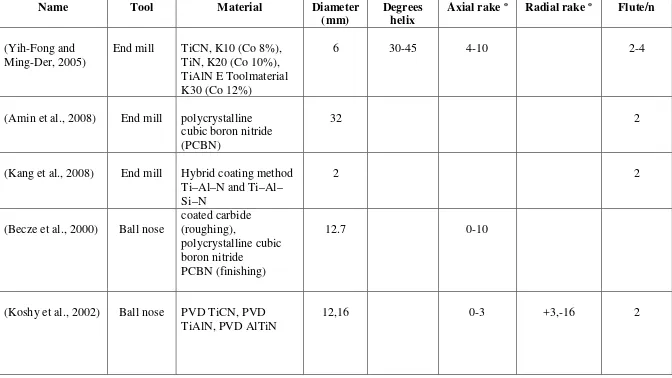
The table 2.2 is show the tool geometry that has been used in the previous research. The factors of tool geometry are influencing the surface roughness during machining process. The factor consists of tool type, tool material, tool diameter, degrees helix, axial rake, radial rake and number of flute.
Table 2.2: Tool Geometry
Name Tool Material Diameter
(mm)
(Amin et al., 2008) End mill polycrystalline cubic boron nitride (PCBN)
32 2
(Ning et al., 2001) Ball nose TiAlN 12 30 0-3
Supplier recommended (Palbit cutting tool)
End mill TiAlN 20 2
(Pu and Singh, 2013)
Ball nose PCBN TiAlN
19 0
(Fallböhmer et al., 2000)
Ball end TiN 25.4
(Camuşcu and Aslan, 2005)
End mill TiAlN
TiCN mixed Al2O3
35 0 0 2
(Liao et al., 2007) End mill TiAlN and TiN 16 20
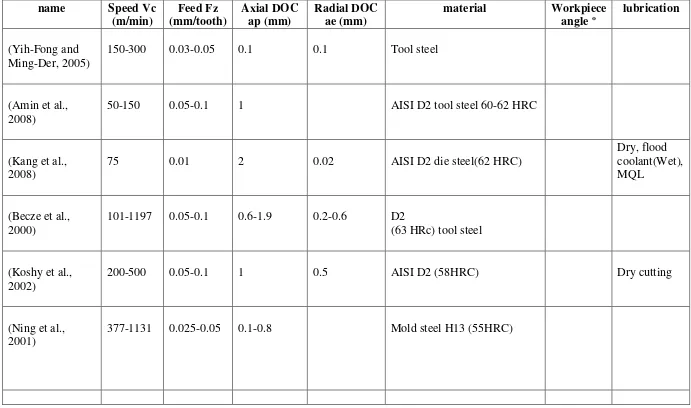
Based on the table 2.3, the machine parameter used by previous researchers consists of cutting speed, feed rate, axial depth of cut, radial depth of cut, material stock, work angle and type of lubricants are listed as a research gap. According to table 2.4, is show the majority finding based on the previous researchers. This literature review contains a result, method and finding based on that research.
Table 2.3: Machine Parameter
377-1131 0.025-0.05 0.1-0.8 Mold steel H13 (55HRC)
Supplier recommended (Palbit cutting tool)
140-210 0.1-0.3 0.5-9.0
(Pu and Singh, 2013)
120-470 0.18 0.12 0.25 AISI A2 at 64 HRC 45 Dry cutting
(Fallböhmer et al., 2000)
150 0.7 0.25 0.75 D2 tool steel (59 HRC) Dry cutting
(Camuşcu and Aslan, 2005)
100-200 0.1 0.4 30 AISI D3 steel (35HRC)
(Liao et al., 2007) 150-250 0.1-0.2 0.6 5 NAK80 die steel (41HRC)
dry cutting, flood coolant, and MQL
Table 2.4: Findings for previous research
AUTHOR FINDINGS
(Yih-Fong and Ming-Der, 2005)
• Apply Taguchi dynamic to construct an optimal high speed Milling with high quality • flank wear has been significantly improved at the optimal conditions
• The average surface roughness between the range of 0.2533–0.4833 mm (21-23 HRc) and 0.1833–0.3617 mm (17-19 HRc)
(Amin et
al., 2008) • Chips producing are composed of primary and secondary serrated teeth
• Average flank wear of the tool during preheated machining is found to be slightly higher compared machining at room temperature
• Cutting speed, preheating and amplitude of chatter have direct affecting on the surface roughness.
• preheated machining of the material influence to surface roughness values well below 0.4 µm
(Kang et al.,
2008) • cutting under flood coolant condition results in the shortest tool life due to severe thermal cracks
• MQL leads to the best performance
• As the cutting length increased, the tool wear increased proportionally.
• In wet condition of the cutting fluid, the tool suffers serious thermal fatigue, and the tool wear rapidly increases compared to the dry and MQL conditions
(Becze et al., 2000)
• The tool failure mode was largely chipping at the lowest cutting speed zone (101 m/min).
• D2 tool steel, the tools failed prematurely and repeatedly by extensive chipping in the middle of the length of contact
• An average surface finish of 0.3 µm was achieved, increasing to 1 µm at the wall, even with the effect of vibrations present due to the machine dynamics.
• The tool life for PCBN at cutting speeds in excess of 1100 m/min was also found to be acceptable.
(Koshy et
al., 2002) • Work piece surface roughness values were in the range 1–6 mm Ra
• work piece surface roughness results (Ra) obtained at various cutting speeds with indexable insert and solid carbide tools, respectively
• Work piece surface roughness increased as tool wear progressed, and hence in many applications the roughness rather than the maximum flank wear land width could be the limiting factor that determines tool life.
• The roughness obtained with the unworn indexable insert tools was lower than the corresponding values obtained with the solid carbide tools.
(Ning et al., 2001)
• The higher cutting speed and feed rate, the darker color of the chip. Means higher extend of oxidation that leads to a higher temperature.
• Different of chip formation is found to be movement of cutting edge under different cutting conditions.
(Pu and Singh, 2013)
• Coated carbide tools are not suitable in the HSM range since it produces the highest Ra value.
• the surface roughness from the coated carbide tool increases much more significantly than PCBN
• This could be caused by higher cutting forces generated by the coated carbide tool (larger cutting edge radius) which led to more vibration.
• The low content PCBN tool generates higher surface roughness values and is as expected since the chipping and flaking occurred at 32 m cut length
• Milling using coated carbide tool at 120 m/min induces more ploughing effects on the workpiece surface which leads to high surface roughness, large hardness increase, dragging of the material, crack initiation and microstructural changes.
• Effects on the performance of die/mold and also increase the total cost by increasing the difficulty for manual polishing.
(Fallböhmer
et al., 2000) • At Vc = 60 m/min tool life was twice as high for PCBN than for TiN coated inserts • Cutting speeds at 550 m/min and more were not practicable under engagement
conditions, because the inserts shattered due to overstress
(Camuşcu and Aslan, 2005)
• Work piece surface roughness obtained with coated carbide and cermet tools (Vc = 100 m/min).
• unworn tools produced better surfaces compared with worn tools
• Both CBN and TiCN mixed Al2O3 ceramic tools proved to be suitable for high speed end milling of AISI D3 with 35 HRC.
• TiAlN is a better coating material than TiCN for the machining applications of hardened tool steels
(Liao et al.,
2007) • MQL was effective especially at low cutting speed (for example 75 m/min)
• MQL is effective as well even when the cutting speed is as high as 250 m/min. The reason of this difference may be due to the tool and the oil of MQL used
• the coated carbide tool with higher heat resistance and the oil with a better cooling effect
• The temperature is very high in high-speed cutting, which leads to very short tool life • low-speed cutting, the cutting temperature is not high enough to exceed the limitation
that the cutting edge can withstand
• value of surface roughness rises when the feed rate is increased
• At a lower cutting speed (such as 150 m/min), the surface roughness in flood cooling is lower than that in dry and MQL cutting
• As cutting speed is increased, thermal cracks of the cutting tool become more severe • the surface roughness in dry and MQL cutting decreases as cutting speed is increased
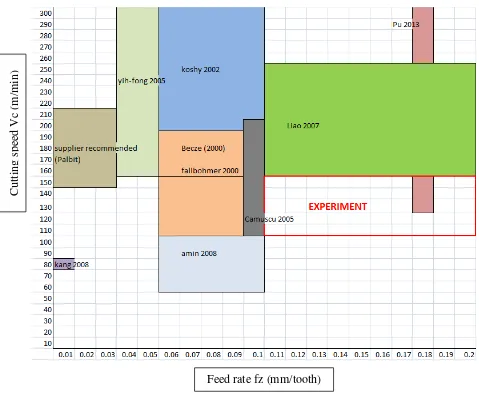
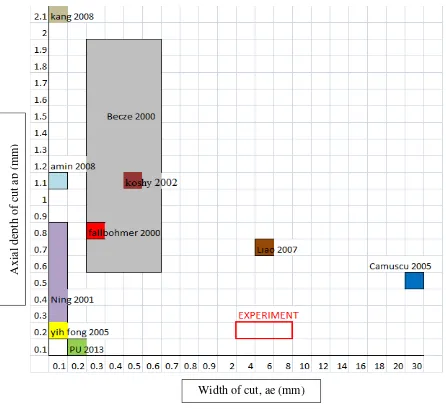
The parameter settings used in previous studies are compiled in figure 2.10 and figure 2.11.
Figure 2.10: Overview of cutting speed and feed rate in the literature on AISI D2 tool steel.
C
uttin
g s
pe
ed
V
c (
m/min
)
Feed rate fz (mm/tooth)
Figure 2.11: Overview on axial and radial depth of cut in the literature on AISI D2 tool steel.
A
xi
al
de
pt
h of
c
ut
a
p
(m
m
)
Width of cut, ae (mm)
CHAPTER 3
METHODOLOGY
3.1 INTRODUCTION
This section contains the procedures and method to achieve the objective of this research. The chapter is to ensure that the project is following the time that is given to complete this research. The equipment and machine that will be used to carry out this project will be explained, and also the material parameters will be outlined.
The quality of a milling surface is a key to investigate the effect of machining parameters on surface morphology. The parameters of the machine include cutting speed, feed rate, radial deep of cut and axial deep of cut will be analyzed in order to compare different result of varying parameters. The material work piece is AISI D2 tool steel with hardness of 63 HRc was used in experiment for determining the surface finish at the end of machining. The end milling operation was conducted using a 20mm diameter tool fitted with one flute inserts. The cutting tool is coated using physical vapour disposition PVD TiAlN with the code of APKT 100308 PDER-X PH 6920, supply by PALBIT cutting tools manufacture. End mill process is performed flooded coolant system. Machining process was conducted on 3-axis CNC milling machine of model HAAS (VF-10).
There are several other aspects that should be considered in achieving the objective of this experiment is:
1. Different machining parameter that need to tested 2. Work piece material that will used
3. Tool quality
4. Type of machine (capability of machine)
5. Method used to analyze the result in the experiment
3.3 WORKPIECE MATERIAL
The work piece material selected for this experiment is D2 tool steel, the figure 3.1. This material widely used in aerospace application. Apart from that, it is also used in tool die making. According to Hamidzadeh et al. (2012) AISI D2 tool steel and belong other group D of cold work tool steels that are high carbon- and high chromium-contained steels which used broadly in machining and manufacturing applications. High carbon steel also belongs to D2 tool steel group. AISI D2 contains high chromium tool steel alloyed with general properties that are:
• High wear resistance • High compressive strength
• Good through-hardening properties • High stability in hardening
• Good resistance to tempering-back.
Figure 3.1: Material AISI D2 tool steel
Table 3.1 and table 3.2 are showed the chemical properties of tool steel and the mechanical properties of that material.
Table 3.1: chemical properties of AISI D2 tool steel (Hamidzadeh et al., 2012)
Element Weight %
Mo (Molybdenum) 0.70-1.20
V (Vanadium) 0-1.10
Fe (iron) 81.6-86.9
Table 3.2: mechanical properties at room temperature (Hamidzadeh et al., 2012)
Mechanical properties Description
Density (×1000 kg/m3) 7.62-7.78 Young’s modulus (GPa) 205-215
Poisson's Ratio 0.27-0.30
Yield strength (elastic limit) ×1000 MPa
1.86-2.29
Tensile strength ×1000 MPa 2.1-2.5
Harness- Rockwell C 58-64
Elastic Modulus (GPa) 190-210
3.4 CUTTING PARAMETER SETUP
3.4.1 Parameter Setting
The objective of this research is to identify the surface roughness using end mill in order to test several type of parameter that will be used in this experiment. The parameter of CNC milling machine consists of cutting speed, feed rate, depth of cut, and width of cut. The parameters are set up according to the range of the CNC milling machine. The depth of cut, ap 0.2 mm is set to constant for this experiment. The experimental condition and the parameter set are shown in table below. The table 3.3 is show the variable input consists of cutting speed, feed rate, axial depth of cut, and radial depth of cut. The selection of cutting parameters is taken after considering from the previous study that had been measure in chapter 2 of literature reviews. The work piece material used for this experiment is AISI D2 tool steel with hardness 63 HRC. A 200 mm x 210 mm x 100 mm block was smoothen at a maximum of 0.5 mm on the surface to remove any defects or irregularities from previous process. The cutting tools were made of tungsten carbide coated with PVD titanium aluminium nitride (TiAlN). An insert was attached to the tool holder with a 20 mm diameter.
Table 3.3: experimental conditions
3.4.2 Factors Selection of Parameter Range
1. The range of cutting speed,Vc for high speed machining on tool steel material is between 100-300 m/min based on coated carbides cutting tools (Luis N.Lopez et al.,2002). The selection of cutting speed also based on the previous research. With reference from the tool manufacture (PALBIT cutting tool), it is recommended to used the value of cutting speed between 140 m/min (minimum) and 210 m/min (maximum)
2. Basically, Feed rate (fz), are affecting the surface finish in machining process. The ranges are 0.1-0.3mm/tooth is the same from manufacturer recommendation (PALBIT cutting tool). Where 0.1 mm /tooth are a minimum value and 0.2 mm/tooth (maximum).
3. Axial depth of cut (ap) is used for finishing process as a cutting range, where the value is 0.2 mm and it is constant. According a Luis Lopez et al.,
CONDITIONS DESCRIPTION
Cutting speed, Vc (m/min) 100-150 Feed rate, fz (mm/tooth) 0.1-0.2 Width of cut,ae (mm) 2.0-8.0
Coolant type Flooded coolant system
(2002) axial depth of cut is 0.2 mm for semi finishing operation in order to avoid crossing of semi-finishing on the previous machining (which would produce important change of the cutting forces).
4. Based on Buj-Corral et al. (2012) at low radial depth of cut (ae=0.05 mm), experimental roughness values obtained are quite similar, regardless of feed Fz employed and at higher ae values, feed Fz has a great influence on surface roughness obtained. In the experiment the range of ae is 2.0-8.0 mm, the high value of width of cut, ae is choose because it can more clearly to see the marks generated on a flat surface during milling process.
3.5 MACHINE SPECIFICATIONS
The HAAS (VF-10) CNC milling machine is a machining centre by numerically controlled machine tool designed to shape cold metal by the application of rotating cutting tools capable of performing two or more machining processes, example boring, drilling, milling, thread tapping. The table 3.4 is showing the machine specifications.
Table 3.4: Machine specifications
SPECIFICATIONS DETAIL
Travels x = 610mm y = 500mm z = 610mm Rapid traverse 43m/min in x and y (1690in./min)
36m/min in z (1410in./min)
45mm diameter ballscrew (1.8in.)
Maximum speed 7,500 rpm
Feed rate 12700 mm/min
Acceleration (m/s2) GE Fanuc: x = 6.0 y = 5.0 z = 4.0 tool changer 24 position
3.6 DESIGN CNC PROGRAM
This experiment is conducted with using CNC milling machine and the programming should be creating directly on the CNC machine which called Manual Data Input (MDI). In CNC program, there is programming language that called G and M codes. CNC program need to be setup and programmed in order to evaluate the desired cutting direction. The operation of CNC machine tool is controlled by program design which called NC part program. The CNC program involves a sequences of block, being originally commands indicates the direction to be execute and the auxiliary operations (for example spindle on/off, spindle speed, feed rate) to be finished by the CNC machine.
function code while M-codes is namely miscellaneous function code basically used in operation on/off. Table 3.5 show the basic programming codes include G and M code.
Table 3.5: Programming codes
I,J,K Coordinates values of arc centre P or Q Parameter in machining cycle block
F Feed rate
3.7 DESIGN OF EXPERIMENT (DOE)
In this experiment a response surface methodology (RSM) with using Box-Behnken approach is implemented. There are 17 run number of experiment that needs to be performed. Design of experiment (DOE) is a technique of defining and investigating all the possible conditions in the experiment involving various factors. According to Goujot et al. (2012), the design of experiment (DOE) will be considered as the optimization of the experimental effort required to identify unknown parameters with minimal confidence intervals. With using DOE the scientific process for variable used in experiment that will yield statistically useful result. Roy.R (1990) mentioned that using full factorial DOE may contribute to the following:
• The experiments become unwieldy in cost and time when the number of variable is large;
• Two designs for the same experiment may yield different results; • The designs normally do not permit determination of the contribution
of each factor;
• The interpretation of experiment with a large number of factors may be quite difficult.
3.7.1 STEP IN DESIGN OF EXPERIMENT
3.7.1.1 Design the Experiment
This step is to develop all the ideas and the objectives of this experiment. The objective is based on selected topics about the effect width of cut on surface roughness during end milling of D2 tool steel. Through this objectives is helpful to prepare a list of specific problem that are occur during experiment were perform. The problem considerably to improve being studied and the final solution of the problem can be making it. The objective of this research is to study the effect of cutting parameter on surface roughness. After the surface roughness is analyze the optimizing cutting parameter was perform by using mathematical model is generates from analysis of variance (ANOVA)
3.7.1.2 Define factor and variable constraints
The experiment have three parameter that will be tested consists of cutting speed, feed rate, and radial depth of cut. With three of the parameter, the model can be produced contains 17 runs of experiment by using full factorial design analysis.
3.7.1.3 Add interaction term
The effect of surface roughness and surface texture it depends on the parameter that is set and other some factor. Other factor which is the vibration of machine, human error, apparatus faulty, calibration, and etc also is affected to the result obtained.
3.7.1.4 Determine the number of run
Full factorial experimental design was perform by the box-Behnken approach to investigate the effect of the three process parameters without the repetition of experiment. The experiment carried out generally, there were three model and was completed with 17 runs for three parameters that is set.
3.7.1.5 Check the design
Considering the factor that causes the effect of surface roughness and the interactions of the studied parameter variables with related to the result obtain. From the result ANOVA and regression analysis is performed to get the significant effect of the model that is design.
3.7.1.6 Gather and enter the data
The data collected during the experiments carried out are based on variable parameter model that has been made accordance with the objectives set. The data is based on the effect width of cut (mm) on surface roughness (µm) and there are three different parameters that need consider during experiment. After the data obtained it need to fulfil the data in the software (Design Expert) to make analysis of variance in to determine the significant of each parameter that are tested.
3.7.1.7 Analyze the result
The result will be analyze based on the data obtain. The chapter 4 is about the data collection will be discussing the relationship between the parameter will response the result.
3.8 DOE Matrix
The table 3.6 shows the numbers of cutting parameter that need to be tested. There are three parameters which are cutting speed, feed rate, and radial depth of cut. The surface roughness will be measure after machining process is done.
Table 3.6: DOE matrix
3.9 MACHINING PROCESS
3.9.1 SAMPLE PREPARATION
The work piece material of D2 tool steel taken from the laboratory and then the size is measured by using measuring tape. The measurement of the work piece is 200mm x 210mm x 100mm. Before start the machining process, the surface of this material need to be milling (facing). As a facing process the work piece is requires 90 degrees flat milling table, then the work piece is square milled by using face milled. The reason for accomplishment facing process is to remove the contaminant and corrosive at the surface of the work piece. At the first stages facing process however is not affect the end result of surface roughness parameter.
3.9.2 MILLING MACHINE PREPARATION
The end mill have two insert made from TiAlN with the diameter 20mm is place in a tool holder. Based on the NC program the tool holder is set as tool 1 (T1) placed into a proper tool slot. Before the machining is start, the air gun is used to clean off a chip or dirt that lingers on the milling cutter and the milling table. The machine that will used is shown in figure 3.2
Figure 3.2: HAAS 3-axis CNC milling machine
3.10 MEASURING SURFACE ROUGHNESS
Surface roughness testers are the method to investigate the surface roughness on the work piece after the machining process is done. This method is the best in which the industry looking to improve good surface finish of product that produced. The value of Surface roughness parameter is measured with using a portable Mitutoyo SJ-301 see figure 3.3. The detectors can be retracted back into the drive unit and it has high
accuracy widely can be measuring until 300μm. The measurement of average
roughness (Ra) is the area between the roughness profiles obtain from machining and it means a line or a significant elevation in the absolute value of the roughness profile over the length. Measurement value is displayed on a digital touch panel, and the output result can be print out from the built-in printer. Surface roughness is measured from the vertical displacement of stylus with driving direction on the detector flat surface. The result is displayed digitally or graphics on the touch panel.
Figure 3.3: MITUTOYO SJ-301
CHAPTER 4
RESULT AND DISCUSSION
4.1 INTRODUCTION
This chapter is explain the result obtained from the experiment, the machining process perform using PVD end mill cutting tool with D2 tool steel of work piece material. The result presented and discussed is followed the statistics and scientific method. The problem and the findings discussed were the ability of machining process using D2 tool steel to build a mathematical model using statistical analysis for the cutting parameters and the quality of the surface roughness. Then was followed by determining the optimum machining process to meet all the response simultaneously and proved by model validation. The performance of cutting parameter can be assessed by examining the causes of surface roughness and failure mechanism of cutting tool that occur. The Surface integrity of the machined work piece is examined in detail. The study consists of contributions; equation to predict the cutting parameters resulting in the phenomenon of inconsistency in the effects of surface roughness grinding end mill cutting tool.
In this experiment, the objective was to find a combination of cutting parameter namely cutting speed, feed rate and width of cut that will give the low of surface roughness and at the same time, others factors taken into account where the economic productivity of machining are analyzed in terms of the costs involved in the machining and then compared with other researchers.
4.2 THE SURFACE ROUGHNESS
Table 4.1 shows the results of the surface roughness during machining process of D2 tool steel using the flooded cooling system for the 17 experiments. Through a range of parameters that have been set, the range surface roughness result obtained of the results obtained is from 0.2129-0.71 µm. the ability of the machining tool show a combination of milling parameters are competitive for machining D2 tool steel. Generally the value of surface roughness obtained in machining process is usually between 0.8-6.3 µm (Kalpakjian & Schmid 2003). This proves that the High Speed Machining technique capable to producing the best surface finish in machining process.
Table 4.1: Surface roughness for machining D2 tool steel
13 150 0.15 8 0.2244
14 150 0.15 2 0.3150
15 125 0.15 5 0.2129
16 125 0.15 5 0.4888
17 100 0.2 5 0.5617
4.3 Analysis Variance of Surface Roughness Using RSM
Table 4.2 shows the analysis of surface roughness with using RSM method. The factors that affect the parameters when the P-value less than 0.05 using (95% confidence interval). ANOVA shows the parameters that influence the output. From the table 4.2 also, the linear model was found significant with P-value 0.0018 and the F-value is 13.17297. The factors are cutting speed followed by feed rate is found significant and are arranged based on the largest F-value. This factor caused when the P-value is below 0.05. The parameter that influences the surface roughness was cutting speed, is because this parameter is the most dominant when compared with the feed rate. The cutting speed model has the most high F-value of 26.11974compared to the feed rate and the width of cut.
Table 4.2: ANOVA for experiment
Source Sum of
squares
df Mean square F-value P-value prob > F
Model 0.107183 3 0.035728 13.17297 0.0018 significant
The model B referred width of the cut parameter is not separated from the ANOVA even if it not significant. The width of the cut parameter is not significant in influencing the surface roughness during machining is done. Separation of insignificant factor does not affect the calculation and the mathematical model because of the different average error of 3.8% compared with 3.3% if not saperated unsignificant factor. This is proved by small changes R square values 0.8316 and the adjusted R-square 0.7685 compared R-squared 0.8133 and adjusted R-squared 0.7718 after separation.
4.4 Development of a Mathematical Model of Surface Roughness
The estimation of surface roughness with takes all the components of the interaction that influencing the result. The mathematical model for surface roughness is obtained through the linear equation, see equation 4.1.
Ra = 0.758328 – (0.0045 x Vc) + (1.600156 x fz) – (0.00706 x ae) Equation 4.1
The differences error of surface roughness is by looking at the difference between the result of mathematical model compared with the experimental data in the table 4.3. The average error obtained was 9 %.
Table 4.3: Surface Roughness value
150 0.2 5 0.36 0.36736236 2%
125 0.15 5 0.481667 0.399970585 17%
150 0.15 8 0.224444 0.2661743 19%
150 0.15 2 0.315 0.30853478 2%
125 0.15 5 0.48875 0.399970585 18%
100 0.2 5 0.561667 0.59259445 6%
4.5 Clarification Model for the Surface Roughness
Normal plot for residuals basically to look for patterns that indicate something other than noise is present (Anderson and Whitcomb, 2005). The error of Normal probability for surface roughness measurement in the experiment is shown in figure 4.1. The distribution of deviations is seem minimum where all measurements obtained from the experiment is closed to the straight line that indicating the line is a true value. The tendency plot point bend down to the left and pull the right side of the curve shows that the left and right ends of the distribution is smaller error than expected, that the actual error not as large as expected value (Montgomery 2009). Because the trends of the plot are basically has a small deviation from the model prediction.
Figure 4.1: Normal Plot Graph
The distribution of errors is in normal state after removing some data that has a high error in experiments. There are five data from the experiment has been ignored in this analysis because the data has an error will affected to the analysis that have will be made. Figure 4.2 shows the effect of the model on each experiment with using distance cook graph. From the figure 4.2 found that there are no defect in the calculation after five removing five experiments that have an error, where all the data distance is less than the probability 0.25 and with no isolated points is formed. Montgomery, peck, and Vining (2001) say that the way to interpret Cook’s distance is “the squared Euclidean distance…that the vector of fitted values moves when the ith observation is deleted”.
N
or
ma
l %
p
ro
ba
bility
Internally Studentized Residuals
Figure 4.2: Cook’s Distance graph
The mathematical models built from the ANOVA are made to calculate the range of error that exists during experiments. The error of surface roughness is calculated with compared the data experimental data obtained from the experiments with actual data get from the substitutions parameter value into mathematical model. Experimental data compared between measured and calculated are shown in Figure 4.4. The Comparative results have a small error range between the experimental and the model with an average value of 0.002 or 9% of error. It is competitive when compared with the previous research with an error of 8.3% by Shahrom et al. (2013). According to Hills and Trucano (1999), for the predicted uncertainty in the model parameters, the experimental error, and an additional acceptable error of ±10% of the model’s mean predictions. The error occur in this experiment is quite smaller when compared to the 15% error obtained by Brezocnik et al. (2004) using genetic programming techniques.
Run Number
C
ook D
is
ta
nc
e
Figure 4.3: Predicted versus Actual graph
Figure 4.4: comparison between the results of the surface roughness between the experimental and model, the average error of 9%
Experiment
Model
Actual
P
red
ict
ed