Human System Modeling for Optimum Labor
Utilization and Man-Machine Configuration
Rohana Abdullah
1, Md Nizam Abd Rahman
2, Siti Nurhaida Khalil
3 1Faculty of Engineering Technology, Universiti Teknikal Malaysia Melaka2Faculty of Manufacturing Engineering, Universiti Teknikal Malaysia, Melaka
3
Faculty of Mechanical Engineering, Universiti Teknikal Malaysia Melaka email: [email protected]
Abstract— Manufacturing organization with increased in the organizational complexity, is facing difficulty in measuring its performance. Various factors could affect manufacturing performance such as equipment performance, material planning and human resources. In this paper, focus was given primarily on the human resource which was considered as an important factor of the simulation model development to achieve optimum utilization and ensure efficient operator allocation to the machines. Static modeling was performed to capture all the critical factors contributing to the work such as the operator activity sequence, the time value for each activity and also the machine process time for each batch of product. A dynamic model was then developed to enable quantitative analysis in the optimization of human system performance. This paper illustrates the application of different modeling approaches to demonstrate advantages gained in the process of evaluating human system performance.
Index Term— Human System Modeling, Simulation Modeling, Man-machine Configuration
I. INTRODUCTION
The manufacturing operations have increased in complexity due to constant changes required to cater to unpredictable customer demands. Siemieniuch and Sinclair [1] stated that manufacturing is considered complex if various resources that interact with each other resulted in unpredictable organization performance. Global competitions are also putting pressures on the manufacturing companies to produce products cheaper and faster. Thus, manufacturing operations are urgently exploring methods to reduce the complexity and improve the efficiency in managing the resources.
Among the factor that is becoming critical to be considered in managing manufacturing complexity is the human resource. Human resources are required to fulfill orders such as in the areas of material processing, product assembly or component manufacturing [2]. Thus, the optimum utilization of the labor should be a serious consideration in order to minimize the operating cost in manufacturing [3].
This paper explores an alternative method to model human system in order to provide the manufacturing organization with an effective decision-support tool to efficiently manage human resource in the complex manufacturing environment. The two modeling approaches used in this study are:
–
work activities and observing the impact of a selected decision on the operator utilization and man-machine configuration.
Dynamic Modeling – enables experimentations of the critical parameters in a virtual environment such as to predict the human resource performances. Some of human resource performances that can be predicted using this method are optimum labor utilization and man-machine configuration.
This paper describes the possibilities to dynamically model specifically human and machine resources to predict the behavior of the manufacturing operation performance. This technique can potentially be used as a basis of a more accurate decision support tool to efficiently assist production managers in optimizing the man-machine configuration.
This paper begins with literature reviews to support the various studies done in the area of human system modeling and simulation modeling. Next, it will explain the development of the static model and also the use of dynamic model to mimic the actual production case of the back-end semiconductor manufacturing facility.
II. HUMAN SYSTEM MODELING
Manufacturing efficiency is highly dependent on how well resources such as equipment, human and material are being managed. Due to continuous rise in labor cost, effort has been focused on human system modeling in order to address the issues and support the manufacturing operations in the quest to achieve better competitive advantage.
Model such as CIMOSA can be used to analyze key aspects of human systems using enterprise (static) and simulation (dynamic) to deploy human systematically in manufacturing [4]. In modeling human system, static model via CIMOSA modeling technique is used first to model static human system model in manufacturing plant which is later used as reference to create dynamic model i.e. simulation model to quantify human performance and efficiency values and to observe the effect of these variables on the production performance i.e. the throughput and takt time [4].
information were dynamically modeled using simulation aimed to eliminate personnel bottlenecks by realigning their structure. Both CIMOSA and ESPE-IP combined static and dynamic modeling to evaluate the manufacturing operation. Simulation has grown in popularity due to the ability to analyze and optimize the production line in a digital environment without having to disturb the actual production process [5]. Consequently, simulation tool is perceived to provide an advantage to model alternative combinations of humans and machines for optimum resources configurations [6,7].
In both CIMOSA and ESPE-IP, the time values of the human‟s detail work activities are just based on estimation in the form of either efficiency percentage or qualification matrix. Thus, accurate utilization values of the workers are not able to be provided. Baines et.al. [8] explained due to failure in relating workers performance with the critical factors impacting them has caused processes to be poorly modeled. Therefore, this study aims to design a method to measure operators utilization based on the detail work activities and determine the optimum the man-machine configuration using simulation for the manufacturing operation.
III. M2M STATIC MODELING
Man-to-Machine (M2M) modeling refers to a static spreadsheet analysis to observe the result of detailed work study on the operator‟s activity on the overall operator‟s utilization and man-machine configuration. Using a case study of the back-end semiconductor process, a M2M template was
designed to capture the worker‟s activities. Next, Maynard
Operational Sequence Technique (MOST) predetermined time standard times were assigned to each work activities to achieve an accurate time values. The time measurement unit (TMU) value in MOST was then converted to the activity time in minutes for the semiconductor process under study. Other information including the frequency of the same work activity being repeated and also equipment information are also incorporated in the model. An algorithm to determine the M2M value was then developed and captured in the M2M column of the M2M template [9]. For example in Table 1, the bottom value in the M2M(1) column refers to the operator‟s utilization percentage if assigned with one machine or M2M ratio of 1:1. Similarly, the next column of M2M(2) shows the percentage utilization of the operators if assigned with two machines thus M2M ratio of 1:2.
Table I
Template for M2M Static Analysis
No. Start New Lot Activities Sequence TOTAL TMU Time (min)
25000 15 1.3146 19.72 631.03 3.1250% 3.133%
2 Housekeeping
8333 4.9998 1.3146 6.5729 631.03 1.042% 1.044%
3
Walk 34 steps to Ministore and get 2 carrier taped reels and walk back to machine . Twice per shift (2 reels/2 mch/1time)
A67 B0 G3 A67 B6
P1 A0 1440 0.864 1.3146 1.1358 631.03 0.180% 0.360%
4
Walk 5 steps to Insp table and place carrier tape under table and place next to it (Once per 2 shifts)
A67 B0 G3 A67 B0
P1 A0 1380 0.828 0.6573 0.5443 631.03 0.086% 0.173%
6
P1 A0 910 0.546 1.3146 0.7178 631.03 0.114% 0.228%
7
Bend and take out 25 reels from plastic 1 by 1 and arrange under Insp table
A67 B6 (G1 A1 B0
P3) A0 1980 1.188 1.3146 1.5618 631.03 0.248% 0.495%
8
Walk 34+5 steps to store to get a box of sealing tape and walk back to Insp table (Once per day)
A67 B0 G1 A67 B0
P1 A0 1360 0.816 0.4382 0.3576 631.03 0.057% 0.113%
9
Walk 9 steps to Pridelink station fr machine and click Lot Starting button
A16 B0 G1 M1 X0
I0 A0 180 0.108 1 0.108 631.03 0.017% 0.034%
10
Walk 55 steps to Schedulers room and get new lot (box)
fr room window A96 B0 G1 A96 B0
P1 A0 1940 1.164 1 1.164 631.03 0.184% 0.369%
TOTAL 84884.87 51.00 14.95% 25.74%
IV. M2M DYNAMIC MODELING
Discrete event system simulation was applied in the production process modeling using WITNESS simulation software package. Our simulation model consists of three parts: (A) the first part is the modeling of the production process to mimic the current condition before line balancing technique is applied in order to determine the optimum numbers of equipment required. (B) The second part of the simulation model realizes the aim of the study which is to determine the optimum man-machine configuration of the production line without jeopardizing the production line throughput and cycle time. (C) This final part includes the model experimentations to achieve the optimum operator utilization and also man-machine configuration.
A.Equipment Capacity Modeling and Line Balancing
Before the simulation model can be developed, a conceptual model needed to be designed. Figure 1 illustrates the inputs and outputs of the simulation model framework.
Fig. 1. M2M Simulation Model Framework
The critical part of simulation model development is the model verification and model validation. Verification is the process of making sure the simulation model behaves as planned. Verification process can start once the entire model is completely ready. On the other hand, validation is a process to ensure that there are no significant differences between the conceptual model and the real production line. In this study, verification was done by comparing the simulation output to the manual calculation of a given production scenario. Validation was carried out by comparing the simulation results with the actual system data.
Table II
Validation of Simulation Model
Process
Actual Production (units/shift)
Simulation Results (units/shift)
Delta (%)
Die Clip
Bond 958000 967740 1.02%
Mold 347000 357096 2.09%
Trim and
Form 1807000 1935480 7.11%
Test 189000 193548 2.41%
Based on the validation result in Table 2, the difference (delta) between simulation and actual production data is within the acceptance level of 10%. Therefore, the developed simulation model can be used for further studies to understand the system under consideration. The first part of the simulation analysis is to determine the production line bottleneck thus; the simulation model was run for one shift (480 minutes). The throughput (capacity) was observed for each process and then compared with the actual declared capacity per shift of all processes. From the simulation model runs, the bottleneck area was also identified based on the throughput results. Figure 2 shows that the bottleneck occurred at the test process
The validated model was used to simulate production scenario that balance the equipment capacity for each critical process. Masood [10] explained that assembly line balancing is used to determine optimum allocation of operations at the workstations so as to minimize the cycle time of the line for a given number of workstations, or to minimize the number of workstations for a given cycle time, by equalizing the loads on the workstations.
The graph on the right of Figure 2 shows the result of a more balanced production process by manipulating the equipment assignment and product load. This step is important in order to determine the optimum number of equipment required to meet the required customer demands before an optimum number of operators can be assigned to the equipment in the next part of the simulation modeling.
Fig. 2. Equipment Capacity before (above) and After Line Balancing (bottom)
B.Human Modeling and Optimizing the Resources
Fig. 3. Man-Machine Configuration Simulation Model
From Figure 3 simulation model, the percentage labour utilisation for 1 Man to 1 machine is found to be at 19.76%. This result was compared with the result computed using M-to-M technique using the M2M static modeling and was found to be the same. Therefore, we concluded that second part of the simulation model is validated and can be used for improvement studies.
C. Experimental Runs
This simulation run takes into consideration product A package of the back end semiconductor production line under study as an example. It aims to improve the current production run by re-adjusting the number of equipment available for processing product A. This is to ensure a balanced line and to reduce the Work in Process (WIP) buildup of the bottleneck operations. To achieve this, the die clip bond equipment is first reduced from 15 units to 7 units since running 15 units will cause overproduction of units. As for the mold equipment, there is only one mold equipment and as a result, there is no need for adjustment for this process. The Trim/Form is another process found overproducing products so the equipment is reduced from existing 4 units to only 1 unit.
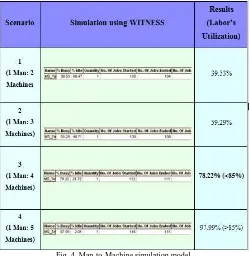
The second experimental run involves the computations of optimum M2M ratio. The Test area was selected and the summary of the model results is shown in Figure 4. The experiment results show that the optimum M2M ratio for the test operation is 1 operator to 4 machines with utilisation of 78.22%. Improving the operators‟ workload is a complicated task in real life industrial situation and in most cases is not done with the required accuracy since it is an issue which is hard to compute. Approach introduced in this study allows the user to overcome this problem. Analysis done using the M2M method indicates that there are plenty of opportunities to
improve the operators‟ current work load.
Fig. 4. Man-to-Machine simulation model
In addition to the labor utilization and M2M ratio information, this study also enables the authors to perform
lean waste analysis on the operator‟s work activities in order
to continuously improve the man-machine configuration for the manufacturing operation. The lean waste analysis information of the operator‟s current workload shown in Figure 5 provides the production line management with critical information on the area to focus in order to further improve the labour utilisation at this area. As it could be seen from Figure 5, the operator‟s efficiency can be further improved if the activity time at the reel change, start new lot and machine assist can be reduced.
V. SUMMARY AND CONCLUSION
In this study, the ultimate objectives of optimizing the operator utilization and the man-machine configuration through a balanced production line were achieved. Static M2M modeling complemented with dynamic simulation has proven to be an effective tool to perform production line evaluation and was successfully used in this study. Static M2M was useful in providing detail information on the
operator‟s work activities using inventive work study technique. Thus, the authors were able to acquire an accurate input to the simulation model and also perform lean waste analysis to identify opportunities for further efficiency improvements.
Simulation proved to be a faster alternative for experimental runs to gain information on improved operator utilisation and optimum man to machine ratio. With the production line equipment and labour simulation models, the
semiconductor company‟s management now has an effective
method to determine the best production line configuration to minimize the operation cost and at the same time meeting the customer expectations.
ACKNOWLEDGMENT
The researchers would like to thank the back-end semiconductor manufacturing for providing us with the facility, information and resource support throughout the study duration. This research is sponsored by the Ministry of Higher Education (MOHE) and Universiti Teknikal Malaysia Melaka (UTeM).
REFERENCES
[1] C.E., Siemieniuch and M.A. Sinclair. (2002).”On Complexity, Process Ownership and Organizational Learning in Manufacturing Organizations, From Ergonomics Perspective.”. Applied Ergonomics. Vol 33(5). pp 449-462
[2] R.H. Weston, A. Rahimifard, et.al. (2009). „On Modeling Reusable Components of Change Capable Manufacturing Systems.”Institute of Mechanical Engineer. pp 331-336 [3] Omar, M.K, Abdullah, R and Abd. Rahman, M.N (2012).
Process and Labour Utilization in The Electronic Industry: A Simulation Approach. In: 6th IEEE International Conference on Management of Innovation and Technology, 10-14 Jun 2012, Sanur, Bali, Indonesia. pp 694-698
[4] S.N. Khalil, J.O Ajaefobi, R.H. Weston (2011). “Human Systems Modeling in Support of Enterprise Engineering”. International Journal of Manufacturing Research. Vol 6(2). pp 134-159.
[5] G. Zulch and M. Becker (2010). ”A Simulation-Supported Approach for Man-Machine Configuration in Manufacturing. International Journal of Production Economics. Vol 125(1), pp 41-51.
[6] B. Chen, T. Yang, et.al., (2010). “Research on Simulation-based Performance Analysis of Aero-engine Casing Production Line‟. IEEE Industrial Engineering and Engineering Management Conference. pp 799-803.
[7] S.N. Khalil, R.H. Weston (2010). “Modeling Human Resource Systems Modeling in Support of Efficient Production”. Balanced Automation Systems. pp 72-29
[8] T. Baines, S. Mason, et.al. (2004). “Humans: The Missing Link in Simulation”. Simulation Modeling Practice and Theory. Vol 12. pp 515-526
[9] Rahman, M.N., R. Abdullah, (2012). “Work Study Techniques Evaluation at Back-end Semiconductor Manufacturing‟. International Conference on Design and Concurrent Engineering. Pp 313-318
[10]Masood, S. (2006). “Line Balancing and Simulation of an Automated Production Transfer Line.”Assembly Automation vol 26, no 1, pp. 69-74
Rohana Abdullah graduated in Bachelor of Industrial Engineering from State University of New York in 1993. She worked for 12 years with Motorola Semiconductor (M) Sdn Bhd and ON Semiconductor (M) Sdn Bhd. holding several positions starting from Process Engineer. She was the pioneer Industrial Engineer for the company and over the years had progressed to lead the Industrial Engineering department for the company focusing in capacity planning, facility layout, manpower optimization and scheduling. She joined Universiti Teknikal Malaysia Melaka (UTeM) in 2007 as the Teaching Engineer to share her skills and knowledge with the future aspiring engineers and also to pursue her Master Degree. She obtained M.Sc in Manufacturing Engineering in 2009. She is still actively involved in various consultation projects with the industries. Her specializations include capacity characterization, manpower study, lean manufacturing, simulation and space planning. She‟s currently pursuing her PhD in human systems modeling.