1. Algoritma Genetika
N、。セ@
Aplikasinya untuk
BISOIS
d。 ョ ャョ、オセ@
•
2.Aplikasi
Algoritm
a Geneflka
Mutti-obyektif untuk
Agroindustri
By Yandra Arkem
an
セM
dセー。イィョ・ョエ
of Agrolndustrial Technology - FAIDA - IPB
Deparhnent of Computer Seence - FMIPA - IPB
I
TIME TABLE OF INTERNATIONAL WORKSHOP ON COMPUTATIONAL INTELIGENCE AND SUPERCOMPUTING TECHNOLOGY FOR ADAPTIVE AGROINDUSTRIAL SYSTEM
On Thursday - Friday, October 4-5, 2012
Venue: Auditorium Abdul Muis Nasution, FATETA IPBI Kampus IPB Dramaga,
)1.
DramagalTIME ACTIVITES
NO.
Thursday, October 4th 2012
1. 08.00 - 08.30 Registration
2. 08.30 - 09.00 Opening Ceremony
Session 1: Moderator Prof Dr. Ir. Marimin, M.Sc
3. 09.00 - 09.20
I
09.20 -10.50 I
10.50 11.20
I
I 11.20 -12.00 12.00-13.00
ADAPTIVE AGROINDUSTRY AND SMART-TIN: Conception and Roadmap
0/
ResearchDr. Ir. Yandra Arkeman, M.Eng (lPB, Indonesia)
EVOlUTIONARY COMPUTING AND PARALEUSM : Conception, Recent and • Future Trend
Prof Kenneth A De Jong (GMU, USA)
APPLICATION OF GEOGRAPHIC INFORMATION SYSTEM • AND I
SUPERCOMPUTING IN ADAPTIVE AGROINDUSTRY
Prof Dr. Ir. Kudang Boro Seminar, MSc. (lPBI Indonesia)
Discussion
Relax, Lunch and Praying
Session 2 : Moderator: Prof Dr. Ir. Kudang Boro Seminar, M.Sc. I
13.00 -13.30
I
..
13.30 -14.00 14.00 14.3014.30- 15.00
15.00- 15.45
APPLICATION OF FUZZY LOGIC AND PARALELISM IN ADAPTIVE I
AGROINDUSTRY
Prof Dr. Ir. Marimin, M.5c (IPB, IIIdu,,,::::>H))
HIGH PERFORMANCE COMPUTING: Theory and Application in Industry
Prof Dr. Ir, Heru Suhartanto (UI, Indonesia)
FUTURE PARADIGM FOR PARALLEl COMPUTING: Quantum Information
Dr. Gajendran Kandasamy (UK)
PREFERENCE COMPUTATION: Skyline Query, Data Mining and Knowledge Discovery
Dr. Taufik Djatna, S. TP, M.Si. (lPB, Indonesia)
• Discussion
15.45-15.50 • Closing workshop 1st day Friday, October 5th 2012
Session 3: Moderator: Dr.lr. Yandra Arkeman, M.Eng
08.00 - 08.30 • APPLICATION OF ARTIFICIAL NEURO NETWORK (ANN) AND PARRALELISM COMPUTING FOR CLIMATE CHANGE PREDICTION
I Dr. Ir. Agus Buwono, M.Sc (lPB, Indonesia)
08.30-09.00
09.00 - 09.45 09.45 -10.00 I
PARALLEl MULTI OBJECTIVE GENETIC ALGORITHM FOR NATURAL MEDICINE PLANT IDENTIFICATION
Dr. Ir. Yeni Herdiyeni MSc.{lPB, Indonesia) Discussion
Concluding Remark and Closing Ceremony
FIRST INTERNATIONAL WORKSHOP IN COMPUTATION INTELLIGENCE AND SUPERCOMPUTING FOR ADAPTIVE AGRO-INDUSTRY 1
Preference Computation: Skyline Query, Data
Mining and Knowledge Discovery
Taufik Djatna
Invited Paper
Abstract—We introduce a novel approach for a solution to skyline query problems that are usually detected in any online and direct marketing. A preference computation is proposed to handle a complexity of high-dimensional case of knowledge discovery that contain in the online transaction. Our reviving algorithm evidently succeeded to identify preferable objects with the lowest additional cost in the query. A concise real world example is provided to support the computational example while emphasizing the importance of knowledge discovery process in the solution. We extend the capability of a skyline query to solve the market positioning evaluation of the dominated points of products. This capability can assist both manufacturer and customer to plan product features according to their approximate distances to the preference points. For this purpose we develop a distance measurement on a convex skyline approach. First, we present data sets contain record of multidimensional product, where every dimension represents one attribute of product feature. Then we evaluate the skyline query of a data set and divide the data set into a collection of preferable objects in skyline and another are the dominated points. Here we assume that each dominated point is potentially entering the preferable region by moving their attribute values into customer preference’s points. We provide the query to find potential products to enter the skyline with a lower additional distance (as cost). This approach compute minimum additional cost to revive the dominated points based on a user’s elicitation of a maximum threshold. Results of our comprehensive experiments show the effectiveness of this approach both in real world and synthetic data sets.
Index Terms—skyline query, preferable objects
I. INTRODUCTION
P
REference computation is a computational solution about inducing predictive preference models from em-pirical data. In the literature on choice and decision theory, two main approaches to modeling preferences can be found, namely in terms of utility functions and in terms of preference relations. From a machine learning point of view, these two approaches give rise to two kinds of learning problems: learning utility functions and learning preference relations. The latter deviates more strongly than the former from conventional problems such as classification and regression, as it involves the prediction of complex structures, such as rankings or partial order relations, rather than single values. The focus of this paper in the development and application of skyline query in an online market analysis systems to provide electronics auction participants and members with an easy-to-use and effective managerial decision support tools.Taufik Djatna is with the Department of Agro-Industrial Technology, Bogor Agricultiral University, Bogor, Indonesia, e-mail: [email protected].
Managers seek to gain competitive advantage by conducting market analyses and by refining their forecasts of market potential. An effective and practical approach for doing this is to rely on strong database connected to dynamic web access with CRM (Customer Relationship Management). This approach can be extended to integrate very different sources of data held by diverse players in market, doing so in a dynamic and timely way. Skyline query has emerged as an interesting novel technology in database community partic-ularly for Customer and Supplier Relationship Management (C/SRM). Recent researches show skyline application for user preferences. In the database area, the problem of enhancing well-known query languages with preference features has been tackled in several recent and important works in the area. In (Chomicki, 2003), a simple logical framework is proposed for expressing preferences. Preferences are expressed by preference formulae. These formulae are incorporated into relational algebra and into SQL, through the operator winnow parameterized by a preference formula. (KieSSling, 2002) introduced Preference SQL which extends SQL by a preference model based on strict partial orders. Several built-in base preference constructors are proposed. The optimizer uses an efficient rewriting procedure which transforms preference queries into standard SQL queries.
The concept of dominance of skyline has also recently attracted researcher’s interest in context to answering prefer-ences queries. Regarding of this, we find that skyline queries are potential tools for C/SRM to recognize important role of future preference of product features, like durability, high capacity, lighter weight, smarter response and cheaper price, such as common in electronic products. We investigate that in conventional skyline concept, this capability is a hidden capacity, in which skyline itself is a decision boundary that resulted from both customer and manufacturer or supplier to their own preferences. This boundary separate clearly, which points of product are really in customer and manufacturer preference and, in other side, are the dominated points of product or services. Normally dominated products exert to enter this boundary as the consequent of market mechanism of supply and demand of the product features. Potential product, in microeconomics, might be a new preferable one in the market if the manufacturer can recognize how to fulfill the customer preference in the future. Additional resource (cost and patches) should be allocated to increase preference of the points of object (products). The challenge is how to allocate the scarce resource to different dimensions using the skyline query results. This motivation is the basic customer
FIRST INTERNATIONAL WORKSHOP IN COMPUTATION INTELLIGENCE AND SUPERCOMPUTING FOR ADAPTIVE AGRO-INDUSTRY 2
relationship management motive to win competition in the market.
Customer also can take benefit if additional cost to any product which partially satisfies her preference for purchasing is already available. When a manufacturer wants to increase the sale by patching their product dimension into preferable ones, such as higher capacity or lower price, additional costs will incur. This change might move the product into the preference region of a skyline. This additional cost can be either direct or indirect, according to which dimension value is considered. One important paradigm in computation area dealing this issue is the application of skyline query, which enable us to evaluate characteristic of multi-dimensional value in hyper plane. For this purpose, we construct an enabling approach for companies to evaluate their point of product position in certain threshold and adjust their marketing strategy to dominate other product for eventually win the customer preferences.
Each manufacturer would strive to maximize their mar-ket share with higher number of customers to acquire their products. To gain this, each manufacturer would allocate resources to find a better positioning in the market, which means manufacturers exert to dominate as many customers as possible within the constraint that called as the multi dimensional attribute value in hyper plane. We propose a method to elaborate the requirement of dominated points a multi dimensional hyper plane to move into preferable region in the skyline. In order to find our goal to utilize skyline result for improvement market positioning, we study following questions (1) How to evaluate the most prospective product in the dominated region for entering a new positioning in skyline, (2) What is the basic formulation to minimize the cost of entering preferable region, (3) What is the boundary for an efficient evaluation among dominated point of the skyline query. These questions are important to support the revival of dominated point of products in a data set.
In this work, we arbitrarily compute additional costs incur to move dominated points bounds to a maximum threshold value in a skyline query. Our approach iteratively examines the initial skyline points and computes the prospective product point in each pair of dimensional plane. We prioritize the lowest cost dimension base on that threshold. Our contributions are as follows:
• Providing an effective formulation for reviving position of prospective points of product to enter the skyline
• Elaborate the user elicitation preference for prospective product using a maximum threshold of additional cost.
Our results show that the lowest prospective products are easily recognized using the elicitation of customer in skyline query. This finding is previously missing in skyline and k-dominance query works. In the following section 2 discusses the preliminaries for our work, then Section 3 provides the proposed method about revival query in skyline to improve to dominate points in skyline. Section 4 provides related works that support this work. Section 5 gives the experimental setup and results, then follow discussion of the improvement and performance finding. We sum up our work in section 6 with conclusions.
II. PRELIMINARYWORKS
A. Consumer Choice Theory
The preference approach we propose is widely applicable, but consumer choice theory is a natural starting point since the theory is computationally hard and a basic building block for most of economics. Further, the preference approach in economics was first proposed and developed for consumer choice theory. We introduce some notation that will be used throughout the remainder of the paper. For integern, we let [n] := {1,2, .., n}.LetZ+,R+ denote the nonnegative
integers and real numbers, respectively, and letZ++ andR++
and denote the set of positive integers and real numbers, respectively. For a binary relation R, we let R∗
denote its transitive closure. A binary relation R isacyclic ifxR∗y
and
yR∗x
implies thatx=y. We denote ad−dimensionalvector with all coordinates equal to c by cand denote the ith
basis vector, which is one at coordinateiand zero at the otherd−1
coordinates.
We wish to consider the case of a single consumer and
d different goods. However, to model a variable number of goods, we instead consider the case in which there are (count-ably) infinitely many different goods, of which the consumer only has the opportunity to purchase up to d different types of goods, which we relabel as goods 1,2, ..., d. Formally, a
d−dimensionalconsumption bundle is a vectorx∈Rd+,
wherexi indicates the amount of goodi consumed, andχd is
the consumption space consisting of all valid d-dimensional consumption bundles. We define the full consumption space asχ:=∪d≥0χd.
We consider two settings for the consumption space: (i) infinitely divisible goods and (ii) indivisible goods. In the case of infinitely divisible goods, each of the goods is available in perfectly divisible quantities, and so χd = Rd
+. In the case
of indivisible goods, the goods can not be divided, and thus
χd = Zd
+.. In either case, we denote by the natural partial
order onχd.: sox≤y iffx
i≤yifor each coordinatei∈[d].
The d goods generate a lattice (χd,≤
).
An instance of the consumer choice problem is specified by a price vectorp ∈ Rd+. for some d and a consumer
incomeb ∈ Rd+. Let B(p, b) := {x : x ∈ χdim(p), p.x ≤ b}
denote the budget set under prices p and budget b, where dim(p) is the dimension of p. The standard economic theory of the consumer then postulates that the consumer behaves (i.e. chooses x) as if he has autility function u:χRand
solves the problem max{u(x) : x ∈ B(p, b)} to determine what consumption bundle to select when faced with prices p and budget b. To incorporate computational considerations, we make the distinction between tractable and intractable utility functions, using the standard demarcation of polynomial-time computability. If there exist utility functions that explain the data, then there exists a tractable utility function that explains the data. In other words, the constraint that the consumer’s utility function is tractable does not alter the range of consumer behavior that may be explained by the theory. Echenique, et.al (2011) proposed the following definition:
Definition 1. Tractable Utility function. A utility functionu:
FIRST INTERNATIONAL WORKSHOP IN COMPUTATION INTELLIGENCE AND SUPERCOMPUTING FOR ADAPTIVE AGRO-INDUSTRY 3
all p and b in polynomial time , by which we mean polynomial in d=dim(p), maxi(logpi), and logb. Otherwise, u is said
to be intractable.
B. CRM
CRM describes software solution that help organizations manage relationship with their customers (e.g., a database containing detailed customer information that management and salespeople can access to match customer needs with the products and inform customers of service requirements). CRM is not only an information system; it is also a business strategy that gives rise to conceptual, organizational and operational changes within organization. Underlying CRM is the belief that an organization’s most valuable asset is the customer and the organization must manage its customer relationships wisely. Having various departments (e.g., marketing, sales and service) gather qualified information creates a database that is of real value to the organization. Establishing defined processes for data retrieval allows for effective use of the data and provides a uniform platform for managing relations with customers. When successfully implemented, CRM maximizes business potential within the existing customer base, opti-mizes ongoing service levels, capitalizes on sales opportunities throughout the service process, and broadens relationships with customers/consumers.
C. Data Mining
Currently data mining techniques assume as a wide range of tools to facilitategoal definition, data selection, data prepa-ration and transformation, data exploprepa-ration, and pattern dis-covery and pattern usage (Han & Kimberly, 2011). Berry & Linoff (2004) suggested that data mining methods to provide a new generation of analysis techniques and procedures for market analysis, prediction and the identification of practically usefull patterns of information. A driving force behind data mining has been the extraordinary growth in the quality, quantity, and complexity of geospatial data. The ready avail-ability of such data, on a scale unthinkable a couple of decades ago, poses new challenges for the geospatial and marketing research community. Although conventional market analysis and spatial statistics methods retain their power and popularity in numerous studies, innovative data-mining tech-niques and approaches are appearing in response to the newly available geospatial data (such as cellular automata, agent-based modeling, and qualitative and fuzzy reasoning). These techniques are efficient and effective in discovering hidden structures, patterns, and associations within geospatial data (Arentze & Timmermans, 2006). At the same time, emerging visualization and interaction technologies provide powerful tools for obtaining additional insights from geospatial data. There is increasing convergence of analytical reasoning and visualization toward the creation and discovery of geospatial knowledge for real-world marketing applications (Florkowski & Sarmiento, 2005; Hanaoka & Clarke, 2007; Jank & Kannan, 2005, 2006). Although the technologies and methodologies are developing rapidly, what is already available has the capacity to assist in the process of business planning and
market research. Forward-looking businesses are already ap-plying approaches similar to those described. Unfortunately, however, current approaches tend to be very disjointed, often requiring the manual movement of data between various software applications. This limits the use of these technologies to those who have advanced skills in database management and programming, data analysis, and predictive modeling. There is a need, therefore, for tools that will integrate the necessary technologies, enabling marketers/mangers to focus on the business opportunities instead of the technical barriers to implementation.
III. SKYLINEQUERY
Skyline query has been attracting very large database com-munities since the emmerging of Pareto database optimization. Skyline is a set of objects which are not dominated by another object in the data set, which divides object of data set O =o1, o2, .., on into Skyline set S =s1, s2, .., sm, and
dominated pointsP =p1, p2, .., pl, withm+l=n. Skyline is
a boundary line that separate preference search region (PSR) and non-preference region (NPR) as we illustrate in Figure 1. We investigate the opportunity of a skyline query for the purpose of revealing knowledge discovery from inquiry of huge database transaction.
Definition 2. Dominance:Given o, o∈ O, o dominates o’ iff
∀ di∈D = d1, d2,. . ., , dk,o.di o.di djD, o.dj ≺o’.dj
.
Formally, using example in Figure 1 a skyline points setS=
s1, s2, s3dominates another object setp=p1, p2,. . ., p7in
2-dimensional space ifs1 is no worse that p1 with respect to
every attribute∀i:pi. That is, in this scenario, where smaller
attribute values are desirable, e.g. for attributes such as x and y,s1 dominatesp1, ifsi1≤pi2;∀i= 1, .., dand there exists j,
1≤j≤d. such thatpi1< pj2. All of which can be measured by
an integer number. In the microeconomic, according to Figure 1, we can view the dominant products, such as product s1 dominatesp6andp7in the market. In other word, p1 does not
have a market as long as s1 exists, if s1 no worse than p6 and p7 in all d-attributes. As a consequence, skyline products are view as preferable choices which outperform all the other products in at least one attribute dimension. The rest or non skyline products are assumed as non-preferable. We provide a method to revive each low cost non-skyline product p which is manufactured by improving p with minimization costC(p, p’). We call this query as a Revival query. This query computes minimum additional cost for a higher marketability for a non-skyline product p. We define the Revival Query as follows:
FIRST INTERNATIONAL WORKSHOP IN COMPUTATION INTELLIGENCE AND SUPERCOMPUTING FOR ADAPTIVE AGRO-INDUSTRY 4
Definition 3. (Revival Query) The revival query on a non preferable product p returns a preferable counterpartp =
argminpC(p, s), whereC(p, s) =
PD
i=1ci(si−pi),ciis the
additional cost for improving a unit of i-th attribute dimension d.
With the resource scarcity for manufacturing a point of product, it is very important to consider the profit constraint hyper plane hi as the non preferable region to produce the product with highest quality just to attract customers.
Definition 4. Maximum threshold: the maximum thresholdΓ
is user defined values that limit upper bounds of additional costs occur when move dominated points of object into preferable region in skyline query.
[image:6.612.32.300.28.780.2]It is possible for any product point in the dominated region to offer their new product features that will change the current market position into the preferable region. This process is in a hyper plane of all attribute dimensions that is consid-ered applied on a product. This hyper plane hi divides the multidimensional space into two regions, a preferable region which is profitable and a non -profitable one. We provide Figure 1 to illustrate these regions, and how any product point can change position into preferable region. With the problem formally defined, it is important to know for a non skyline product the way to find the cost optimal to enter the profitable and preferable region. In short we need to formulate the new positioning for a non skyline product so that it transforms into the dominance region. For this purpose, we provide a visual to depict the problem and initial step to solve it in the Figure 1.
A. Convex Skyline using Hand-Probing Approach
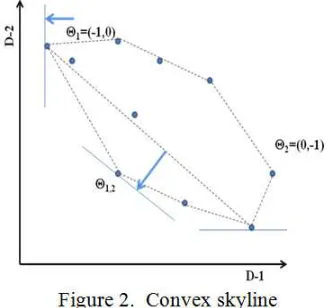
Definition 5. Convex Skyline: A convex skyline is a set of point si ∈ S that lies on the lower side of the convex hull
[image:6.612.326.489.381.535.2]of S. The convex hull of S is the minimum k-dimensional polyhedron that contains all of S. Note that a convex skyline must be a skyline since the point is not dominated by any other point in O.
Figure 2 shows this construction. Each record in S can be represented as a k-dimensional pointx= (x1, x2,. . ., xk)
where coordinate value of the point are values of k attributes of the record. Therefore, the database S is a set of |S| points in the k-dimensional space. Points on the convex hull of the set of |S| points can be computed efficiently by, so called, the hand-probing function. This hand-probing function finds the tangent point of the convex hull of the set of |S| points and a hyperplane whose normal vector isΘ. Figure 2 is an example how to compute convex skyline. Assume there is a line whose normal vector isΘ1= (−1,0) in the two-dimensional space.
In order to find the tangent point with the line and the convex hull without pre-computing all points in S, we compute inner products of the normal vector and each atomic points (Θ1, a).
Note that once we specify a normal vector, we can find the tangent point with convex hull, which is a skyline S, inO(n)
by the hand-probing function.
Definition 6. Convex Hull Search First of all, we compute initial k tangent points that can be computed by hand-probing with initial k vectorsΘ= (θ1, θ2,. . ., θk) whereθi = -1 ifi=
x,otherwiseθi= 0for eachx= 1,. . ., k. After computing the
initial k tangent points, we have the initial facet (k-dimensional hyperplane). Next, we compute the normal vector of the facet. The new tangent point divides the initial facet into two facets. We recursively compute tangent point for each facet until there is no new point outside every facets.
We can apply this recursive operation for higher k-dimensional space as we performed in [3]. In the k- di-mensional case, new tangent point, which is found by the hand-probing, divides the initial facet into k facets. In higher dimensional case, the normal vector of facet can be computed as follows: 3D case: Assume we have three points P1 =
(p11, p12;p13), P2 = (p21, p22, p23), P3 = (p31, p32, p33). If
we imagine three points from three edges in the plane then we can take two of the edges and calculate cross product between them. Suppose the edges vectors areV1 = (v11, v12, v13) =
(p21;p22, p23)−(p11, p12, p13) and V2 = (v21, v22, v23) =
(p31, p32, p33)−(p11, p12, p13). Then the normal is defined as
FIRST INTERNATIONAL WORKSHOP IN COMPUTATION INTELLIGENCE AND SUPERCOMPUTING FOR ADAPTIVE AGRO-INDUSTRY 5
Where e1, e2 ande3 are the elementary vectors
(1,0,0),(0,1,0) and(0,0,1)respectively.
kD case: The same concept can be expand for k-dimensional case. Assume we have P1 =
(p11, p12,. . ., p1k), P2 = (p21, p22,. . ., p2k),. . ., Pk =
(pk1, pk2, .., pkk). Now, we can calculate (k -1) vectors like
V1, V2,. . ., V(k−1). Then, the normal can be defined as the
expansion of the following determinant:
IV. REVIVALSKYLINEQUERY
In order to combine data mining capability for a knowledge discovery operation in a skyline query, there are three possible approaches that enable solution for the problem of reviving dominated skyline points. The first one is to model the problem into a mixed integer programming (MIP). In the MIP ap-proach, first, we have to set the target function, where we want to find the minimized additional cost for moving the dominated points into the preferable region. These costs might occur for moving the attribute value of a product from less preferred into the preferable one. Then we have to examine which attributes will result the most effective changes for moving. In this case, we have to set up the status of each dimension into binary. The solution is easy for lower dimension such as two attributes. But it will risk for curse dimensionality problem in higher dimension, which make it impossible to solve using only MIP approach. It is also hard to maintain the dynamic changing of data set which results on very possible combination of customer elicitation. These combinations are consisted of different dimension patterns. The second possible approach is to model a numerical analysis using curve fitting such as b-spline or higher polynomial computation to cover all dimensions. This approach is risky for higher computational cost. Implicit surface modeling is also another approach in numerical analysis with the same higher computational risk to model in a higher dimensional surface. Our proposed method utilizes the idea of separation between two parties of skyline in one side and dominated points in other side. This idea is also considered in previous methods such as b-spline and polynomial as the input for searching the minimum distance. In this case, the main idea is to allocate skyline points set (S) in different space from the dominated points (P). We then treat each skyline point as pivot to measure the nearest distance of the dominated points in two ranges, upper and lower rectangular. The upper rectangular is defined as the maximum value of the dimension value. A pair of maximum value of two dimensions will make an upper rectangular. Lower rectangular is constructed from the intersection of two upper rectangular. While most of dominated points are scanned using the upper rectangular, lower rectangular measure the regions that are left from the intersection. Figure 3 gives detail of these two rectangular.
Modeling reviving dominated points in skyline query We begin by studying the properties of convex skyline query S
and the rest point’s result which are lied in dominated region P. We evaluate the characteristic of multi-dimensional value in hyper plane. The constraint of hyper plane should satisfy the following conditions:
Intersection testable in which a constraint hyperplane hi and a rectangle with two diagonal corners—lower and upper corners, at(l[1], ..., l[d]) and (u[1], ..., u[d]) are testified for their intersection in a constant time, and where
Intersection extensiblein which the intersection between a constraint hyperplanehi and (pi[1], pi[2],. . ., pi[d]) are
exten-sible with another(p’i[1], .., p’i[k+ 1],. . ., p’i[d])exactly on
hi in constant time.
We assume that each pi ∈ P is referred to a normal
dynamic market, where maximum profit is the motive to enlarge the volume of customer preference. We propose a heuristic approach for practical solution in the problem of dominated points in skyline query. Using the convex skyline algorithm, we remove skyline set from initial data set and separate from dominated points virtually. First, we construct the upper and lower boundaries for each dimension attribute value to catch the range of numerical information within each dimension. The complexity of this computation give
×(|S||P|), where,|S|+|P|=Nis the cardinality of the data set. Assume that the dominated region from a skyline query is composed of L objects p1, p2, .., pl. Given a query object
pk which may be contained in the Revival query asks for the Skyline set S where si 6=pk which is closer to si than any
other object in the database. A more general form of revival query is to ask for the nearest objects instead of just the closest one to pk. Therefore, the revival query asks for the
dominated objects that are less to the range of threshold Γ. The output of a revival query is a list of objects sorted in increasing distance order from the query object. As illustrated in Figure 3, we set each skyline point (si) that retrieved using
convex skyline algorithm as the pivot point. This pivot point will be the base point for scanning each dominated point pi in its range of max(di), max(dj), where di, dj ∈ D. The
Manhattan Distance (L1) is deployed with boundary to the
threshold valueΓthat elicited by user. This measure computes additional cost (ACi) for moving each object, formulated
as follows:ACi = ΣDi=1|si −pi| where D is number
sub-dimension, which is chosen by user’s elicitation query. si is the pivot of skyline point and pi is the dominated points. The distance counts (ACi) from each pivot is stored in a memory
buffer Bi. Eventually the list of Bi ≤Γ is the object points
FIRST INTERNATIONAL WORKSHOP IN COMPUTATION INTELLIGENCE AND SUPERCOMPUTING FOR ADAPTIVE AGRO-INDUSTRY 6
V. COMPUTATIONALEVALUATION
Our experimental tools consisted of a dual-Xeon quad-processor 2.33 GHz machine with 8 GB of RAM running MySQL 5.1 RDBMS engine and MS-Windows server 2008. We develop a Java based prototype to test the method using both synthetic (correlated, anti-correlated and independent) and real world numeric data from CRM cases. The test bed includes two type data sets: (1) Real life data set of 5400 records of CoIL2000 dataset from UCI (2001) and e-shopping from kakaku.com that sells electronics appliance in Japan online. (2) Synthetic data sets, consists of three forms, correlated data set, anti-correlated and independent. Each synthetic data set is generated in groups of 1K, 10K, 50K and 100K cardinalities.
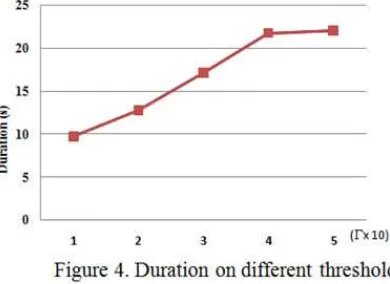
[image:8.612.326.521.56.198.2]We discuss the performance evaluation of the proposed method. We proceed to revive the dominated points of object. Using our approach to compute minimum additional cost incurred in moving the dominated points, we compute the number of object moving into the preferable region in skyline and the time required. For these purposes, we find the result as follows. According to Figure 4, we first examine the running time of the proposed program compare to numbers of most economical points to move. Then we compute number of points of object that are retrieved using our method. We then evaluate our method using synthetic data set. Based on these results, we analyze the performance. 1) Real-life data set: We evaluate the effectiveness of our approach on different threshold value using real data set from UCI (2001) called CoIL2000. We set the thresholdΓ, in five forms {10, 20, 30, 40, 50}. It is worth noticing that our method can handle to k-dimensional cases. For simplicity we provide a case in 3 and 5 dimensions.
Figure 4 shows the duration required to compute data item, divide the data set into skyline set and dominated set and calculate the distance as the minimum additional cost. Notice that the duration in second increases, as the threshold value rises. It reflects the revival query works on filtering the increasing number of objects selected from the skyline. These incremental numbers of object are not only derived from convex skyline algorithm we deploy, but also from the outer scanning of revival query upon objects between two skyline points. Further, next in Figure 5 provides the number of point of object retrieve using our approach in 3 dimensions. We also find the number of points of object increase linearly with the number of threshold.
FIRST INTERNATIONAL WORKSHOP IN COMPUTATION INTELLIGENCE AND SUPERCOMPUTING FOR ADAPTIVE AGRO-INDUSTRY 7
3) Anti - Correlated data distribution: Here, more data points are not dominated, if we compare with previous correlated data set. Higher numbers of pivot points help us to identify more prospective products for moving into preferable region. Figure 7 provides the duration required for anti-correlated synthetic data set results.
4) Independent data distribution: For this data distribution, m out of n data points is skyline points, the expected value of m is highly dependent on the data dimensionality (d). Based on this, given n=100KB, if d=3, m will around 2000 objects (2%) revived. In a lower dimensionality, few data points are skyline objects and only small numbers of nodes are examined. Figure 8 provides the duration required for independent synthetic data set results.
From Figure 7 and 8, we observed that the time spent on both synthetic anti-correlated and independent datasets tend to be polynomial with the expansion of the data set cardinalities. Note that in this synthetic data set evaluation, our duration measurement unit is in millisecond (ms). From mentioned figures, we can conclude the effectiveness of this approach to compute the minimum additional cost to revive the dominated point in the skyline query.
VI. CONCLUSIONS
In case of seeking knowldge in high dimensional data transaction, we proposed a preference computation method to revive the dominated points of objects. This work was motivated by the opportunity to the utilization of the skyline query to support utility function of consumer choice such as competing product feature by manufacturers, suppliers and customers. Our method is based on convex hull skyline method, with target to minimize additional cost incurred for moving the dominated product to be preferable ones in the
market. Using both real-life and synthetic data sets, we show that our method effectively evaluate the prospective objects (as products) to be preferred with a certain maximum threshold value. The applicability of this approach will enhance cus-tomer preference on a certain product with high dimensional features to be choosen by customer. For a future work, a high performance computing may improve the computational cost efficiently.
REFERENCES
1) M.J.A. Berry, and G.S.Linoff . Data Mining Techniques: For Marketing, Sales, and Customer Relationship Man-agement, 2nd ed., Wiley, New York, 2004.
2) Chomicki, J. (2003). Preference formulas in relational queries. ACM Transactions on Database Systems, pp. 427–466, 2003.
3) KieSSling, W. (2002). Foundations of preferences in database systems. Proceedings of 28th International Conference on Very Large Data Bases, Hong Kong, China, pp. 311–322, 2002.
4) F.Echenique, D.Golovin & A.Wierman. A Revealed Preference Approach to Computational Complexity in Economics. Proceedings of EC’11, June 5–9, 2011, San Jose, California, USA. 2011
5) J.Fürnkranz & E. Hüllermeier (eds). Preference Learning Springer-Verlag Berlin Heidelberg. 2010.
6) C. Li, A. Tung, W. Jin, and M. Ester, “On dominating your neighborhood profitably,” in Proceedings VLDB 07 Vienna Austria, 2007.
7) T. Fukuda, Y. Morimoto, S. Morishita, and T. Tokuyama, “Constructing efficient decision trees by using optimized association rules,” in Proc. of the 22nd VLDB Confer-ence, 1996, pp. 146–155.
8) J. Kleinberg, C. Papadimitriou, and P. Raghavan, “A microeconomic view of data mining,” Data Mining and Knowledge Discovery, vol. 2, no. 4, pp. 311–322, 1998. 9) J. Kleinberg, C. Papadimitriou, and P. Raghavan,
“Seg-mentation problem,” in Proceedings STOC, 1998. 10) R. Wong, J. Pei, A. Fu, and K. Wang, “Online
sky-line analysis with dynamic preferences on nominal at-tributes,” IEEE Transactions on, pp. 1–1, 2003. 11) C. Li, B. C. Ooi, A. Tung, and W. Shan, “Dada: A data
cube for dominant relationship analysis,” in Proceedings SIGMOD 06, ser. ACM SIGMOD, 2006.
12) M. Preparata, F.P. Shamos, Computational Geometry, an Introduction Springer-Verlag, 1985.
FIRST INTERNATIONAL WORKSHOP IN COMPUTATION INTELLIGENCE AND SUPERCOMPUTING FOR ADAPTIVE AGRO-INDUSTRY 8
1
Preference
Computation
:
Skyline Query, Data Mining and
Knowledge Discovery
Outline
Overview of KDD
Preference Computation
Motivating Example
Skyline Query: Progress and Application
Preference Revival Skyline Query
Example in e-Auction
Computational Evaluation
Conclusion
Overview of Knowledge Discovery in Database
(KDD)
__
__
__
__
__
__
__
__
__
Transformed
Data
Patterns
and
Rules
Target
Data
Raw Data
Interpretation
& Evaluation
Integration
Un
d
e
rs
ta
n
d
ing
Data
Warehouse
Knowledge
Pre-processed
Data
Knowledge
Preference Computation
“
a computational solution about
inducing predictive preference
models from empirical
data” ::
Approaches for solution:
Utility functions
Preference relations
Pareto Optimization
High computational Requirement
Motivating Example on Preference
Computation
e-Bay
: Administrator vs Auction Competatitors
Lazada
: wishlist vs direct marketing (promo)
5
Atribute-1 Atribute-2 Atribute-... Atribute- Atribute-n
Advan 2-core 4GB 16570000 Motorolla 4-core 16Gb 3400000
Samsung 4-core ... ... ...
N-costumers
Wishlist
N-record
objects
Supply Chain
and Customer
Relationship
Requirements
Preference
Computation
SKYLINE QUERY OVERVIEW
Skyline is a decision boundary in
high dimensional
numerical/categorical data sets
Utilize the separation to
dominated points in
Object
Preferences
& Operates on
object level
Attributes are highly correlated
On a Very large database and
High Transactional Data Rate
Two region in a Skyline Query
where
min
is
preferred
7
Conventional and Convex Skyline
“An object
X
dominates
object
Y
if
(
X.
d
1
> Y.
d
1
and X.
d
2
≥
Y.
d
2
) or
(
X.
d
1
≥
Y.
d
1
and X.
d
2
> Y.
d
2
)”
SKYLINE QUERY OVERVIEW (cont.)
::
Each a convex skyline point is
a
conventional skyline
Areas of Skyline Query Applications
Web based Recommendation Systems
Product/Service Attributes Design
Manufacturing Process Optimization
Network Security
Evaluate Personnel performance
Online e-auction management
...
9
A Survey of Skyline Query Research (2001-2012)
Skyline Query
Generic
Index Based
SubSpace
High-Dimensional
Distributed and
P2P
Other
Environments
Business
Oriented
Devide & Conquer
Sort Filter Skyline Block Nested
Loop
Index
Branch and Bound Skyline
Bitmap
Subsky
K-most Representative
Skyline
Top-k Freq. Skyline
Skypeer
Peer Data management
System
Distributed Skyline
Data stream monitoring
Skyline Cardinality estimator
Partially ordered domain
Dominance Relationship
Linear Elimination Sort
for Skyline
Nearest Neighbor
Sort and Limit Skyline
Skyline search space partition
Spatial-Spatio temporal
10
Proposed Convex Skyline Query
Skyline Query is:
A boundary line that separate preference search
region (
PSR
) and non-preference region (
NPR
)
Potential objects within any
threshold
, compute
Additional Cost (
AC
):
D= number of dimension in
query to
elaborate
1
|
|
i
D
i
s
i
i
AC
p
p
Revival Query
p
S
=arg Min
p
PSR
AC
i
(p
i
, p
Si
)
150120 100 90 80 70 60 50 40 30
2 4 6 8 10 15 20 25 35
d
2d
1
p4p9 s3
s5 s2
p3
p13 p6 s1
p8
{max(d-1), max(d-2)}
p1
p5
s6 s4
PSR
NPR
11
Proposed Convex Skyline Query
(cont.)
Compute initial
k tangent
points that can be
computed by
touching oracle with initial
k
vectors
= (
1
,
2
,….,
k
) where
i
= -1 if i = x, otherwise
i
= 0
for each x = 1,…, k.
Compute the initial
k tangent
points, we have the initial facet
(k-dimensional
hyper plane).
Compute the normal vector of
the facet
2 Dimensional Case
Preference Revival Query in Skyline
P
i
(x
i
,y
i
)
S
(x
s
, y
s
)
Skyline
points
Skyline surface
Skyline
S
(x
s
, y
s
,z
s
)
P
i
(x
i
,y
i,,
z
i
)
Searching for preferable region with lowest cost
in 2D and 3D
The Skyline hyper plane should satisfy the following conditions:
13
Preference Revival Accuracy
|T
rev
| = the number of revived objects to move
into current skyline, under
certain level of
threshold
, by using historical dataset.
14
150 120 100 90 80 70 60 50 40 30
2 4 6 8 10 15 20 25 35
Wei
ght
(W)
(G
r)
Price (P)(Y 000)
Apple
Hitachi GreenHouse
Kenwood Toshiba
A-Data
Creative SandDisk T-sonic
Cowon
Siren
{max(P), max(W)}
Victor
Sony
IO-Data
Example:
Preference Reviving skyline
Case in tablet-PC
15
Applying preference revival query
150 120 100 90 80 70 60 50 40 30
2 4 6 8 10 15 20 25 35
Wei
ght
(W)
(G
r)
Price (P)(Y 000)
Apple
Hitachi GreenHouse
Sony Kenwood
Toshiba
A-Data
Creative SandDisk T-sonic
IO-Data
Cowon
Siren
{max(P), max(W)}
Victor
16
Example
details result
17
Computational Evaluation
Duration on
different threshold
values
Number of objects
in different thresholds
Using Real Coil2000 data set (UCI2007)
Compare to modified Adaptive Sort Filter Skyline (SFS) (Chomicki et al., 2003 and
Wong et al. 2009)
0 100 200 300 400 500 600 700 800 900 1000
1 2 3 4 5
Ob
jec
t re
trie
v
ed
Threshold (x 10)
SFS
ConvexSL
0 10 20 30 40 50 60
1 2 3 4 5
D
u
rati
on
(
s)
Threshold (x 10)
18
Experimental Evaluation (cont.)
Duration on correlated data set
Duration on anti-correlated data set
Duration on independent data set
0 0,5 1 1,5 2 2,5 3 3,5 4 4,5 5
1 10 50 100
Du ra ti on (s )
Cardinality (K)
SFS
ConvexSL
0 10 20 30 40 50 60 70 801 10 50 100
D u rati on (s)
Cardinality (K)
SFS ConvexSL 0 10 20 30 40 50 60 70 80 90 1001 10 50 100
20
Concluding Remarks in Skyline Query
Providing a preference
reviving query for
dominated objects
to enter the skyline
Elaborate the user elicitation preference
on a
maxi
mum threshold
Future Challenges
A
probability model
to measure the
characteristics of dimensional changes
A game theory integration for
the customer
dimension values
.
21