ENERGY AND PROTEIN BALANCE OF NILE
TILAPIA FED WITH MORINGA AND MULBERRY
LEAVES
Dewi Apri Astuti1*, Klaus Becker2, Nahid Richter2
1)Department of Nutrition and Feed Technology Faculty of Animal Science, Bogor Agricultural University 2)Institute for Aquaculture-systems and Animal Nutrition in the Tropic and Subtropic,
Hohenheim University, Fruwirthstraβe 12, 70593 Stuttgart, Germany
Diterima 17 Juni 2011/Disetujui 10 Oktober 2011
Abstract
he study was to evaluate energy and protein balance of diet that contain extracted moringa and mulberry leaf, as each 30% protein replacement for ish meal in nile tilapia diets. hree diets were control, prepared with ishmeal (C), diet 1 contained methanol extracted moringa (D-1) and diet 2 contained mulberry leaf (D-2). Fiteen nile tilapia were randomly kept in a 5 L capacity individual respiration chamber in which the oxygen consumption of each ish could be measured continuously. Prior to the experiment ish were measured standard metabolic rate (SMR), routine metabolic rate (RMR) and scope for spontaneous activity (SSA). Parameter measured were body weight, energy intake (GEI), energy expenditure (EE), energy metabolism (ME), energy retention (ER) and protein utilization. he data were subjected to analysis of variance and were continued using Duncan’s Test. he results showed the average values of SMR, RMR and SSA were 49, 67 and 105 mg.kg-0.8.h-1, respectively. GEI for the control group was lower than the other groups, while inal body weight in group D-1 was the highest. he ER (g) for group D-2 was the highest while value of Protein Eiciency Ratio and Protein Production Value in group D-1 were the highest. It was concluded that methanol extract of moringa are quite palatable and could replace 30% of protein ish meal in diets for nile tilapia.
Key words: moringa, mulberry, standard metabolic rate, routine metabolic rate, scope for spontaneous activity
INTRODUCTION
Fish ration should have high protein content. Source of feed protein usually comes from animal such as ish meal and waste of ishery industries. he price of animal protein like ish meal is quite expensive and the ingredient has competitive problem with human food. Plant protein like legume leaves can be used for covering protein requirement of herbivore ish, but in tropical legumes they contain high secondary compounds, which have side efects to the user. he other alternative forage which also contain high protein are Moringa oleifera and mulberry (Morus sp.) leaves.
M. oleifera is a tree which grows throughout in most of the tropic area and has
several industrial and medicinal uses. hey are not legumes and also not a gramineae, some people call it “he Miracle Tree”. hey have multifunction such as human food, water puriication, medicinal products and animal and ish feed (Foidl et al. 2001). In Indonesia, in such area like Bali, Madura, North Sumatra and South Sulawesi island, people eat those leaves and especially for lactating mother. While in India, Nicaragua and Niger there are a lot of M. oleifera plantation and uses for multi purposes. Afuang et al. (2003) reported that methanol-extracted residues and methanol extracts of moringa leaf meal had no signiicant efect on the growth performance compared with control diet in nile tilapia and so far it was concluded that those diets reduced the plasma and muscle cholesterol. he nutritional and energy content of extracted and unextracted moringa leaves
JPHPI 2012, Volume 15 Nomor 1 Energy and protein balance of nile tilapia, Astuti, DA. et al.
Masyarakat Pengolahan Hasil Perikanan Indonesia 72
moringa stock, sample was extracted with 90% methanol using a Soxhlet apparatus for 48 h. he extract’s were separated from the residues through iltered using a ilter paper and the residues were freeze-dried soon ater air-drying and all material above stored at freezer until analysis and feed formulation. Prior to feed formulation, the proximate composition and amino acid analysis of methanol extracted moringa and morus leaves were determined (Table 1), while wheat meal and ish meal were analyzed by previous researcher (Richter et al.
2003).
Materials
hree diets, were designated as control diet(C), diet 1 (D-1) and diet 2 (D-2), were used in this experiment. he control diet was prepared with ish meal as the primary source of protein by mixing with various ingredients as shown in Table 2. Diet 1 and diet 2 were designated to replace 30% of ishmeal-derived dietary protein in diet using methanol extracted residues of moringa leaf and raw mulberry leaf meal respectively. Proximate and amino acid composition, of experimental diets and amino acid requirements of nile tilapia is shown in Table 3.
A group of nile tilapia (11-24 g) ingerlings were used. here were two batches of experiment where experiment 1 as for evaluation of energy balance using respiratory boxes while experiment 2 as for evaluation of digestibility of diets containing methanol extract of moringa and raw mulberry leaf meal. At the beginning of the experiment, three ish of the same population were killed and frozen for the determination of initial body composition and the rest of ish were fed at level of maintenance requirement according to body weight.
Experimental environment
Experiment 1: In Respiration chamber Fiteen nile tilapia were randomly kept in the 5 L capacity individual respiration boxes in which the oxygen consumption of each are 43.50 and 25.10; 1.40 and 5.40 ; 47.40 and
21.90; 16.30 and 14.10%; 17.70 and 18.70 MJ/ kg for CP, CL, NDF, ADF and GE , respectively (Gupta et al. 1989). Makkar and Becker (1996) reported that anti nutritional components of whole and extracted moringa leaves which is important information for animal feed are glucosinolates, saponin, total phenols, tannins and cyanogenic glycosides of moringa plant.
here are a lot of Mulberry species. Ekastuti et al. (1996) reported the nutrient content of ive kinds of mulberry leaves such as Morus cathayana, Morus nigra, Morus canva, Morus multicaulis and Morus alba
from Indonesia in diferent cutting stage had 15.71%-22.59% of CP, 3.70%-615% of CL, 8%-16.8% of CF and 3.5-4.6 Kal/kg GE. hose leaves also contained vitamin A, where
M. cathayana posessed the highest (5671 and 5736 mg%, in young and old leaves respectively). he proximate analysis of sun-dried mulberry leaves were 20% and 22% of digestibility and energy balance of nile tilapia. herefore, the present study was carried out to evaluate the energy balance and protein utilization of diet containing extracted moringa and mulbery leaf meal as 30% protein replacement for ish meal in diets for nile tilapia.
MATERIALS AND METHODS Location and diet formulation
his study was done at Laboratory of Aquaculture, Department of Aquaculture System and Animal Nutrition, Institute for Animal Production in the Tropics and Subtropics, Hohenheim University, Germany.
M. oleifera and mulberry leaves were obtained from Indonesia with treated oven-dried 40 oC
VO2 resulting from spontaneous activity, the highest VO2 values recorded in the irst 48 hours of experiment is the spontaneous activity (SSA) (Becker and Fishelson 1986). Experiment 2: In Aquaria
Another iteen nile tilapia ingerlings (11-22 g) were kept in the 40-L of individual aquaria for acclimatization. he aquaria were integrated into a re-circulatory system at 26.6 oC. hey were divided into three groups
of 5 ishes each randomly and fed at around maintenance level (3 g/kg 0.8/day) with three
kinds of diet containing approximately 35% protein, 7% lipid, 11% ash and a gross energy content of 19 kJ/g dry matter. Ater adaptation three ishes of the same average body weight ish could be measured continously (Focken
et al. 1997). he boxes were illuminated 12 h on and of and water temperature was kept at 28.2 oC. During acclimatization (3 days)
in the experimental set up, the ish received maintenance level of feed. In the prior of experiment ishes were fasted for two days according to measure standard metabolic rate. he standard rate of O2 consumption (SMR) was determined when the ish had grown used to the respiration box approximately ater 24 h, then the VO2 values collected at the start of the experiments were tested for SMR which was attained when low metabolic rates had been measured constantly over 60 min. Routine VO2 (RMR) is the O2 consumption of a fasting ish over 24 hours including the
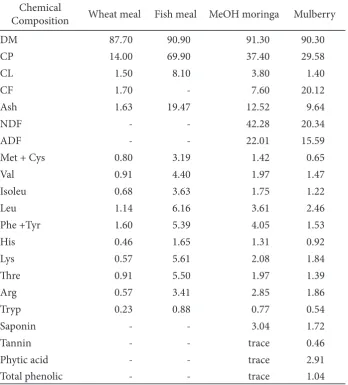
Table 1 Chemical composition and anti-nutrient content of ingredients (% DM) Chemical
Composition Wheat meal Fish meal MeOH moringa Mulberry
DM 87.70 90.90 91.30 90.30
CP 14.00 69.90 37.40 29.58
CL 1.50 8.10 3.80 1.40
CF 1.70 - 7.60 20.12
Ash 1.63 19.47 12.52 9.64
NDF - - 42.28 20.34
ADF - - 22.01 15.59
Met + Cys 0.80 3.19 1.42 0.65
Val 0.91 4.40 1.97 1.47
Isoleu 0.68 3.63 1.75 1.22
Leu 1.14 6.16 3.61 2.46
Phe +Tyr 1.60 5.39 4.05 1.53
His 0.46 1.65 1.31 0.92
Lys 0.57 5.61 2.08 1.84
hre 0.91 5.50 1.97 1.39
Arg 0.57 3.41 2.85 1.86
Tryp 0.23 0.88 0.77 0.54
Saponin - - 3.04 1.72
Tannin - - trace 0.46
Phytic acid - - trace 2.91
JPHPI 2012, Volume 15 Nomor 1 Energy and protein balance of nile tilapia, Astuti, DA. et al.
Masyarakat Pengolahan Hasil Perikanan Indonesia 74
were killed and analyzed for initial body composition. During the experimental period, the ishes were fed at 10 g feed per metabolic body weight (kg0.8) per day in four equal
installments using an automatic feeder. Fishes were weighed individually every week. At the end of the eighth week of the experiment, ishes were weighed, sacriiced and analyzed for
whole body composition. Prior to the chemical analysis, both the initial and experimental groups of ish were autoclaved at 120 oC for 30
min, homogenized, refrozen and freeze dried. he proximate analysis of diet ingredients, diet and whole bodies of ishes (CP, CL, and ash) were based on the standard (AOAC 1995). Dry matter was measured by drying to Table 2 Formulation of experimental diet (%DM)
Ingredients Control MeOH moringa Mulberry
Wheat meal 45 31 25
Fish meal 41 29 29
Me-OH moringa 0 28 0
Morus 0 0 37
Mineral mix 2 2 2
Vitamin mix 2 2 2
Sunlower oil 4 4 4
Alpha cellulose 5 3 0
TiO2 1 1 1
Total 100 100 100
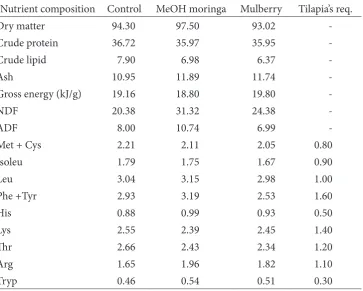
Table 3 Proximate and amino acid composition, of experimental diets and amino acid requirements of nile tilapia (% DM)
Nutrient composition Control MeOH moringa Mulberry Tilapia’s req.
Dry matter 94.30 97.50 93.02
-Crude protein 36.72 35.97 35.95
-Crude lipid 7.90 6.98 6.37
-Ash 10.95 11.89 11.74
-Gross energy (kJ/g) 19.16 18.80 19.80
-NDF 20.38 31.32 24.38
-ADF 8.00 10.74 6.99
-Met + Cys 2.21 2.11 2.05 0.80
Isoleu 1.79 1.75 1.67 0.90
Leu 3.04 3.15 2.98 1.00
Phe +Tyr 2.93 3.19 2.53 1.60
His 0.88 0.99 0.93 0.50
Lys 2.55 2.39 2.45 1.40
hr 2.66 2.43 2.34 1.20
Arg 1.65 1.96 1.82 1.10
a constant weight at 105 oC and gross energy
by bomb calorimetry (IKA C 7000) with benzoic acid standard. Fiber constituents such as neutral detergent (NDF) and acid detergent (ADF) ibers of methanol extract of moringa and raw morus leaves were determined according to the procedure described by Van Soest. An automated amino acid analyzer was used to determine the amino acid composition of feed ingredient. he total phenolics and tannins were determined by the spectrophotometric methods described by Makkar and Becker (1996). Phytic acid estimation was carried out by the modiied photometric procedure (Vaintraub and Lapteva 1988) and the total saponin content was determined by spectrophotometer. Calculation and statistical analysis
All calculations were performed for each ish individually. Growth performance was assessed in terms of the Body Weigh Gain (BWG) which calculated by subtracting inal and initial body weight, Feed Conversion Ratio (FCR) was calculated as live weight gain/feed consumption (dry matter), and Metabolic Growth Rate (MGR) as live weight gain (g)/average metabolic live weight (kg0.8)/day. he Average Metabolic Rate was
calculated as mg oxygen consumed kg0.8/h on
a weekly basis. he Standard Metabolic Rate (SMR) was taken as the lowest metabolic rate sustained for 2 h by the undisturbed ish that had been fasted for the preceding 24 h (Ultsch
et al. 1980). his calculation was done using the oxygen consumption values recorded on the day during the ishes were starved before experimental feeding started. Oxygen uptake (g) x 14.85 (kJ/g) gave the energy expenditure (EE) during the whole experiment (Huisman 1976) and the energy apparently metabolized (ME) were calculated by subtracting energy retention and energy expenditure of carcass (ER) from the gross energy of the feed consumed. Diet nutrient utilization was analyzed in terms of Feed Intake (FI), Protein Production Value (PPV, %) was calculated
as protein gain x 100/feed protein. Protein Eiciency Ratio (PER) was calculated as live weight gain (g)/protein fed (g). he data was subjected to analysis of variance (ANOVA) and statistical comparisons between the feeding groups were made using the Duncan’s Multiple Range Test (Statistical for Windows, release 5.1 H, 97 edition). he signiicance of observed diferences were tested at p< 0.05. he values that were in the text are Mean ± Standard Deviation.
RESULTS
Respiration chamber experiment
Metabolic rates of the experimental ish is shown in Table 4. he measurement of basal metabolism was done during fasting condition in a such group before the experimental was started. he data of nile tilapia’s SMR was same with reported before which was around 44.4 mg/kg0.8/d (Becker and Fishelson 1990). for body tissue synthesis. he RMR and SSA values in this experiment were also similar with reported before. Tilapia zillii has RMR and SSA around 64.4 mg/kg0.8/d and 111.2
mg/kg0.8/d, respectively.
Aquaria experiment
he chemical composition of the experimental ish was analyzed before and ater experiment (Table 5). here was signiicant diference in crude lipid of control and Table 4 Metabolic rates of the experimental ish
Control MeOH
JPHPI 2012, Volume 15 Nomor 1 Energy and protein balance of nile tilapia, Astuti, DA. et al.
Masyarakat Pengolahan Hasil Perikanan Indonesia 76
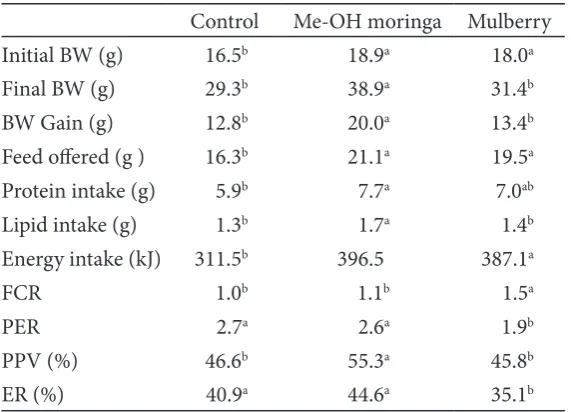
treatments where were ishes fed with moringa and mullberry had low lipid (p<0.05). Total energy of body in D-2 was signiicantly lower than other treatments (p<0.05). he calculated average values of nutrient utilization, FCR and biological value of diet are presented in Table 6. he BW gain value in D-1 was signiicantly higher than those of the control and D-2. his is because of high the initial BW and nutrient intake in that treatment. Palatability of the ration in D-1 was good for tilapia. As the consequences utilization of nutrient in D-1 was better than D-2, but not signiicantly diferent with control. he highest FCR value was done in D-2 (p<0.05).
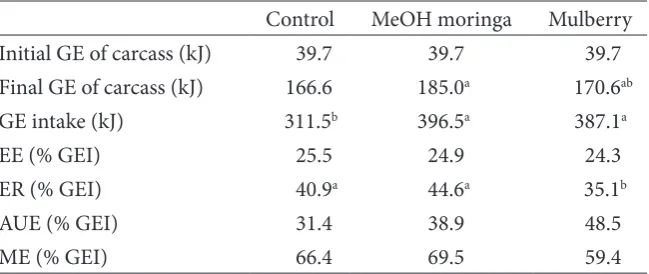
he complete energy budget of the ish in the diferent experimental groups was evaluated. here were diferences in the GE intake and energy retention (% GE) among the treatments. In control treatment was
showed eiciency in energy utilization with low energy intake but high percent of energy retention, while in the D-2 treatment was in opposite where high energy intake produced low energy retention. he best energy utilization was happened in D-1 treatment.
DISCUSSION
All the experimental ish consumed the feed provided completely and there were no mortality of ish during the experiment. Diet containing moringa and mulberry leaves were palatable for ish. Energy budget in tilapia fed with extracted moringa and mullbery have same heat production which around 25%, while the energy retained in mulberry group was lower than another treatments. Protein eiciency ratio (PER) in D2 showed the worst. Mulberry leaves which still contained secondary compounds (saponin, phytic and Table 5 Initial and inal chemical composition of the experimental ish
Initial Control MeOH moringa Mulberry
DM (% of fresh) 20.24 27.99 28.42 25.62
CA (% DM) 10.71 16.34 16.25 17.52
CP (% of DM) 66.05 56.66 57.26 58.29
CL (% of DM) 12.38 22.79a 19.97b 18.21b
GE (kJ g-1) 15.57 21.17a 21.06a 19.95b
Table 6 Growth performance and nutrient utilization of the experiment ish
Control Me-OH moringa Mulberry
Initial BW (g) 16.5b 18.9a 18.0a
Final BW (g) 29.3b 38.9a 31.4b
BW Gain (g) 12.8b 20.0a 13.4b
Feed ofered (g ) 16.3b 21.1a 19.5a
Protein intake (g) 5.9b 7.7a 7.0ab
Lipid intake (g) 1.3b 1.7a 1.4b
Energy intake (kJ) 311.5b 396.5a 387.1a
FCR 1.0b 1.1b 1.5a
PER 2.7a 2.6a 1.9b
PPV (%) 46.6b 55.3a 45.8b
tannin) were afected to the performance. he value of PER in diet control and D1 were same with reported before (Francis et al. 2002), while the value of PPV (45-55%) was higher in this experiment compared to ish fed with quillaja saponin which had PPV around 32-36% (Francis et al. 2002). he physiological efect of saponin on ish has been controversial, some authors reporting positive and others negative inluences. Roy et al. (1990) reported that saponin depressed blood parameters such as hematocrit, haemoglobin and red blood cell in several species of ish. On the other hand Francis et al. (2002) reported that supplementation of quillaja saponin in diet carp resulted high oxygen consumption and indicating higher metabolic activity.
here is usually an increase in body fat and energy content with increasing body size in ish fed maximum rations (Cui et al. 1996). In present study, body size had signiicant efects on the content of fat and energy of nile tilapia. his is because of all rations has good palatability and quality. he ration was prepared as requirement for nile tilapia. Even though diet with mulberry leaves was not as eicient as other treatment. heoretically the proportions of food energy in growing animals would be allocated to various organ target in the body and resulted by the size. Xie
et al. (1997) reported that in mature sexual ish resulted in reduced growth rate caused by the decrease in relative food intake.
Utilization of fresh moringa in ish diet was reported by Richter et al. (2003) with very
bad performance of the nile tilapia. here is no information about morus on diet ish. In this experiment showed that morus leaves without extraction resulted good performance in nile tilapia although was not same as moringa methanol extract.
CONCLUSION
Moringa extract and mulberry leaf meal could substitute 30% of ish meal in tilapia diet. Energy budget of tilapia fed with extract of moringa showed same pattern compare to control, while morus treatment was diferent. he energy expenditure and energy retention were around 25% and 40%, respectively.
ACKNOWLEDGEMENT
I would like to thank to DAAD scholarship, Germany for funding this research and Departement of Animal Nutrition and Aquaculture, Institute for Animal Production in the Tropics and Subtropics, University of Hohenheim for facilitating on Fish Bioenergetic Laboratorium.
REFFERENCES
Afuang W, Siddhuraju P, Becker K. 2003. Comparative nutritional evaluation of raw, methanol extracted residues and methanol extracts of moringa (Moringa oleifera Lam.) leaves on growth performance and feed utilization in nile tilapia (Oreochromis niloticus L.).
Aquaculture Research 34:1147-115. [AOAC] Association of Oicial Analytical Table 7 Energy budget of ish in diferent experimental group
Control MeOH moringa Mulberry
Initial GE of carcass (kJ) 39.7 39.7 39.7
Final GE of carcass (kJ) 166.6 185.0a 170.6ab
GE intake (kJ) 311.5b 396.5a 387.1a
EE (% GEI) 25.5 24.9 24.3
ER (% GEI) 40.9a 44.6a 35.1b
AUE (% GEI) 31.4 38.9 48.5
JPHPI 2012, Volume 15 Nomor 1 Energy and protein balance of nile tilapia, Astuti, DA. et al.
Masyarakat Pengolahan Hasil Perikanan Indonesia 78
Chemists. 1995. Oicial Methods of Analysis. 16th Ed. Washington DC:
Association of Oicial Analytical Chemists
Becker K, Fishelson L. 1986. Standard and routine metabolic rate, critical oxygen tention and spontaneous scope for activity of tilapias. he irst Asian Fisheries Forum. Asian Fisheries Society, Manila, Philipines.
Cui Y, Hung SSO, Zhu, Xie, 1996. Efect of ration and body size on the energy budget of juvenile white sturgeon. Journal of Fish Biology 49:863-876.
Ekastuti DR, Astuti DA, Widjajakusuma R, Sastradipradja D. 1996. Rearing silkworm (Bombyx Mori) with artiicial diets as an efort to promote the quantity and quality of national rawsilk production. Research Report, Research IPB, Bogor, Indonesia. June 1996.
Focken U, Becker K, Lawrence P. 1997. A note on the efects of l-carnitine on the energy metabolism of individually reared carp,
Cyprinus carpio L. Aquaculture Nutrition
3:261-264. metabolism, egg production and muscle cholesterol in individually reared nile tilapia (Oreochromis niloticus L.).
Comparative Biochemistry and Physiology
part C 129:105-114 .
Francis G, Makkar HPS, Becker K. 2002. Efects of cyclic and regular feeding of a quillaja saponin supplemented diet on growth and metabolism of common carp (Cyprinus carpio L.). Fish Physiology and Biochemistry 24: 343-350.
Francis G, Makkar HPS, Becker K. 2002. Dietary supplementation with quillaja
saponin mixture improves growth
performance and metabolic eiciency in common carp (Cyprinus carpio L.).
Aquaculture 203:31-320.
Gupta K, Barat GK, Wagle DS, Chawla HKL. 1989. Nutrient contents and antinutritional factors in conventional and non conventional leafy vegetables.
Food Chemistry 31:105-116.
Huisman EA. 1976. Food conversion
eiciencies at maintenance and
production levels for carp, Cyprinus carpio L. and rainbow trout, Salmo gairdneri Richardson. Aquaculture
9(2):259-273.
Makkar HPS, Becker K. 1996. Nutritional value and antinutritional components of whole and ethanol extracted Moringa oleifera leaves. Animal Feed Science and Technology 63:211-228.
Richter N, Siddhuraju P, Becker K. 2003. Evaluation of nutritional quality of moringa (Moringa oleifera Lam) leaves Digestibility studies. Livestock Reseach for Rural Development 15 (1): 325-330. Roy PK, Munshi JD, Dutta HM. 1990. Efect of
saponin extracts on morpho-history and respiratory physiology of an air breathing ish. Journal of Freshwater Biology 2:135-145.
Ultsch GR, Of ME, Heisler N. 1980. Standard metabolic rate, critical oxygen tention and aerobic scope for spontaneous activity of trout (Salmo gairdneri) and carp (Cyprinus carpio) in acidiied water.
Comparative Biochemistry Physiology 67 (A):329-335.
Xie S, Cui Y, Yang Y, Liu J. 1997. Energy budget of nile tilapia (Oreochromis niloticus) in relation to ration size.
Aquaculture 154:57-68.
Xie S, Cui Y, Yang Y, Liu J. 1997. he efect of body size on growth and energy budget of Nile tilapia, (Oreochromis niloticus).