*
Departement of Nutrition, Faculty of Medicine, University of Indonesia, Jakarta, Indonesia
M R Maureksa Hospital, Jakarta, Indonesia Departement of Biochemistry, Faculty of Medicine,
University of Indonesia, Jakarta, Indonesia
The effects of balanced low calorie diet on body composition and serum
leptin of obese women
M. Arifin Suyardi*, Win Johanes, Indriati Pramodo Harahap
Abstrak
Pengaruh pemberian diet rendah kalori seimbang selama 14 hari terhadap berat badan (BB), indeks massa tubuh (IMT), tebal lipatan kulit total (TLK), massa lemak tubuh (ML), massa tubuh bebas lemak(MBL), rasio lingkar pinggang-lingkar panggul (RLpi-Lpa), dan kadar leptin serum, telah dievaluasi dengan studi eksperimental pra dan pasca pemberian diet rendah kalori seimbang 915,23 kkal dengan komposisi 55,81% karbohidrat, 19,46% protein dan 24,73% lemak selama 14 hari terhadap 39 subyek perempuan obes (19-55 tahun) yang telah memenuhi criteria penerimaan dan penolakan. Data yang dikumpulkan meliputi data karakteristik demografi, data asupan energi dan makronutrien, antropometri, komposisi tubuh, dan kadar leptin serum. Terjadi penurunan berat badan secara bermakna (p<0,05) dari 70,99 ± 8,62 menjadi 68,81 ± 8,36 kg (3,07%); penurunan IMT secara bermakna (p<0,05) dari 30,28 ± 3,11 kg/m2 menjadi 29,36 ± 2,94 kg/m2 (3,04%); penurunan TLK secara bermakna (p<0,05) dari 99,36 ± 12,07 mm menjadi 91,29 ± 10,85 mm (8,08%); penurunan ML secara bermakna (p<0,05) dari 35,41 ± 2,75 % menjadi 33,65 ± 2,73 % (1,76%); peningkatan MBL secara bermakna (p<0,05) dari 64,59 ± 2,74 menjadi 66,35 ± 2,73 (2,72%); penurunan Lpi secara bermakna (p<0,05) dari 85,87 ± 7,31 menjadi 83,35 ± 7,09 (2,93%); penurunan Lpa secara bermakna (p<0,05) dari 107,59 ± 6,67 menjadi 106,49 ± 6,37 (1,02%); penurunan Lpi-Lpa secara bermakna (p<0,05) dari 0,80 ± 0,05 menjadi 0,78 ± 0,04 (2,24%); penurunan kadar leptin secara bermakna (p<0,05) dari 23,31 (12,06-71,22) menjadi 18,18 (7,90-65,11) (22,01%); ditemukan korelasi positif antara kadar leptin serum dengan ML secara bermakna (p<0,05) sebelum perlakuan (r=0,47 ; p=0,003) dan sesudah perlakuan (r=0,57 ; p=0,001). Pemberian diet rendah kalori seimbang sebesar 915,23 kkal/h selama 14 hari dapat dengan efektif menurunkan berat badan, IMT, tebal lemak bawah kulit, persentase lemak, meningkatkan persentase massa bebas lemak, menurunkan rasio lingkar pinggang, lingkar panggul dan kadar leptin serum. (Med J Indones 2005; 14: 220-4)
Abstract
The effect of balanced low-calorie diet for 14 days on body weight (BW), body mass index (BMI), total skin fold thickness (SFT), fat mass (FM), fat free mass (FFM), waist to hip ratio (WHR) and serum leptin level was evaluated by using a pre and post-experimental balanced low-calorie diet 915.23 kcal/day with the composition of 55.81% carbohydrate, 19.46% protein and 24.73% fat for 14 days on 39 obese-women subjects (19-55 years old) who have met the inclusion and exclusion criteria. The collected data include demographic characteristic, macronutrient and energy intake, as well as of anthropometry, FM, FFM, and serum leptin level. Body weight reduction occurs significantly (p<0.05) from 70.99 ± 8.62 to 68.81 ± 8.36 kg (3.07%); BMI reduction is significant (p<0.05) from 30.28 ± 3.11 kg/m2 to 29.36 ± 2.94 kg/m2 (3.04%); Significantly reduced SFT (p<0.05) from 99.36 ± 12.07 mm to 91.29 ± 10.85 mm (8.08%); Significantly reduced FM (p<0.05) from 35.41 ± 2.75 % to 33.65 ± 2.73% (1.76%); Significantly increased FFM percentage (p<0.05) from 64.59 ± 2.74 to 66.35 ± 2.73 (2.72%); Significantly reduced WC (waist circumference) (p<0.05) from 85.87 ± 7.31 to 83.35 ± 7.09 (2.93%); Significantly reduced HC (hip circumference) (p<0.05) from 107.59 ± 6.67 to 106.49 ± 6.37 (1.02%); Significantly reduced WHR (p<0.05) from 0.80 ± 0.05 to 0.78 ± 0.04 (2.24%); Significantly reduced serum leptin (p<0.05) from 23.31 (12.06-71.22) to 18.18 (7.90-65.11) (22.01%); positive correlation is observed between serum leptin level and FM significantly (p<0.05) before treatment (r=0.47 ; p=0.003) and after treatment (r=0.57 ; p=0.001). Balanced low-calorie diet may effectively reduce body weight, BMI, skin fold thickness, percentage of fat mass, to increase percentage of fat free mass, to reduce waist to hip ratio and serum leptin level. (Med J Indones 2005; 14: 220-4) Keywords : Balanced low-calorie diet, obesity, leptin, body composition
weight, among all is leptin hormone as key element of physiological system that maintains food absorption and weight. For the obese, level of serum leptin increases in line with the elevation of adiposity number.6 The permanently high leptin level of the obese may result in leptin resistance occurs.7,8
The decreasing of body weight (BW) besides reducing the risk of health also can reduce serum leptin concentration and improve homeostasis energy.9-12 One method for decreasing the BW is by diet therapy and a save and easy diet therapy is using balanced low calorie diet.13
The aim of this study is to determine the effect of balanced low calorie diet for 14 days on body composition and serum leptin level of obese women.
METHODS
Subjects
Subjects included 39 obese women who have been selected based on inclusion and exclusion criterion. Their average age were 40.87 ± 8.24 year old and
body mass index (BMI) ≥ 25 kg/m2
. Not under diet to reducing weight, not diabetic, not hypertension, not hyperuricemie, no history of heart disease, normal function of kidney and liver, not anemia, no history of hypothyroid or hyperthyroid, not pregnant, not lactating, not taking medication to reducing weight, stimulant and depressant.
The study protocol was approved by the local ethical committee and each subject gave informed consent.
Study design
The study entailed 3 period : In pre period, information about demografi, frequency, amount and kind of several food 3 months before treatment, 24 hours activity 1 day before treatment, anthropometric measurement, and serum leptin. During treatment period, every subject received a balance low calorie diet (LCD) 1000 kcal/day with composition carbohydrate, protein and fat were 55%, 20% and 25% for 14 days. Food
record was used during 14 days to assess the actual intake during the treatment period. During the treatment period subjects were instructed to their usual activity pattern and to avoid caffeine, tobacco products and taken medication. In post period subject had been finished doing their diet. On the 15 day the anthropometric measurement and serum leptin level were conducted.
Study measures
Body weight was measured in hospital gown to the nearest 0.1 kg using a digital scale. Body height was measured to the nearest 0.1 cm without shoes using a microtoise. Fat mass were calculated by skinfold thickness at three sites (triceps, suprailiac and femoral) using table from Jackson and Pollock. Fat free mass were calculated by body weight and fat
mass using Gibson’s formulas.
After subject had 12 hours fasted overnight, venous blood samples was drawn for measurement of serum leptin which were analyzed by radioimmunoassay.
Statistical analysis
Result are expressed as means. To compare baseline values and the end values. The student t test for normal variables with normal distribution was used. Otherwise the Wilcoxon test was used. The relation-ship between variables were studied using spearman rank correlation.
RESULTS
Table 1. Mean BW, BMI, FM and FFM subject before and after the dietary treatment
(n=39)
Variable Before treatment (n=39) After treatment (n=39) p Significance
BW (kg)
S: Significant, p < 0.05; NS: Not Significant p ≥ 0.05
Table 2. Energy intake before and during the study
Energy (kcals) Protein (g) Fat (g) Carbohydrate (g)
Before study
Table 3. Serum leptin before and after dietary treatment
Variable Before treatment (n=39) After treatment (n=39) p Significance
Leptin Serum
S: Significant, p < 0.05; NS: Not Significant p ≥ 0.05
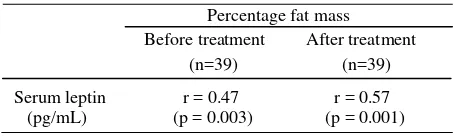
A significant positive correlation was found between the serum leptin and percentage fat mass, both before and after treatment.
Table 4. Spearman’s correlation between serum leptin and percentage fat mass before and after treatment
The subject have a good compliance during the study, it was shown by the mean of energy intake which was closed to what have suggested.
The mean BMI before treatment was 30.28 ± 3.11 kg/m2, based on WHO for Asia (2000) it was obese II. After treatment the mean BMI decreased to 29.36 ± 2.94 kg/m2, based on WHO for Asia (2000) it was obese I.
The mean WHR before treatment was 0.80 ± 0.05, based on Cotton (1996) it was medium risk for health, after treatment the mean WHR decreased to 0.78 ± 0.04, based on Cotton (1996) it was low risk for health.
The mean of serum leptin before treatment was 23.31 (12.06 – 71.22) pg/mL, after treatment was 18.18 (7.90 – 65.11) pg/mL, statistically significant reduced 5.13 pg/mL (22.01%).
Energy restriction and the effect of decreasing the body weight can reduce the serum leptin of the obese people, leptin concentration can also decrease as a reaction of the short term fasting (24 hours) to human and animal.10,15
There are some influences from quantity and composition of macronutrient to the serum leptin in diet process when decreasing the body weight, out of decreasing the fat mass. Serum leptin can decrease during 24 hours fasting and can increase after 4-5 hours after meal. Fasting cannot influences the serum leptin if the condition is in euglucemia, because
Macronutrient composition in diet can also influences the concentration of the serum leptin, low carbohydrate diet will give lower glucose and insulin response than the high carbohydrate diet.15,17
Table 4 shows a statiscally significant of positive correlation between serum leptin and fat mass, before (r=0.47) and after treatment (r=0.57). It’s because the serum leptin is an adiposite hormone.
CONCLUSION
Balanced low calorie diet was had shown to reduce BW, BMI, percentage of fat mass, to increase percentage of fat free mass, to reduce waist to hip ratio, serum leptin significantly, and positive correlation was obtained as well through this study between serum leptin level and body fat mass.
REFERENCES
1. Suyono S. Penatalaksanaan obesitas secara rasional: farmakologik dan non farmakologik. Simposium Obesitas, apakah suatu penyakit. Jakarta, 2001.
2. Oemardi M. Aspek biomolekuler obesitas. Simposium Obesitas, apakah suatu penyakit. Jakarta, 2001.
3. Soewondo P. Obesitas sebagai factor risiko penyakit jantung koroner. Simposium Obesitas, apakah suatu penyakit. Jakarta, 2001.
4. Seidell JC. The epidemiology of obesity. In: International textbook of obesity (Bjorntorp P. ed.) 23-9 John Wiley and Sons, UK, 2001.
5. Lean M. Introduction to the topic. In: Obesity the benefits of moderate weight loss (Susan Hames ed.). 3-8. Colwood House Medical Publication, UK, 1997.
6. Friedman J. Obesity in the new millennium. Nature Insight Obesity. 2000; 404:624-32.
7. Chu NF, Stampfer MJ, Spiegelman D et al. Dietary and lifestyle factors in relation to plasma leptin concentrations among normal weight and overweight men. Int J Obes 2001; 25:106-14.
8. Considine RV, Sinha MK, Heiman ML et al. Serum immunoreactive leptin concentrations in normal weight and obese human. N Engl J Med 1996; 334:292-5. 9. Wisse BE, Camfield LA, Marliss EB et al. Effect of
prolonged moderate and severe energy restriction and refeeding on plasma leptin concentrations in obese women. Am J Clin Nutr 1999; 70:321-30.
10. Racette SB, Kohrt WM, Landt M et al. Response of serum leptin concentrations to 7 d of energy restriction in centrally obese African Americans with impaired of diabetic glucose tolerance. Am J Clin Nutr1997; 66:33-7. 11. Grinspoon SK, Askari H, Landt ML et al. Effects of fasting and glucose infusion on basal and avernight leptin concentrations in normal weight women. Am J Clin Nutr 1997; 66:1352-6.
12. Rosenbaum M, Nicolson M, Hirsch J et al. (1997). Effects of weight change on plasma leptin concentration and energy expenditure. J Clin Endocrinol Metab 1997; 82:3647-54.
13. Dwyer JT, Lu D. Popular diets for weight loss from nutritionally hazardous to healthful dalam Obesity theory and therapy (Stunkard AJ ed.) 2nd ed. pp.231-52. Raven press, Ltd, New York, 1993.
15. Considine RV. Regulation of leptin production. Reviews in endocrine & metabolic disorders 2001; 2:357-63. 16. Bennet FI, Anderson NMF, Wilks R et al. Leptin
con-centrations in women is influenced by regional distribution of adipose tissue. Am J Clin Nutr 1997; 66:1340-4.