COMPREHENSION THROUGH VISUAL AIDS
(In case Eighth Grade of SMP N 2 Sukolilo and MTs MIftahul Fallah Wotan in Academic year of 2010/ 2011)
a final project
submitted in partial fulfillment of requirements for the degree of Sarjana Pendidikan in English
by Lelly Selviani
2201407193
ENGLISH DEPARTMENT
FACULTY OF LANGUAGES AND ARTS
SEMARANG STATE UNIVERSITY
ii
PERNYATAAN
Dengan ini:
Nama : Lelly Selviani
NIM : 2201407193
Prodi/ Jurusan : Pend. Bahasa Inggris S-1/ Bahasa dan Sastra Inggris
Fakultas Bahasa dan Seni Universitas Negeri Semarang menyatakan dengan sesungguhnya
bahwa skipsi/ tugas akhir/ final project yang berjudul
THE DIFFERENCE OF STUDENTS’ ACHIEVEMENT BETWEEN STATE JUNIOR HIGH SCHOOL AND MTS’ STUDENTS IN READING COMPREHENSION THROUGH VISUAL AIDS
(In case Eighth Grade of SMP N 2 Sukolilo and MTs MIftahul Fallah Wotan in Academic yer 2010/ 2011)
Yang saya tulis dalam rangka memenuhi salah satu syarat untuk memperoleh gelar sarjana
benar benar merupakan kerja sendiri yang saya hasilkan setelah melalui penelitian,
binbingan. Diskusi dan pemaparan ujian. Semua kutipan baik langsung maupun tidak
langsung, baik yang diperoleh dari sumber perpustakaan, wahana computer maupun sumber
lainya, telah disertakan keterangan mengenai identitas sumber dengan cara sebagaimana yang
lazim dalam penulisan karya ilmiah. Dengan demikian, penulisan skripsi/ final project tetap
menjadi tanggung jawab saya sendiri.
Demikian, surat pernyataan ini dapat digunakan seperlunya.
Semarang, Agustus 2011 Yang Membuat Pernyataan
iii
MOTTO AND DEDICATION
Do everything with your deeply heart
Dedicated to:
1. My beloved parents Juri and Harti
2. My sweet young sister Lovia Udhayani
3. My beloved fiancé Ripto
4. My lecturers
v
SWT, the great creator of beings, for keeping me alive together with the blessed great people, and for His abundance of mercy and grace so I could finally finish my final project.
I would like to extend my sincerest gratitude to Maria Johana A. W, S.S., M.Si as my first advisor for his guidance and suggestions during the consultation. My deepest appreciation also goes to Drs. La Ode Musyaridun as my second advisor who has read this final project carefully and given useful suggestions and corrections for its improvement. I also would like to extend my gratitude to all members of the lecturer staff of English Department of Semarang State University, for the guidance during my study at this university. My thank also goes to the SMP N 2 Sukolilo and MTs Miftahul Fallah Wotan in academic year of 2010/ 2011 for the Supports and participation in my study.
vi
ABSTRACT
Selviani, Lelly. 2011. The Difference Students’ Achievement Between State Junior High School and Mts’ Students in Reading Comprehension Through Visual Aids ( In case Eighth Grade of SMP N 2 Sukolilo and MTs MIftahul Fallah Wotan in Academic year of 2010/ 2011). Final Project, English Department, Language and Arts Faculty, Semarang State University.
Key words: Students’ achievement, State Junior High School, Mts, visual aids and reading comprehension
Teaching reading comprehension in secondary school was not easy. It required appropriate technique and media in order to encourage students’ motivation in learning reading. There were many types secondary schools in Indonesia. Two of them were SMP N or State Junior High School and Mts or Madrasah Tsanawiyah. There were many differences between State Junior High School and Mts. The purposes of this research were to find out the students’ achievement of State Junior High School and MTs in reading comprehension through visual aids.
The pre experimental design, one group pretest and posttest was used in constructing the research. The populations of this study were eighth grade of SMP N 2 Sukolilo and MTs Miftahul Fallah Wotan in academic year of 2010/ 2011. The first experimental group was VIII D of SMP N 2 Sukolilo and the second experimental group was VIII of MTs Miftahul Fallah Wotan. Both classes were taught reading comprehension through visual aids. After giving the treatment, the posttests were compared in both classes. Based on the result of the study, the average of SMP students was 86, 36 and the percentage of achievement was 86, 4%. Next for MTs, they got 81, 21 in average and the percentage of achievement was 81, 2%. In order to investigate whether the difference in mean was statistically significant, the t-test was conducted. Based on the computation, t-estimation 15, 88 was higher than critical value ( 2.00). Therefore it could be concluded that there was a difference between students achievement in both school.
vii
TABLE OF CONTENTS
Preface ...
Acknowledgement ... v
Abstract ... vi
Table of Contents ... vii
List of Appendices ... x
Chapter 1. INTRODUCTION ... 1
1.1 Background of The Study ... 2
1.2 Reason for Choosing The Topic ... 5
1.3 Hypothesis ... 6
1.4 Statement of Problem ... 6
1.5 Objectives of The Study ... 6
1.6 Significance of The Study ... 7
1.7 Limitation of The Study ... 8
1.8 Outline of The Report ... 8
2. REVIEW OF RELATED LITERATURE ... 10
2.1 Review of The Previous Study ... 10
2.2 Review of Theoretical Background ... 11
2.2.1 Definition of MTs ... 11
viii
2.2.3 Definition of Reading ... 13
2.2.4 Reading Technique ... 14
2.2.5 Reading Comprehension ... 17
2.2.6 Students’ Achievement in Reading ... 19
2.2.7 Definition of Visual Aids ... 21
3. METHOD OF INVESTIGATION ... 25
3.1 Data Collection ... 25
3.2 Participants of The Study ... 26
3.2.1 Population ... 26
3.2.2 Sample ... 27
3.3 Variable ... 28
3.4 Research Design ... 29
3.5 Instrument for Collecting Data ... 30
3.6 Try Out ... 32
3.6.1 Validity of The Test ... 32
3.6.2 Reliability of The Test ... 34
3.6.3 Difficulty Level ... 36
3.6.4 Discriminating Power ... 38
3.7 T- test ... 40
3.8 Procedure of Collecting Data ... 41
4. DATA ANALYSIS AND DISCUSSION ... 45
4.1 Students’ Reading Comprehension Achievement ... 45
ix
4.1.2 T- test for SMP ... 50
4.1.3 Students Reading Comprehension Achievement of MTs ... 51
4.1.4 T- test for MTs ... 54
4.2 The Difference Between Pretest Posttest SMP and MTs ... 55
4.3 The Difference Students’ Achievement of Students in SMP and MTs. 56 4.4 The Application of Visual Aids in Learning Process ... 61
4.5 The Advantages of Visual Aids ... 62
4.6 The Disadvantages of Visual Aids ... 65
5. CONCLUSIONS AND SUGGESTIONS ... 66
5.1 Conclusion ... 66
5.2 Suggestion ... 68
Appendices
x
LIST OF APPENDIXES
Appendix Page
1. The Code of Students in SMP N 2 Sukolilo ………. 69
2. The Code of Students in MTs Miftahul Fallah Wotan …………. 70
3. The picture of activities ..………... 71
4. The Computation of The Validity, Realibility, difficulty Level and Discriminating Power ………... 72
5. The Computation of Item Validity Test ……….. 76
6. The Computation Level of Difficulty Test ………. 77
7. The Computation of The Discriminating Power ……… 78
8. The Computation of The Reliability Test ……….. 79
9. The Score Results of SMP N 2 Sukolilo ………... 80
10. The Score Results of MTs Miftahul Fallah Wotan ……… 82
11. The Difference Between Pre Test And Post Test SMP ………. 84
12. The Difference Between Pre Test And Post Test MTs ………. 86
13. t Test SMP And MTs in Post Test ……… 88
14. Lesson Plan ……… 89
15. Reading Comprehension Test ……… 99
16. The Key Answer of Post Test ………... 105
xi
LIST OF TABLES
Table Page
1. Research Design ... 107
2. Classification Difficulty Level ... 108
3. Criteria of Discriminating Power ... 109
4. Treatment For SMP N 2 Sukolilo ... 110
5. Treatment For MTs Miftahul Fallah Wotan ... 111
6. The Interpretation of Test Score ... 112
7. Grade and Level o Achievement ... 113
8. Students’ Score for SMP N 2 Sukolilo ... 114
9. Students’ Score for MTs Miftahul Fallah Wotan ... 116
xii
LIST OF FIGURES
Figure
1
This chapter consists of background of the study, reasons for choosing the topic, hypothesis, statements of problem, objectives of the study, significance of the study, limitation of the study and outline of the study.
1.1
Background of the Study
This chapter presents the background of the study. Language as an important tool for communicate has great developing in the world. Language as a means of communication is used among human being in order to establish social relationship. There are many languages in the world, one of them is English. English as an international language has a big role in language development. Many countries in the world use English as native language even there are many use English as second language. Nowadays English in Indonesia becomes foreign language, but it is not impossible if sometime English become second language like in our neighbor countries such as Malaysia and Singapore so the government of Indonesia decided to enter English as an important course in the school. English was given not only for junior high school and senior high school but also elementary students and some kindergarten students.
society. We can use the benefits of social network such as Facebook, Yahoo Messenger, Twitter and Google. We also can get a lot of information about world through browsing internet. In order to join in international society we should have ability in communication using international language. We should master English as international language. Aware of the facts, we regret that Finocchiario (1974 : 12) states learning foreign language is different from learning native language because the students’ environment in achieving their first language and a foreign language is
different.
In learning English, we should master four important skills that are listening, speaking, reading and writing. One skill that must be mastered is reading. At the beginning, we learn to read and then we read to learn. We know much information by reading. The more reading we do, the more knowledge and information we will get. Reading is a language skill that requires a familiarity on the part of the reader with the two fundamental building blocks of the particular language under study structure and vocabulary.
second language, therefore, students in class may reflect a broad range of differences that may in part be traced to differences in reading ability in their first language.
To prepare our young generation in order to have ability in using English to communicate, started from child, every person is expected to get English course in the school. In Indonesia, English course is given starting from junior high school but nowadays elementary school moreover some kindergartens. This decision will be good starting for education in Indonesia. The government makes a national curriculum for all level students. National curriculum is expected helping English learning process. It can be guidelines for teacher in teaching English. Teachers can improve their lesson plan based on standard competence and basic competence in national curriculum. National curriculum was made in order teachers will not teach out of track and could teach in the right track. In Indonesia, there are many schools that want to be Sekolah Berbasis Internasional or International School so those school use English in learning class. Teachers are expected use English to convey the material of all lessons. To realize the desire to become Sekolah Berbasis Internasional, every school uses the standard international in facilitating and learning process.
curriculums are not same with other. In this case I take an example between state junior high school and Mts. There are many differences output between students from junior high school and Mts. In fact, we realize that the outputs from junior high school are more competent than outputs from Mts. The outputs from junior high school are better than Mts.
Students’ learning achievement, as Purwato says ( 1984: 101-107), is influenced by two factors. The first factor comes from the students themselves; the factor is called individual factor. This individual factor is also divided into physiological factors and psychological factors. The physiological which are to be the factors which influence students’ learning achievement are the physical and the five sense condition of students, while the psychological factors are students’ talent, interest, intelligence, motivation and cognitive ability. The next factors beside individual factors are social factors. Social factors are factors that come from outside of the individuals; these factors consist of environmental and instrumental factors. The environmental factors are such as the family, the house condition, the social motivation, the chance of learning, etc. the instrumental factors are such as the curriculum or material, the teacher and the medium of learning, the facilities the administration also influence students’ learning achievement.
and Atkinson say that “Achiement motivation should be characterzed by high hopes of success rather than by fear of failure”.
The other factor is teaching learning process. In teaching reading, the teacher should use various interesting media and material in order to motivate the students in learning reading skill. The media also should be easy to understand. They must stimulate students’ interest in reading and support their enthusiasm. By motivating the students using the variation of the media, the students’ ability in reading will be
improved. Nowadays, the technology in the world increases fast, we could get some profits of it.
1.2
Reasons for Choosing the Topic
Reasons for choosing the topic in this research are first the writer chooses state junior high school as the subject in her research because she thinks state junior high school becomes favorite school and the first choice for parents to deliver their students to study.
Then, she takes Mts as the other subject of her research because she thought many people think that Mts is different with formal school. They think that Mts as the second choice after state junior high school. The writer uses reading comprehension as the tool to describe the difference because she thinks most interested in reading. So to measure students’ achievement she uses reading comprehension. Teacher usually
She uses visual aids as a media to convey the text because she thinks nowadays we need change the old reading habit such as using textbook. We have to use an interesting media that’s why she uses visual aids. We have to take the benefit
of progression the technology.
1.3
Hypothesis
Hypothesis According to Wikipedia, hypothesis is a proposed explanation for an observable phenomenon. The hypothesis of this study is there is difference of students’ achievement between state junior high school and Mts in Reading comprehension through visual aids. Null hypothesis is typically proposes a general or default position, such as that there is no relationship between two measured phenomenon or that a potential treatment has no effect. The null hypothesis of this study is there is no difference of students’ achievement between state junior high school and Mts through visual aids.
1.4
Statements of the Problem
In this thesis, the writer intends to solve the following problem:
1. How is reading visual aids used in teaching reading comprehension?
2. What is the difference of students’ achievement in reading comprehension in state junior high school and Mts through visual aids?
1. To explain the application of visual aids as a media in teaching reading comprehension.
2. To describe the significant difference between students’ achievement of state junior high school and Mts in reading comprehension through visual aids.
1.6
Significance of the Study
The significances of the study which are expected are: 1. For students
It might motivate students to improve their skills in learning English. After knowing the difference both schools, the students could be more confident to show and improve their skills in order they could compete with other students in different school.
Students’ enthusiasm in learning English could be more increasingly because
using the interesting media that they never got before. Students could improve their ability in using the technology. They could take the advantages of technology to help them to solve the problems in their studying. Students could know the interesting media so they can enjoy and interested in learning English.
2. For teacher
1.7
Limitation of the Study
The writer limits the study to the following things.
1. The visual aid which is used in this study is reading visual aids. Reading visual aids that she means in this study is reading through picture in LCD projector. Every slide of the picture consists of picture and the text which relate to the picture itself.
2. The observation only conducted to the grade VIII State junior high school and VIII Mts. She chooses grade VIII because she thought the students in this grade won’t annoy if she gave them an instrument to measure students’
achievement.
3. The kinds of genres that she uses are recount and narrative text because it more suitable with the national curriculum of grade VIII. It is easy to make a visual aid reading using recount and narrative text.
1.8 Outline of the Report
This final project consists of 5 chapters. Chapter the writer covers the general background of the study, reasons for choosing the topic, hypothesis, statements of the problem, the objectives of the study and significance of the study.
Chapter II discusses about review of related literature and review of the previous study. It comprises students’ achievement in reading comprehension and
Chapter III talks about method of investigation that consists of data of the study or data collection, participants of the study, variable, instruments for collecting data, try out, t- test, procedures of collecting data .
Chapter IV discusses data analysis and discussion that consists of students’ reading comprehension achievement, the difference between pretest and posttest in SMP and MTs, the difference students’ achievement of students in State Junior High School and MTs trough visual aid, the application of visual aids in learning process, the advantages of visual aids and disadvantages of visual aids.
10
This chapter deals with the review of the previous study and review theoretical background proposed by experts in form of Mts, state junior high school, reading, reading techniques, reading comprehension, students’ achievements in reading and visual aid.
2.1 Review of the previous Study
Actually, the writer didn’t find the research about this study yet so she only looks for the previous study that relates to her study. It is also useful because she gets many references how to start doing her study. It guides her to do the steps in doing her study. She chooses some literatures about previous research which is relevant.
In this study, she emphasizes to find out the difference students’ achievement
both state junior high school and Mts. Then, she also wants to describe how to learn reading through visual aid.
2.2 Review of Theoretical Background
In this part, the writer would like to talk about the review of the theoretical background. It includes the definition of MTs, SMP or state junior high school, reading, reading techniques, reading comprehension, students’ achievement in
reading and visual aids.
2.2.1 Definition of Mts
There is no differences between Mts and others formal school. According to http://mtsrupa.raudlatul-ulum.com/hello-world/, Mts is school that has function like state junior high school but in this school used Islamic system. From UU Nomor 20/2003, Mts is same with state junior high school. Based on Peraturan Pemerintah No 66/ 2010, Mts or Madrasah Tsanawiyah is one form of formal education in which assisted the Minister of Religious Affairs held a general education which Islamic religious distinctiveness on basic education as a continuation of MI, SD and other equal or continuation of recognized learning outcomes.
Admin says that the learning process is growing belief in God along day and also coordination with the parents intensively. It was done by giving motivation, punishment and habitual. It was included in internalization method.
Evaluation of education in Mts is the same as in the school. The difference may lie in evaluating the results of cultivation of faith. In other words, the results of the evaluations were done by faith education portfolio: assessment conducted continuously (progressive assessment).
So, Mts is secondary school is formal school which has curriculum based and national curriculum and Islamic system.
2.2.2 Definition of State Junior High School
Based on Peraturan Pemerintah No 66/ 2010, state junior high school is one of formal education that carries out public education on basic education as a continuation of SD, MI or equivalent or other form of advanced learning outcomes are recognized as equal or equivalent to SD or MI.
Based on those definitions, she concludes that state junior high school is formal school which has curriculum based on national curriculum and didn’t
emphasized in religion system.
2.2.3 Definition of Reading
For many years, three basic definitions of reading have driven literacy programs in the United States (Foertsch, 1998). According to the first definition, learning to read means learning to pronounce words. According to the second definition, learning to read means learning to identify words and get their meaning. According to the third definition, learning to read means learning to bring meaning to a text in order to get meaning from it.
Although these definitions reflect long-standing views of reading, current literacy research supports a more comprehensive definition of reading. This new definition includes all of the above definitions and places learning skills in the context of authentic reading and writing activities. It recognizes the importance of skill instruction as one piece of the reading process (Allington & Cunningham, 1996; International Reading Association & National Association for the Education of Young Children, 1998; Maryland State Department of Education, n.d.; Snow, Burns, & Griffin, 1998).
We could be able to practice our tongue and our pronunciation. Reading can also bring us to see the content of world that we didn’t know before. Besides that, reading
is also useful hobby. There are many techniques of reading such as scanning, skimming, extensive reading, reading loudly, reading comprehension and etc.
2.2.4 Reading Techniques
There are some kinds of reading techniques. Most of the techniques are familiar to the students in their native language. But it is necessary to re- train them, as some students have some difficulty in applying them to a second language ( Grellet, 1981)
Grellet ( 1981 : 14 – 19) explains some kinds of reading technique as follow:
1. Sensitizing
The aim of this section is to provide exercise that will develop the strategies that students need to cope with unfamiliar words and complex or apparently obscure sentences.
a. Inference
Inference means making use syntactic, logical and cultural clues to discover the meaning of unknown elements.
Inability to infer the meaning of unknown elements often causes discouragement and apprehension in students when they are faced with a new text. It is therefore important to train the students to look first for the core of the sentence (subject+ verb)
c. Linking sentences and ideas
Another area in which it is essential to prepare the students is in recognizing the various devices used to create textual cohesion and more particularly the use of reference and link words. Reference covers all devices that permit the lexical relationship within a text. It is important for the students to realize that a text is not made up independent sentences or clauses, but that it is a web of related idea that are announced, introduced and taken up again later throughout the passage with the help of references.
2. Improving reading speed
3. From skimming to scanning
a. Predicting
This is not really a technique but a skill which is basic to all the reading techniques practiced in this part and to the process of reading generally. It is the faculty of predicting or guessing what is to come next, making use of grammatical, logical and cultural clues.
b. Previewing
Unlike predicting, previewing is a very specific reading technique which involves using the table of contents, the appendix, the preface, the chapter and paragraph headings in order to find out where the required information is likely to be.
c. Anticipation
d. Skimming and Scanning
When skimming, we through the reading material quickly in order to get the gist of it, to know how it is organized, or to get an idea of the tone or the intention of the writer.
When scanning, we only try to locate specific information and we do not even follow the linearity of the passage to do so. We simply let our eyes wander over the text until we find what we are looking for, whether it is a name, a date, or less specific piece of information.
It is important to acquire reading strategy because from reading strategy we could be able to comprehend the content of the text.
2.2.5 Reading comprehension
Reading comprehension is defined as the level of understanding of a writing text and the content of the text. Reading comprehension is the understanding we receive when we read something. It is an active, thinking process that depends not on comprehension skills but also on studnets’ experiences and prior knowledge (Swan, 1992: 1). According to Harris and Sipay (1980: 479) in How Increase Reading Ability
effortlessly. If word recognition is difficult, students use too much of their processing capacity to read individual words, which interferes with their ability to comprehend what is read.
It’s clear that reading comprehension is a complex cognitive process that
depends upon a number of ingredients all working together in a synchronous, even automatic way. Vocabulary clearly plays a critical role in understanding what has been read. The reader must also be intentional and thoughtful while reading, monitoring the words and their meaning as reading progresses. And the reader must apply reading comprehension strategies as ways to be sure that what is being read matches their expectations and builds on their growing body of knowledge that is being stored for immediate or future reference. In reading comprehension, the reader doesn’t only read word by word the text but the reader should also know the content
of the text, what the text tells about. The reader should also understand about the vocabulary difficult words so it can enrich vocabulary building.
reading comprehension skills on their own if the teacher gives them explicit mental tools for unpacking text (Pressley, 2006).
Roe and Ross, (1984: 109) write:
There are seven major types of questioned based on comprehension skill, which can be useful in guiding reading, they are first main idea. Main idea consist of te point is to ask the students to identify the central theme of the selection. Main idea helps them to be aware of details and relationship among them. Then detail, the point is to ask for bits of information conveyed by the material. After detail, we also emphasize the vocabulary, the point is to ask for the meaning of words used in selection. It can be used to check the students’ understanding of word meaning. Next sequence is to require knowledge of events in their order of occurrences. Then, inference is to ask information that is implied but not directly stated the material. After inference we also give the in the evaluation is to ask for judgment about the material. The last is creative responses, the point is to ask the children to go beyond the material and create new ideas based on the ideas they read.
Reading comprehension is one of reading form that included students’
understanding of the context text. Reading comprehension could be way to measure students’ achievement in reading.
2.2.6 Students’ Achievement in Reading
'mastering' to the greatest degree possible the curriculum outcomes which have been mandated by the province I teach in.
According to Ponders from http://blogs.plsweb.com/2007/11/what-is-student-achievement.html
List the following student achievement goals:
1. Academic: all students will obtain, understand, analyze, communicate and apply knowledge and skills to achieve success in school and life.
2. Essential life skill: all students will demonstrate the aptitude, attitude, and skills to lead responsible, fulfilling and respectful lives.
3. Responsibility to the community: all students will understand and model the important attributes people must have to contribute to an effective and productive community.
Students’ achievements involve collecting and processing a certain amount of information, including nonprinting material such as photographs, video footage, and phone interview data. Also, students need to be able to think and talk about what they have done. The thinking and talking about the work is as much an expected achievement as is the product of the work.
Student’s achievement in reading or reading achievement is the score gained
reading comprehension process. Every student has different reading achievement. Reading achievement also means how far students can appreciate or apply that reading comprehension.
According to National Assessment of Educational Progress (NAEP) reading achievement-level descriptions present expectations of student performance in relation to a range of text types and text difficulty and in response to a variety of assessment questions intended to elicit different cognitive processes and reading behaviors. The specific processes and reading behaviors mentioned in the achievement-level descriptions are illustrative of those judged as central to students' successful comprehension of texts. These processes and reading behaviors involve different and increasing cognitive demands from one grade and performance level to the next as they are applied within more challenging contexts and with more complex information. While similar reading behaviors are included at the different performance levels and grades, it should be understood that these skills are being described in relation to texts and assessment questions of varying difficulty.
2.2.7 Definition of Visual Aids
Instructional media is a component that includes a message instructional, people and equipment. According to Djamarah and Zain at http://wiki.answers.com/Q/What_is_the_Definition_and_meaning_of_audio_visual_a ids#ixzz1MZjCJny7, the media is a vehicle for channeling information learned or information messages. In the development of learning media follows development of technology. Based on these technological developments, the general types of learning media are grouped menjadi1) Visual Aids, 2) Audio Aids, and 3) Audio-visual Aids
1. Visual Aids
A visual aid is any object or picture that relates to the subject being taught. Posters, pictures, or even the object itself can be used to help teach.
2. Audio Aids
The visual aids involving the sense of hearing. It helps individuals learn through listening. It may help in making the impression of the lesson permanents on pupil’s mind. The examples of audio aids are radio, tape recorder, gramophone
etc.
3. Audio Visual Aids
Visual Aids
Visual Aids is an item of illustrative matter, such as a film, slide, or model, designed to supplement written or spoken information so that it can be understood more easily. From http://www.ehow.com/about_5038001_definition-visual-aids.html, a visual aid is an object or representation that may be used to clarify or enhance understanding of a concept or process. The best way to ensure success in learning is to present information in different formats for different learners. Visual aids may take the form of graphs, charts, tables or photographs pertaining to the information being presented. In demonstrations and group discussions, visual aids may be projected onto a screen, pasted to a board on an easel or displayed on a television. Visual aids may appear in texts and in handouts.
According to Daryanto (2010: 110), the characteristics of visual aids are as the following:
1. Visual aids is second dimension picture, in learning side became very important especially for the young students in learning difficult subjects.
2. Visual aid is silent medium and therefore in this case the term that is often used in fixed image.
4. Visual aids emphasize in main idea that chooses appropriate picture or image based on main idea.
5. Visual aids can be used in all of subjects.
In creating visual aids that is used in conveying materials, we have to consider some basic principles. Daryanto (2010: 114) said that there are several principles in creating visual aids. They are as follows:
1. Use picture or image for specific subject by choosing the specific picture to stick up for exact main subject.
2. Match some pictures on that subject, because the effectiveness of using visual aids in learning process needs cohesiveness.
3. Just using the effective pictures.
4. Evaluate the improvement of the class.
25
This chapter discusses the data collection, participants of the study, variable, instruments for collecting data, try out, t-test and procedure collecting data.
3.1 Data Collection
In this study, the writer chose the pre experimental research to obtain the required data and information. According to Sugiyono (2008: 74), pre experimental design is a research design that there is no control or manipulation group. In addition, According to Hartoyo (2009: 67), pre experimental has purpose to determine cause and effect and there is a direct manipulation of conditions. The design is as follow:
E : O1 X O2
( Hartoyo ) Where,
E : the symbol of experimental group O1 : pretest
X : treatment
The pre experimental does not allow the control or manipulation of all relevant variables. There are three kind of pre experimental design, they are: one group post test only, one group pretest posttest and static group comparison. In this study the writer uses one group pretest posttest. First, she uses this method in SMP N 2 SUKOLILO then she also uses the same method in MTS MIFTAHUL FALLAH WOTAN.
In this study the research is done by means of pre experimental method. She taught 2 groups students, state junior high school as first group and Mts as second group to distinguish the students’ achievement in reading comprehension in both of
those school. Those groups are taught by giving treatment: reading through visual aids as the medium. At the beginning of the experiment the groups were given a pre- test and at the end, a post test.
3.2
Participants of the Study
Subject of the study is the respondents of this research, consists of population and sample.
3.2.1 Population
argues that a population is any group of individuals that have one or more characteristics in common that are interesting to the researcher.
The populations of this study were the eighth grade of SMP N 2 Sukolilo as the first population and the eighth grade of MTS Miftahul Fallah Wotan as the second population in academic year 2010/ 1011. For SMP N 2 Sukolilo, the class consists of five classes with the total number of students are 164 students. Then, for MTS Miftahul Fallah Wotan, the class only has one class with the number of students are 28 students. Moreover, they were chosen as the population of the research based on some reasons, those are:
(1) The students didn’t prepare National Examination.
(2) The students can improve their achievement in reading comprehension. (3) The students had been studying English for the same period.
3.2.2 Sample
The eighth grade students of SMP N 2 Sukolilo in the academic year 2010/ 2011 consist of five classes VIIIA- VIIIE. There are 164 students. If the observed population is more than 100, then the sample 10- 15 % or more than 25%. Therefore the writer uses VIII D as first sample. For the second sample, the writer uses class VIII students of MTS Miftahul Fallah Wotan in academic year 2010/ 2011. Because the population of this school less than 100, so the writer took the whole population sample.
3.3 Variable
According to Best (1981: 59) variable is the condition or characteristics that an investigator or a researcher manipulates, control or observes. In this research there were two variables; first dependent variable according to Hartoyo dependents variable is a response variable or output. It is an observed aspect of the behavior of an organism that has been stimulated. The dependent variable is that factor which is observed and measured to determine that effect of the independent variable. Based on the definition, the dependent variable of this study is students’ achievement in reading comprehension.
relationship to an observed phenomenon. Based on the definition, the independent variable of this study was visual aids.
3.4 Research Design
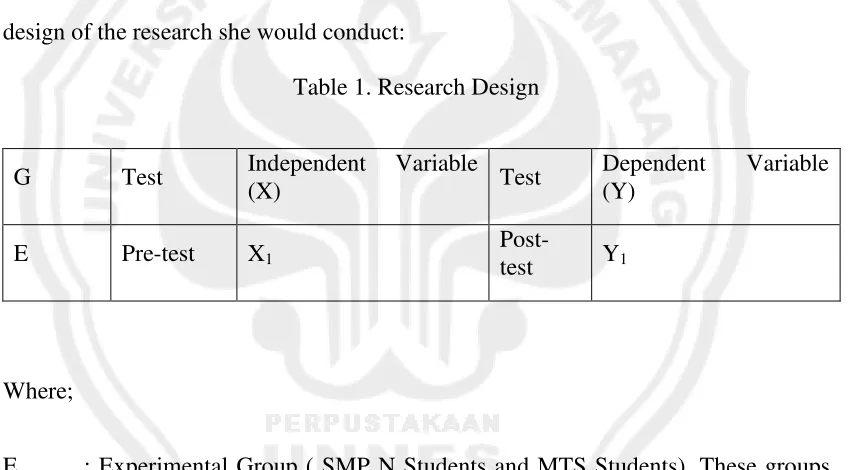
[image:40.612.112.537.340.575.2]The writer used visual aids as a media to measure reading comprehension. Therefore, she would see what will happen to students’ achievement in reading comprehension in both schools SMP N and MTS when they are taught by using visual aids. She chose one group pretest-posttest design with one treatment as the design for this study. She conducted this same treatment in both schools. The following was the design of the research she would conduct:
Table 1. Research Design
G Test Independent Variable
(X) Test
Dependent Variable (Y)
E Pre-test X1
Post-test Y1
Where;
E : Experimental Group ( SMP N Students and MTS Students). These groups will be taught through visual aids.
X : Independent Variable
Y : Dependent Variable
Y1 : Dependent variable for the results or students learning achievement of group through visual aids.
The effectiveness of the instructional treatment is measured by comparing the average score of the pre-test and the post test. When it turns out that the post-test average score is significantly higher than the average score of the pre-test, then it is concluded that the instructional treatment is effective. After knowing the results of each group, she compares the results of each group and decides the best one.
3.5 Instruments for Collecting Data
Test is a group questions or exercises also the other instruments to measure the skill, knowledge, and ability of individual or group (Arikunto, 2006:150). The purpose of the test items is to measure students’ achievement as the result of learning process.
Harris (1969: 60-61) suggests that the general form of the reading test consists of a number of short passages by a series of multiple choice comprehension items. Some criteria to select the reading comprehension passages.
1. Length
2. Subject Matter
The passages must be clear and meaningful and do not require outside subject matter information to be fully comprehend so as not to give a marked advantage to students of particular field.
3. Style
The passages should have various types and style. The passages should have chronologically with series of events.
4. Language
The passages are not overloaded with extremely difficult lexical difficult items and complex syntactical structure.
In this research the writer used a test as its instrument. Test is an assessment intended to measure the respondents' knowledge or other abilities (http://en.wikipedia.org/wiki/Test). The type of test used in this study is reading comprehension test. The writer used pretest and posttest.
3.6 Try Out
The quality of the data whether it is good or bad, is based on the instrument used to collect the data. In fact, the good quality of instrument depends on validity and reliability. Before the students got the pretest, the writer had to give try out first to other class. After scoring the result of try out, the writer had to analyze the data to find out the result of this test that the writer got its validity and reliability.
In this research, the try out test was conducted of the sample consisting 31 students of class VIIIC on March, 17 2011.
3.6.1 Validity of the test
Validity is the extent to which inferences made from assessment results are appropriate, meaningful, and useful in terms of the purpose of the assessment said Gronlund (1998: 226). Validity is the standard that shows whether the instrument is valid or not. To calculate the validity of each item, the writer used the product moment formula:
N XY – ( X)( Y) xy =
{(N X2) – ( X)2}{(N Y2) – ( Y)2}
( Best 1981: 158)
Where,
N = the number of students/ subject participating in the test. Σx = the sum of score in each item.
Σy = the sum of total score in each students.
Σx2 = the sum of the square score in each item.
Σy2 = the sum of the square score in each student.
Σxy = the sum of multiple of score from each student with the total score in each item.
Then, the computation for item no 1 goes like this
N = 33 Σxy = 471
Σx = 27
Σy = 521
Σx2
= 729 Σy2
= 9777
By using that formula, we obtained that: ( 33 x 471 )–( 27 x 521) xy =
xy = 0.5125
On a = 5 % with N = 33 it is obtained = 0,344
Because of xy
›
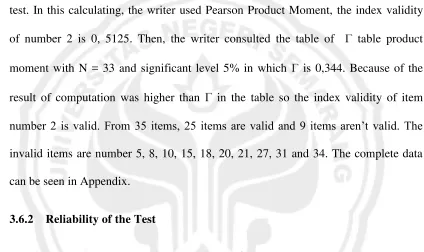
table so the item 2 is valid.As mentioned before, item validity is used to find out the index validity of the test. In this calculating, the writer used Pearson Product Moment, the index validity of number 2 is 0, 5125. Then, the writer consulted the table of table product moment with N = 33 and significant level 5% in which is 0,344. Because of the result of computation was higher than in the table so the index validity of item number 2 is valid. From 35 items, 25 items are valid and 9 items aren’t valid. The
invalid items are number 5, 8, 10, 15, 18, 20, 21, 27, 31 and 34. The complete data can be seen in Appendix.
3.6.2 Reliability of the Test
[image:45.612.104.528.271.523.2]k M(k- M) r11 = 1-
k – 1 kVt Where,
r11 = the reliability of the instrument
k = the number of item
M = the means of the scores
Vt = the total variance
To get the result of Vt, the formula used is:
y 2 y2– N Vt =
N Where,
N : the number of students participating in the test y : the sum of even item
y2 : the sum of the square score of the even item. y2
y2– N Vt =
N
(521)2
9777 – 33
Vt = = 48. 4848
35 47.016 – 6.8852 r11 =
35 – 1 47.0156 = 0.845
For α = 5% and number of subject = 33, r table = 0.344 Because r11
›
r table, then the instrument is reliable.
From the result above, the computation obtains 0,845, for α = 5% with N =
33, the r table = 0,344. Because the value results from the computation are higher than the critical value, it can be said that the instrument used in this research is reliable.
3.6.3 Difficulty Level
The difficulty level is a number that shows the easy and difficulties of an item. A good test is a test which is not too easy and difficult. The formula as follow:
B P =
js
Where,
P = index of difficulty ( Item facility)
B = the number of students who answered correctly.
According Arikunto (2006: 210), the item difficulty of the test is categorized into 3 levels: difficult, medium and easy.
0, 0 < P ≤ 0, 30 is said difficult
0, 30 < P ≤ 0, 70 is said medium
0, 70 < P ≤ 1, 00 is said to be easy
The calculation for item number 1
28 P =
33 = 0.85
So the item number 1 is easy.
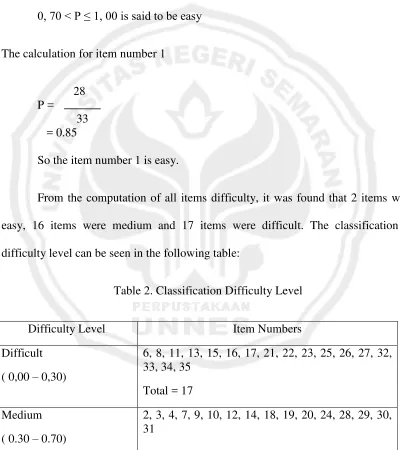
[image:48.612.112.512.245.695.2]From the computation of all items difficulty, it was found that 2 items were easy, 16 items were medium and 17 items were difficult. The classification of difficulty level can be seen in the following table:
Table 2. Classification Difficulty Level
Difficulty Level Item Numbers
Difficult ( 0,00 – 0,30)
6, 8, 11, 13, 15, 16, 17, 21, 22, 23, 25, 26, 27, 32, 33, 34, 35
Total = 17 Medium
( 0.30 – 0.70)
Total = 16 Easy
( 0.70 – 1.00)
1, 4 Total = 2
3.6.4 Discriminating Power
The discriminating power measures how well the test items manage to identify the differences in achievement level among the students. Taking approximately 27, 5 % from the highest rank as the upper group and 27,5 % from the lowest rank as the lower group. The formula is:
To find the discriminating power of the test items, the writer uses formula:
FH – FL ID =
N
Where,
ID = index of discriminating power ( Items Discrimination)
FH = the number of students in upper group with correct answers ( Frequency High)
N = the number of students in upper group or in lower group.
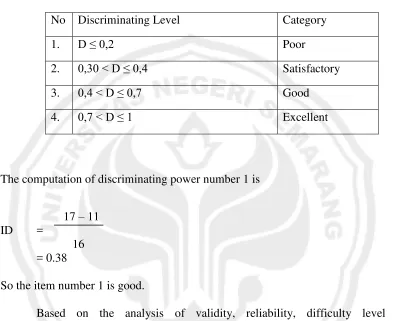
[image:50.612.113.510.214.535.2]( Nurgiyantoro, 1988: 140)
Table 3. Criteria of Discriminating Power
No Discriminating Level Category
1. D ≤ 0,2 Poor
2. 0,30 < D ≤ 0,4 Satisfactory 3. 0,4 < D ≤ 0,7 Good 4. 0,7 < D ≤ 1 Excellent
The computation of discriminating power number 1 is
17 – 11 ID =
16 = 0.38
So the item number 1 is good.
3.7 t- test
t- test is used to see the difference of students’ reading comprehension achievement between State Junior High School and Mts School through visual aids as a medium in learning process. There is a significant difference or not both schools. The formula in t-test as follow:
( Furchan 2007: 224)
where,
Mx = the mean score of first group.
My = the mean score pf the second group
Nx = the number of the students of the first group
Ny = the number of the students of the second group ΣX2
= the total of the square deviation of the first group ΣY2
= the total of the square deviation of the second group
To determine the significant difference using visual aids as media in each group, the writer uses the t -test formula:
y x Y
X
2 2
Y X
1 1 2
x
M M
t 1
Md t =
Σx2d
N ( N- 1) ( Arikunto 2006: 86) Where,
t : t- value
Md : mean from d ( deviation) between posttest and pretest xd : the difference between deviation and mean deviation N : the numbers of subjects
df : or db is N-1
3.8
Procedures of Collecting Data
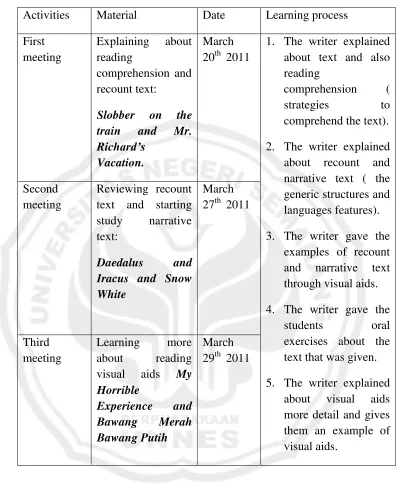
Table 4. Treatment for SMP N 2 SUKOLILO Activities Material Date Learning process First meeting Explaining about
reading
comprehension and recount text:
Slobber on the
train and Mr.
Richard’s Vacation
March 23rd 2011
1. The writer explained about text and also reading comprehension ( strategies to comprehend the text). 2. The writer explained
about recount and narrative text ( the generic structures and languages features). 3. The writer gave the
examples of recount and narrative text through visual aids. 4. The writer gave the
students oral exercises about the text that was given.
5. The writer explained about visual aids more detail and gives them an example of visual aids.
Second meeting
Reviewing recount text and starting study narrative text:
Daedalus and
Iracus and Snow White
March 24th 2011
Third meeting Learn reading visual aids My Horrible
Experience and
Bawang Merah
Bawang Putih
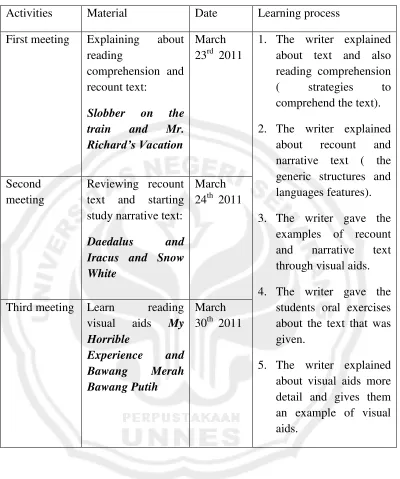
Table 5. Treatment for MTs Miftahul Fallah Wotan Activities Material Date Learning process First
meeting
Explaining about reading
comprehension and recount text:
Slobber on the
train and Mr.
Richard’s
Vacation.
March 20th 2011
1. The writer explained about text and also reading
comprehension ( strategies to comprehend the text). 2. The writer explained about recount and narrative text ( the generic structures and languages features). 3. The writer gave the
examples of recount and narrative text through visual aids. 4. The writer gave the
students oral exercises about the text that was given. 5. The writer explained
about visual aids more detail and gives them an example of visual aids.
Second meeting
Reviewing recount text and starting study narrative text:
Daedalus and
Iracus and Snow White
March 27th 2011
Third meeting
Learning more about reading visual aids My Horrible
Experience and
Bawang Merah
Bawang Putih
March 29th 2011
45
This chapter consists of the data analysis and discussion of research findings. This chapter deals with students’ reading comprehension achievement of SMP N students
and MTs students, the difference of reading comprehension achievement both schools, the application of visual aids in learning process and the advantages and disadvantages of visual aids.
4.1
Students’ Reading Comprehension Achievement
In this research the writer used multiple choice items to measure students’
achievement in reading comprehension. The score of each correct was 1 and the wrong answer was 0, the there were 25 items and maximum scores was 100 so the writer multiple by 100. The writer used the following formula;
c
S = x 100
N Where,
Then, the test score could be generally classify into four groups as follows: Table 6. The Interpretations of Test Score
Test Score Probable Performance
80- 100 Good to Excellent
60- 79 Average to Good
50- 59 Poor to Average
0- 49 Poor
Harris citied in Wahyuni (2010: 40)
From the table above, students’ performance can be divided into four parts.
Firstly, when the score was 80 – 100 it belongs to good to excellent. Secondly, average to good if the score was 60 – 79 the probable performance was average to good. Then, 50 – 59 belongs to poor to average. The last, 0 – 49 belongs to poor.
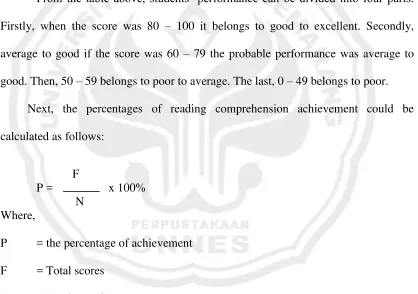
Next, the percentages of reading comprehension achievement could be calculated as follows:
F
P = x 100%
N Where,
P = the percentage of achievement F = Total scores
N = Maximum Scores
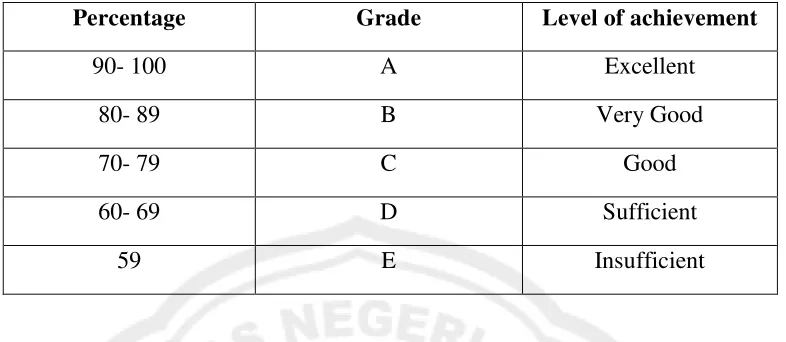
Table 7. Grade and Level of Achievement
Percentage Grade Level of achievement
90- 100 A Excellent
80- 89 B Very Good
70- 79 C Good
60- 69 D Sufficient
59 E Insufficient
Students’ achievement percentage from the table above can be explained such as excellent. The percentage students’ achievement included excellent when the percentage 90 – 100. Then when the percentage was 80 – 89, it belongs to very good. Students’ percentage called good, if the percentage of students’ score was 70- 79. Next, when the score was 60 – 69, it included sufficient. When the score was 59, it belongs to insufficient.
4.1.1 Students’ Reading comprehension Achievement of State Junior High
School
projector as media to convey the material for the students. After giving explanation about recount and narrative texts, she asked students orally about the content of the text through visual aids that was seen in LCD projector. She had to manage the teaching and learning process seriously in order to make the teaching learning process using visual aids as media reading conducted appropriately.
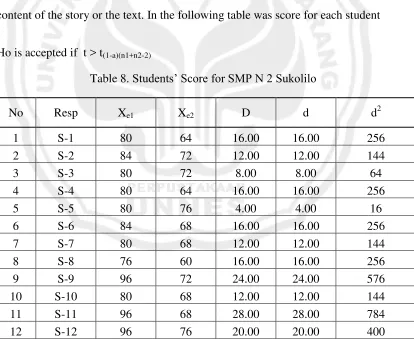
After giving them a treatment, in the last meeting the writer gave reading comprehension test. First students had to see the reading visual aids before doing the test. The visual aids was representation each text that will be given for the students. It takes about 15 minutes. From reading visual aids students might suggest the whole content of the story or the text. In the following table was score for each student
[image:59.612.117.531.364.703.2]Ho is accepted if t > t(1-a)(n1+n2-2)
Table 8. Students’ Score for SMP N 2 Sukolilo
No Resp Xe1 Xe2 D d d2
1 S-1 80 64 16.00 16.00 256
2 S-2 84 72 12.00 12.00 144
3 S-3 80 72 8.00 8.00 64
4 S-4 80 64 16.00 16.00 256
5 S-5 80 76 4.00 4.00 16
6 S-6 84 68 16.00 16.00 256
7 S-7 80 68 12.00 12.00 144
8 S-8 76 60 16.00 16.00 256
9 S-9 96 72 24.00 24.00 576
10 S-10 80 68 12.00 12.00 144
11 S-11 96 68 28.00 28.00 784
13 S-13 84 76 8.00 8.00 64
14 S-14 92 72 20.00 20.00 400
15 S-15 84 76 8.00 8.00 64
16 S-16 84 76 8.00 8.00 64
17 S-17 96 76 20.00 20.00 400
18 S-18 88 72 16.00 16.00 256
19 S-19 96 72 24.00 24.00 576
20 S-20 96 80 16.00 16.00 256
21 S-21 80 72 8.00 8.00 64
22 S-22 80 64 16.00 16.00 256
23 S-23 84 68 16.00 16.00 256
24 S-24 80 72 8.00 8.00 64
25 S-25 96 76 20.00 20.00 400
26 S-26 96 84 12.00 12.00 144
27 S-27 80 68 12.00 12.00 144
28 S-28 92 76 16.00 16.00 256
Σ 2420 2008 412 412.00 6960
SD 7.08 5.33
Mean 86, 357 71, 714
Min 76.00 60.00
Max 96.00 84.00
Range 20.00 24.00
Median 84.00 72.00
Mode 80.00 72.00
students in reading comprehension through visual aids were 2420 and the mean were 86, 357. Then the calculation of reading comprehension achievement could be seen as follow:
86, 357
P = x 100%
100 = 86, 357 % = 86, 4 %
The percentages of SMP’s students in reading visual aids was 86, 4%. It could
be inferred the grade for State Junior High School was B or very good. 4.1.2 t test for SMP
In finding the significant difference between pretest and posttest, in this research the writer used t- test. She used the following formula:
ΣD Md =
N = 14, 71
Md t =
Σx2d
14, 71
t = = 4, 85
6960
28 ( 28- 1)
For @ = 5% and dk = 28 - 1 = 27 , t(0.95)(27) = 2.0518
2.00 4.85
Since t value
›
t table mean there is a significant difference between post test
and pretest. t value was 4, 85 > t table was 2. 00. From the results above she concluded that there is a significant difference before and after visual aids.4.1.3 Students’ Reading comprehension Achievement of MTs
In teaching learning process of students class VIIID as second experimental group, was taught in three times. The first meeting was held on March 20, 2011. The second meeting was on March 27, 2011. Then, the last meeting was held on March 29 2011. The writer gave same treatment like in State Junior High School. The first meeting took an hour; second and third meeting takes two hours. First, they look interesting about the media that used in learning process. The writer used LCD projector as media to convey the material for the students. After giving explanation about recount and narrative texts, she asked students orally about the content of the text through visual aids that was seen in LCD projector. She had to manage the teaching and
learning process seriously in order to make the teaching learning process using visual aids as a media reading conducted appropriately.
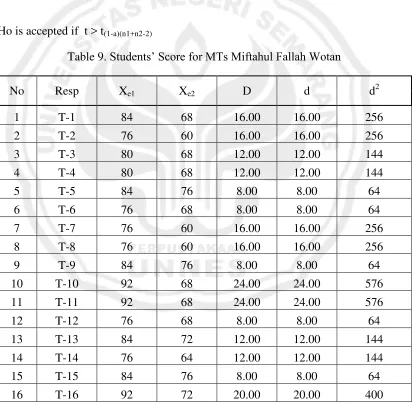
After giving them a treatment, in the last meeting the writer gave reading comprehension test. First students had to see the reading visual aids before doing the test. The visual aids was representation each text that will be given for the students. It took about 15 minutes. From reading visual aids students might suggest the whole content of the story or the text. In the following table was score for each student.
[image:63.612.116.528.303.706.2]Ho is accepted if t > t(1-a)(n1+n2-2)
Table 9. Students’ Score for MTs Miftahul Fallah Wotan
No Resp Xe1 Xe2 D d d2
1 T-1 84 68 16.00 16.00 256
2 T-2 76 60 16.00 16.00 256
3 T-3 80 68 12.00 12.00 144
4 T-4 80 68 12.00 12.00 144
5 T-5 84 76 8.00 8.00 64
6 T-6 76 68 8.00 8.00 64
7 T-7 76 60 16.00 16.00 256
8 T-8 76 60 16.00 16.00 256
9 T-9 84 76 8.00 8.00 64
10 T-10 92 68 24.00 24.00 576
11 T-11 92 68 24.00 24.00 576
12 T-12 76 68 8.00 8.00 64
13 T-13 84 72 12.00 12.00 144
14 T-14 76 64 12.00 12.00 144
15 T-15 84 76 8.00 8.00 64
17 T-17 84 72 12.00 12.00 144
18 T-18 84 72 12.00 12.00 144
19 T-19 88 72 16.00 16.00 256
20 T-20 84 68 16.00 16.00 256
21 T-21 80 60 20.00 20.00 400
22 T-22 72 60 12.00 12.00 144
23 T-23 68 56 12.00 12.00 144
24 T-24 84 68 16.00 16.00 256
25 T-25 84 68 16.00 16.00 256
26 T-26 80 64 16.00 16.00 256
27 T-27 84 60 24.00 24.00 576
28 T-28 76 64 12.00 12.00 144
Σ 2280 1876 404 404.00 6448
SD 5.88 5.51
Mean 81, 214 67
Min 68.00 56.00
Max 92.00 76.00
Range 24.00 20.00
Median 84.00 68.00
Mode 84.00 68.00
were 81, 214. Then the calculation of reading comprehension achievement could be seen as follow:
81, 214
P = x 100%
100 = 81, 21 % = 81, 2 %
The percentages of SMP’s students in reading visual aids was 81, 2%. It could
be inferred the grade for State Junior High School was B or very good. 4.1.4 t test for Mts
In finding the significant difference between pretest and posttest, in this research the writer used t- test. She used the following formula:
ΣD Md =
N = 14, 43
Md t =
Σx2d
N ( N- 1) ( Arikunto 2006: 86) 14, 43
t = = 4, 94
6448
28 ( 28- 1)
2.00 4.94
Since t value
›
t table mean there is a significant difference between post test
and pretest. t value was 4, 94 > t table 2, 00, So there was a significant difference students’ achievement before and after giving visual aids.4.2 The difference between pretest and posttest in SMP and MTs
After seeing the results of pretest and posttest in both schools, we could conclude that visual aids had effectiveness to improve students’ achievement in reading
comprehension. For SMP N 2 Sukolilo, the percentage of student achievement in pretest was 71, 7% and posttest was 86, 4%. Thus, when they were contrasted, they were 15.3%. Then for MTs Miftahul Fallah Wotan, the percentage of students achievement in pretest was 67% and in posttest was 81,2%. Thus, when they were contrasted, they were 14, 2%. From the results above she concluded that there was a significant difference before and after visual aids. It can be concluded that visual aids was effectiveness to improve students’ achievement in reading comprehension.
4.3
The difference students’ achievement of students in State Junior
High School and MTs Through Visual Aid
[image:67.612.115.489.276.708.2]The experimental groups in this research were taught using visual aids. To find students’ achievement in State Junior High school and MTs, the writer compared the mean both of schools in posttest. Considering the results of the posttest gained by both schools, we could see which class got better achievement.
Table 10. Score Post Test For SMP and Mts
SMP MTs
27 S-27 80 27 T-27 84 28 S-28 92 15 T-28 76 = 2418 = 2274 n1 = 28 n2 = 28
x1 = 86.357 x2 = 81.214
Varians = 51.868 Varians = 30.323
SD = 7.202 SD = 5.507 Range = 22 Range = 22
Max = 96 Max = 92
Min = 72 Min = 68 Mode = 80 Mode = 84
Median = 84 Median = 84
Based on the posttest results of SMP N 2 Sukolilo and MTs Miftahul Fallah Wotan in the table above we could see the differences students’ score in some aspects. First, we analyze the average of both schools. The average of SMP was 86, 36 and for Mts was 81, 21. Varians for SMP was 51, 87 and MTs was 30, 32. Standar deviation for SMP was 7, 2 and for MTs 5,5. Both schools had same range and median. Maximum score for SMP was 96 and minimum score was 72. Maximum score for MTs was 92 and minimum score was 68.
T- TEST DATA OF THE SMP AND MTs POST – TEST
In order to check whether or not the difference between SMP N 2 Sukolilo and MTs Miftahul Fallah Wotan was stastically significant, the t test was used.
Formula
To measure hypothesis using the formula below :
y x Y X 2 2 Y X 1 1 2 x M M
t 1
Where
Average for SMP on posttest ΣX
Mx =
Nx 2418 Mx =
28 = 86, 36
So the mean or average score posttest SMP N was 86, 36.
Standar Deviation SMP
SDx = X
2
- ( X )
2
Nx Nx
= 210212 - (2418)
2
28 28
=
210212 - 208812
28
= 1400.43 28
= 50.0153
= 7.07215
So, standard deviation for SMP in posttest was 7, 07215
Σy My = N
2274 My = 28
= 81,21
The average or mean in posttest for MTs was 81, 21. Standard deviation MTs
SDy = Y
2 - ( y ) 2
Ny Ny
= 185500 - (2274)
2
28 28
= 185500 - 184681
28
= 818.714 28
= 29.2398
= 5.40738
t = 86.36 81.21
50.02 + 29.24 1
+ 1 28 + 28 - 2 28 28
=
5.14
79.3
54 28
=
5.14
0.10483
= 5.14 0.32
= 15.8837
On = 5% with dk = 28 + 28 - 2 = 54 the result t(0.95)(54) = 2.00
\
-2 2.00 15.88
Because t estimation not in the Ho area, so we can conclude that there is significant difference between SMP and MTs
y x Y X 2 2 Y X 1 1 2 x M M
t 1
y
Daerah
From the results above the writer concluded that there was a difference between SMP N 2 Sukolilo and MTs Miftahul Fallah Wotan. She compared the mean both of them Mx > My , mean for SMP was 86, 36 and mean for MTs was 81, 21. She also used the percentage achievement of each group, for SMP 86, 4% and for MTs 81, 2%. To find the significant difference, the writer used t test to measure those data. Because t estimation not in Ho area, so we can conclude that there is a significant dif