UNIVERSITI TEKNIKAL MALAYSIA MELAKA
SIX SIGMA (DMAIC) IMPLEMENTATION IN
INDUSTRY
Report submitted in accordance with the partial requirements of the
Universiti Teknikal Malaysia Melaka for the
Bachelor of Manufacturing Engineering (Manufacturing Management)
Asleeda Binti Ahmad
Faculty of Manufacturing Engineering
UTeM Library (Pind.112007)
b "814
(cz
UNlVERSlTl TEKNIKAL MALAYSIA MELAKA"
-=
JUDUL:
SIX SIGMA DMAlC IMPLEMENTATION IN INDUSTRY
SESl PENGAJIAN:
SEMESTER 2 2007 12008
Saya ASLEEDA BlNTl AHMAD
mengaku membenarkan laporan PSM I tesis (SarjanaIDoktor Falsafah) ini disimpan di Perpustakaan Universiti Teknikal Malaysia Melaka (UTeM) dengan syarat-syarat kegunaan seperti berikut:
I.
Laporan PSM 1 tesis adalah hak milik Universiti Teknikal Malaysia Melaka dan penulis.2. Perpustakaan Universiti Teknikal Malaysia Melaka dibenarkan membuat salinan
untuk tujuan pengajian sahaja dengan izin penulis.
3. Perpustakaan dibenarkan membuat salinan laporan PSM I tesis ini sebagai bahan
pertukaran antara institusi pengajian tinggi. 4. *Sila tandakan
( 4 )
(Mengandungi maklumat yang berdarjah keselamatan atau SULIT kepentingan Malaysia yang terrnaktub di dalam AKTA RAHSIA
RASMl 1972)
TERHAD (Mengandungi maklumat TERHAD yang telah ditentukan oleh organisasilbadan di mana penyelidikan dijalankan)
TI DAK TERHAD
A
(ASLEEDA BlNTl AHMAD) (EN.NOR AKRAMIN BIN MOHAMAD)*
BLOK AG-4-2
TAMAN TUN SARDON, Cop Rasmi:
11 700 GELUGOR, NOR AKMMlN BIN MOHAMAD PULAU PINANG Pensyarah
Fakultl Kejuruteraan Pembualan Un~vers~t~ Tekntkal Malays~a Melaka
Karung Benunc~ 1206 Ayer Keroh
Tarikh: 05.0 5'm** 73450 Melaka
Tarikh: S / S / a 8
DECLARATION
I hereby, declare this report entitled "Six Sigma (DMAIC) Implementation In Industry is the result of my own research except as cited in the references.
Signature
Author's Name : Asleeda Binti Ahrnad
APPROVAL
This report submitted to the senate of UTeM and has been accepted as partial
fulfillment of the requirements for the degree of Bachelor of Manufacturing Engineering (Manufacturing Management). The members of the supervisory committee are as follow:
Main .Supervisor
Mr. Nor Akrarnin Bin Mohamad NOR AKRAMIN BIN MWAMAD
Censyarah
Fakulti Kejurutenan Pembuatan Uilveniti Teknikal Malaysia Melaka
ABSTRACT
This project is providing to explain the Six-Sigma DMAIC (Define, Measure, Analyze, Improve, and Control) methodologies implementation in industry. The focused on
DMAIC method were use as a guideline to design the Six-Sigma. The DMAIC
methodologies were use to reduce scrap cost in one of the electronics company in
Penang. The project were analyze by using
Y=
F (x) factor problem statement. Thisproject covers the importance, benefits, limitations and any related issues that occurred
in Six-Sigma, example; problem statements, objectives, scope of work, project outline,
literature review of previous study and the methodologies and tools are using in this
project. There are five factors were identified contributed to high scrap. The five factors
are Xl(Lacquer splashes), X2 (Glue A & B not mix properly), X3 (Fluxing), X4 (Machine set up for solder paste printing), X5 (Lacquer at the press fit hole). All the data
was obtained fiom several techniques and methodologies. The Minitab 14 software use
to provides the result whether it's significant or not significant after the project run and
get the result in the analyze phase. In addition, based on result, several components of
product was redesign to improve the product to be a quality and reduce higher scrap and
wastage. This project was achieving the target to reduce scrap cost for 65% by using the
ABSTRAK
Projek ini disediakan bagi menerangkan perjalanan kajian terhadap projek yang
berkaitan dengan pelaksanaan "Six-Sigma" menggunakan kaedah "DMAIC (Define,
Meaure, Analyse, hprove,and Control)" dalam industri Tumpuan diberikan kepada
penggunaan kaedah DMAIC sebagai garis panduan kajian berkenaan dengan "Six-
Sigma". Kaedah DMAIC digunakan untuk mengurangkan kadar buangan yang
disebabkan oleh beberapa faktor yang terjadi pada salah satu syarikat elektronik di
Penang Projek ini dianalisa menggunakan formula Y=F(x). Kajian ini meliputi
kepentingan, kebaikan, pembatasan dan berbagai lagi isu-isu yang berkaitan dengan
kadar buangan seperti contoh adalah seperti; penyataan masalah, objektif, skop kerja,
rumusan projek, dm cara kerja serta peralatan yang digunakan bagi projek ini. Terdapat lima faktor yang dikenalpasti menjadi penyebab kepada kadar buangan yang tinggi.
Lima faktor tersebut adalah "Xl(Lacquer splashes), X2 (Glue A & B not mix properly), X3 (Fluxing), X4 (Machine set up for solder paste printing), X5 (Lacquer at the press fit
hole)". Data diperolehi daripada pelbagai teknik dan kaedah untuk projek ini.
Penggunaan perisian Minitab 14 adalah untuk mendapatkan keputusan yang berkaiatan
dengan data yang diperolehi sama ada penting atau tidak sesuatu faktor itu di kaji
dengan lebih mendalam dalam fasa analisis. Daripada data yang diperolehi, sesetengah
komponen yang digunakan juga akan dikaji untuk memperbaiki sesuatu produk tersebut
supaya berkualiti dan mengurangkan kadar buangan yang tinggi. Projek ini telah berjaya
mencapai objektif untuk mengurangkan kadar buangan sebanyak 65% dengan
DEDICATION
Specially dedicated to my beloved mother, Sahir Banun Binti Anor Kassim, my late
father, Ahmad Bin Othman, my fiance Muhamad Jamil Bin Mashdar and who are very concerns, understanding patient and supporting. Also thank you to my supervisors, Mr.
Nor Akramin Bin Moharnad, my brothers, sister and all of my friends. Thanks a lot for
all who was support me in this project and this project will never been achieved without
ACKNOWLEDGMENTS
Firstly of all I would like to thankful to Allah S.W.T that was give me permission to
complete and finish my Final Year Project. Allah have gives me life and chance to do
the job that was given to me. Next, I want to regard my thankful to beloved mother and
my late father and also my family for their support and give me spirit in doing these
jobs. With bless of them, I was complete my report and done the task.
I also would like to acknowledge the advice and guidance to the important person that
was guides me in the report preparation and the project preparation, Mr. Nor Akramin
Bin Mohamad, and Mr. Noor A m i from electronic company. Thanks also to my fellow
friends of BMFU 2004 - 2008 for their help.
The important person that was guides me in the report preparation and the project
preparation, Mr. Nor Akramin Bin Mohamad and my high appreciation to Mr. Noor
Azrni
,
assistant manager from electronic company. Not forget to all lecturers from Faculty of Manufacturing that was give me the knowledge about the engineering field.Lastly, I want send my thankful to all UTeM staff, my friend and all the people that
involved in my thesis and project. Thank you to all for the help and support.
Asleeda Binti Ahrnad
TABLE OF CONTENTS
..
Approval..
...
.ii*..
Declaration.....
iiiAbstract
...
ivAbstrak
...
.vDedication
...
.vi.
.
Acknowledgement...
.viiTable of Contents..
...
.xi. .
List of Figures...
xi1List of Tables
...
.xivList of Abbreviations, Symbols, Specialized Nomenclature..
...
.xv1 .INTRODUCTION..
...
11 .O. Introduction..
...
.11.1. Problem Statements.
...
.2.
.
1.2. Project Objectives.....
31.3. Scope of Project..
...
..41.4. Outline of Study..
...
42. LITERATURE REVIEW
...
62.1 Research Areas in Methods of Quality Improvement..
...
.6- 9 2.1.1 Taguchl s methods..
...
-62.1.2 Shainin System of Statistical Engineering..
...
..72.1.3 TQM and its implementation steps..
...
.82.2 Comparison of Quality Improvement Methodologies..
...
.9. . .
2.3 Research m Six.S~gma
...
12. .
2.4 SIX-Sigma Implementation...
142.5 Level of Six.Sigma
...
142.6 Six-Sigma Deployment Process
...
162.7 Research in Six-Sigma Methodologies Concept
...
182.7.1 DMAIC
...
192.7.2 DMADV
...
-192.8 Research in Six-Sigma's DMAIC Methodology
...
202.9 Summary of Research in Six-Sigma
...
233 METHODOLOGY
...
283.1 Introduction
...
-283.2 Design of Methodology
...
28. .
3.3 The SIX-Sigma programme...
313.4 The Analysis Tollgates of Six.Sigma
...
323.5 DMAIC Implementation in Six.Sigma
...
333.5.1 Phase 1 : Define Phase
...
343.5.2 Phase 2: Measure Phase
...
353.5.3 Phase 3: Analyze Phase
...
353.5.4 Phase 4: Improve Phase
...
36...
3.5.5 Phase 5: Control Phase 36 3.6 The Six-Sigma Tools...
-374 RESULT AND DISCUSSION
...
384.1 Introduction
...
384.2 Root Cause Analysis
...
384.3 DMAIC Methodology
...
39. .
4.3.1.1 Project Defimt~on
...
404.3.1.2 Project Drill Down Tree
...
404.3.1.3 Project Metric- BC Division Scrap Trend
...
414.3.1.4 Scrap Analysis Breakdown Details
...
424.3.1.5 Project Metric- Pareto Chart for Causes versus Count
...
434.3.2 Measure Phase
...
434.3.2.1 Process Mapping
...
444.3.2.2 Key Process Input and Key Process Output Variable
...
454.3.2.3 Cause and Effect Matrix
...
464.3.2.4 Selected Cause and Effect Matrix
...
474.3.3 Analyze Phase
...
474.3.3.1 The Five X-Factor of Problem
...
484.3.3.2 Data Test Using Minitab Software
...
-534.3.3.2.1 Xl- Lacquer Splashes at FCI Connector
...
544.3.3.2.2 X2- Housing Leakage (Glue A and B Not Mix Properly
...
574.3.3.2.3 X3- Flux at FCI Connector Pin
...
634.3.3.2.4 X4- Missprint at Solder Paste Printing
...
-654.3.3.2.4 X5- Lacquer at the Press Fit Pin Hole
...
68...
4.3.3.3 Summary of test Using Minitab 14 Software between X-factor 73...
4.3.4 Improve Phase 77 4.3.4.1 X1 and X3-
Lacquer Splashes at FCI Connector...
784.3.5 Control Phase..
. . .
.
. .
.
. . .
. . . .
.
. . . ... . .
.
. . .
.
. . .
. . .
.
.
.
.
. . .
...
874.3.5.1 SCDC Production Scrap Rate..
.
.
. . . .
.
. . .
. .
. . .
.
. .. . .
.
. .
. .. . .
. . .
. . .
.874.3.5.2 SCDC May Scrap by Model..
.
. .
.
.
.
. . . .
.
.
.
. . .
.
.
. .
.
.
...
.
.
.
.
.
. . . ....
884.4 S m
...
. . .
.
.
.
.
. .
.
.
...
. . .
.
. . .
. .
.
.
. . .
.895. CONCLUSION AND RErOs\/V%fli;X3 4 YEOX. . ; . . . . ; ,
.
;.
. , . ; , ..
, . . , : . ..
, . : ; ; . :. .
; ; ; : a .9fi 5.1. Introduction.,. . .
, , , , , , , . , , , , ,.
, ,.
, ,.
. . . . , . . ..
. . . . . . . . . . . . . . . . . sn 5.2. Conclusion.. . .
.
.
. .
. . .
.
.
. . .
.
.
. . .
. .
.
. . .
.
. .
. . .
.
.
. . .
.
. . .
.
. . .
,.
. . .
. .
,.
.
. . .
.
.
. . .
.9 1 5-3. Recommendation...
.
. . .
.
.
.
. . .
.
. .
.
.
. . .
. .
. .
. . .
.
. . .
,.
,. . .
, ,..
. . .
.
,. . . .. ...,.
93REFERENCES..
. . .
.
. . . .... . .
.
. .
. . .
.
. .
.
. . .
. .
.
.
.
. . .
....
.
. . .
. .
.
.
.
.
. . .
.
. . .
....
94A Key Process Input and Key Process Output Variable
R Cause and Effect Matrix C Failure Mode Effect Analysis
LIST OF FIGURES
Outline of The Project
Flow Chart of Research Methodology
Flow Chart for Six-Sigma Methodology
Project Drill Down Tree
Project Metric
-
BC Division Scrap Trend Pareto ChartPortion of the session window output fiom One-Way ANOVA
Summary for Splashes Factor
Boxplot of Splashes by Factor
Summary of Beforc and After Component A
Portion of the session window output from Test For Equal Variance
Test for equal variances for leakage Comp~nciit A
Portion of the sessi~n window output from Two Sample T
Boxplot of Before and After Component A
Summary of Before and After Component B
Portion of the session window output from Tesr For EquaI Vnriancc
Test for equal variances for leakage Component B
Portion of the session window output from Two Sample
T
B~xpfot cf Before and After Component B Individual value plot for Component A and B
,Dort.iorl ~f the session vVinbovY~ output hn;Test For Equal Variance
Tcst for e p a l variancss for flux staiii
Pertior; af :he se~siol'i -~dl;fido\v output h m One-Way ANOVA
Boxplot of Stain by Pr;rr;rneter
Ps~iorr of +F3e session window? otrtp~t from Test For Equal Variance
Test for equal variances for missprint
Portion of the session window output from One-Way ANOVA
Boxplot of misprint by factor
Scatter Diagram for misprint factor
Summary of Before and After Applied Sticker
Portion of the session window output fiom Test For Equal Variance
Test for equal variances lacquer sipped through
Portion of the session window output from Two Sample T
Boxplot of Before and After Applied Sticker
Individual value plot for Before and After Applied Sticker
Portion of the session window output fiom Two Sample T
Boxplot of After Applied Sticker and modified pallet
Improvement of Lacquer at FCI connector Pin & Fluxing Portion of the session window output from Two Sample T
Portion of the session window output fiom Two Sample T
Boxplot of Flux Before and After
Improvement of Dimension Mixer
Improvement of Mixer Body Hole
Improvement of Pump
Process Capability of Housing Leakage
Process Capability of Missprint at Solder Paste Printing
Improvement of Lacquer at press fit pin hole protection
Improvement of Modification Pallet
Portion of the session window output from Two Sample T
Boxplot of without sticker and applied stickcr
Ponion of the session window output fiom Two Sample T
Boxplot of After Applied Stickcr and modificd gallct
Histogram for production scrap cost
LIST OF TABLES
2.0 Quality Improvement Comparison 2.1 Six-Sigma Road Map
4.0 Scrap Analysis of Scrap and Wastage
4.1 Key Process Input and Output Variable 4.2 Data for Splashes and Factor
LIST OF ABBREVIATIONS, SYMBOLS, SPECIALIZED
NOMENCLATURE
FYP
PSM
DMAIC
DMADV
SE
COPQ
DPMO
DFSS
ANOVA
FMEA
DOE
Final Year Project.
Projek Sarjana Muda
Define, Measure, Analyze, Improve, Control.
Define, Measure, Analyze, Design, Verify.
Statistical Engineering.
Cost of Poor Quality.
Defect per Million Opportunities.
Design For ix-Sigma.
Analysis of Variance.
Failure Modes Effect Analysis.
CHAPTER
1
INTRODUCTION
1.0 Introduction
Six-Sigma is a philosophy, a measure and a metrology that provides business with
the perspective and tools to achieve new levels of performance both in services and
products. In Six-Sigma, the focus is on process improvement to increase capability
and reduce variation. The Six-Sigma methodology aims to reduce the number of
mistakesldefects in a manufacturing process and hence the manufacturing costs.
Sigma is a letter in the Greek alphabet used to denote the standard deviation of a
process. Standard deviation measures the variation or amount of spread about the
process aver-age. Six-Sigma is the ultimate measure of quality (Tom Pyzdek, 1999).
As f m s improve their processes, and move towards the exclusive Six-Sigma, they
often need to redesign the products, process and services to "design-out defects and
design-in quality". In its broadest sense six sigma is a methodology that firms can
use to improve the output quality of a process. Six-Sigma has its roots in the
repetitive processes of manufacturing; however, the same tools can be used in any
business process fiom hiring new people to effective product design and marketing
plans. The foundation of the Six-Sigma programs is statistics; Sigma stands for
standard deviations from the mean of a data set in other words a measure of
variation, while six sigma stands for six standard deviations from the mean. When a
process reaches the six sigma level that process will be running close to perfection,
firms can reduce the amount of variation in a process by removing the causes of
variation therefore increasing the output quality of the process.
Six-Sigma is a part of proactive business strategy that is planned, executive,
monitored, steered towards success, and nurtured by the executive management of
the deployment organization and also provides companies with a series of interventions and statistical tools that can lead to breakthrough profitability and
quantum gains in quality, whether the products of a company are durable goods or
services. There has been a tremendous amount of discussion around defining Six-
Sigma in terms people within your business or organization can understand.
Six-Sigma should not be viewed as a way to achieve one very successfUl project.
Six-Sigma should become a company wide mantra and be implemented as a core part of the companies culture and strategy with training from top to bottom in order to see
the fullness of its benefits. Some examples of companies that have successfully
implemented a six sigma program are (Adam and Gupta, 2002):-
i. GE boasts gains of $2 billion to the bottom line in 1999 and $2.4 billion in
200 1 because of Six-Sigma.
ii. Motorola saved $15 billion in the first 10 years of Six-Sigma implementation.
iii. DuPont realized more than $1.6 billion in cost savings the first four years of
Six-Sigma.
iv. Many other companies and even municipalities have had similar success by
implementing Six-Sigma.
1.1 Problem Statements
Six-Sigma process improvement methodologies have been accepted as the
pioneering process improvement framework. Industry leaders like Raytheon,
Motorola, GE and Honeywell (formerly, Allied Signal) have laid out specific blue
prints for process improvement using this framework. The original Define, Measure,
review by the practitioners and implementers. Every corporation looks at any
possible issue of cost cutting and wise deployment of scarcely available funds. So it
is worthwhile to deliberate on quality improvement example like Six-Sigma, TQM,
Statistical Engineering (SE) and the others. Miss-implementing Six-Sigma can be
extremely damaging to a business because the Six-Sigma often leads to an entire
overhaul of every single process and function within a business, its implementation
impacts all levels and employees. When done it properly, this means that every
employee and process will be used to its fullest potential, creating the highest level of
quality, and leading to the most successful bottom line.
One of the electronic company in Penang facing high scrap problem cost of an
average RM29, 670.22 per month. The focus of this research is on Manufacturing
Cost Effective is one of the main factors for one of the company in Malaysia. Base
on scrap data, overall Body Controller wastage and scrap was RM326, 372.47 from
the period of October '05 to August '06.
1.2 Project Objectives
The objectives of this project are follows:
i. To design a proper method of Six-Sigma (DMAIC) implementation in industry.
ii. To analyze the problem statements using Y=F(x) factor. iii. To solve the possible issue of higher cost because of waste.
1.3 Scope of Project
Six-Sigma are one of the quality improvement methodologies to reduce wastage or
cost. This project is to analyze the problem statement using DMAIC methodologies
to solve the problem. According to the DMAIC methodologies, it will only focus on
factors F (x) that had higher scrap wastage. The possible factor that cause the high
scrap will be identified in DMAIC methodologies and these projects only focus on
significant factors.
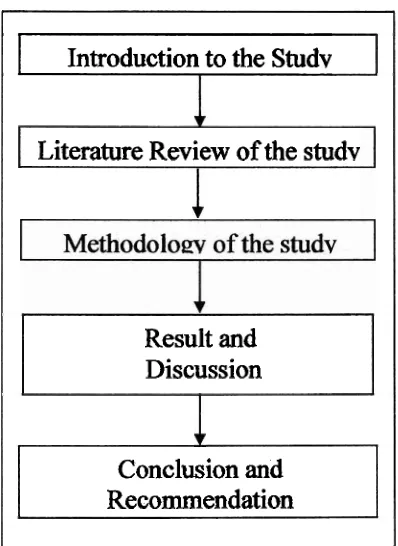
1.4 Outline of Project
The rest of the project's chapters are organized are as follows (summary in figure
1.0):
Chapter 2: Literature Review
Reviews the basic of Six-Sigma implementation in industry theory according to the
journal, books and other resources about the method, barriers, and implementation in
industry.
Chapter 3: Methodology
Review the method of Six-Sigma methodology of DMAIC (Define Phase, Measure
Phase, Analyze Phase, Improve phase and Control Phase).
Chapter 4: Result and Discussion
This chapter will done the data collection, result and discussion of Six Sigma project
to Reduce Scrap Cost for Body Controller Division implementation in electronic
industry in Penang using Y=F(x) factor.
Chapter 5: Conclusion and Recommendation
I
Introduction to the Studv
Literature Review of
the
studv
Result
and
Discussion
[image:21.522.175.374.53.326.2]Conclusion and
Recommendation
CHAPTER
2
LITERATURE
REVIEW
This chapter provides a review of the concept of Six-Sigma implementation in
industry. There are two methods that can apply in Six-Sigma are DMAIC (Define,
Measure, Analyze, Improve and Control) and DMADV (Define, Measure, Analyze,
Design and Verify). This method will also briefly explain in sub topic in this chapter.
Six-Sigma gives us a statistical scale to measure our progress and benchmark others
companies, processes or products. The defect per million opportunities measurement
scale ranges from 0 to 6. The research methodologies of quality improvement fiom
the previous study also will explain in this chapter.
2.1 Research Areas in Methods of Quality Improvement
For this project research there are three methods of quality improvement are done for
comparison.
2.1.1 Taguchi's methods
A Taguchi's method was introduced by the Japanese engineer name Genichi
Taguchi. He had been working on his quality improvement ideas since the 1950s;
his methods were virtually unknown outside of Japan until the 1980s. His techniques
some extent fiom the statistical techniques and vocabulary that are used in traditional quality improvement.
Taguchi discerns between online and offline quality control. Offline quality control
concerns the design (or re-design) of products and processes, and includes the stages
system design, parameter design and tolerance design (Taguchi, 1986, pp. 75-79; see
also Kackar, 1985). Restricted to operational production processes Taguchi's offline
quality control conforms to my definition of quality improvement.
Taguchi invented and promoted various new concepts, such as a quadratic loss
fbnction (Taguchi, 1986). These concepts represent a view on quality in which
variation plays a dominant role. This view on quality is generally accepted (Nair,
1992). Furthermore, Taguchi introduced an alternative experimentation methodology
(using orthogonal arrays; see Ross, 1988). The adequacy of this methodology has
been the subject of much debate among statisticians (Nair, 1992), though it is popular
in engineering (Jugulum and Dichter, 2001). As an operationalization of Taguchi's
methodologies and concepts consider a stepwise strategy described by Ross (1988).
This approach is built around Taguchi's quantitative experimentation methodology.
Taguchi emphasizes the importance of variation reduction in quality improvement.
Based on the results of an experiment, settings for the control variables are chosen
such that the process is made robust against variation in the nuisance variables. Next,
the process mean is brought on target by manipulation of control variables that affect
the mean but not the variation. Finally, tolerance design is exploited if needed to
accomplish a further reduction in variation.
2.1.2 Shainin System of Statistical Engineering
Dorian Shainin is the introducer for Shainin system. She was put several techniques
both known and newly invented in a coherent stepwise strategy for problem solving
statistical engineering. The system is described in various papers (Shainin, P., 1993;
Shainin, R., 1993). Part of the strategy is promoted by Bhote (1991). Starting from a
problem in the output of a process, the objective of the strategy is to select the one,
two or three dominant causes of variation (called the Red X, Pink X and Pale Pink X,
respectively) from all possible causes. This is achieved by a "homing in" method;
using statistical analysis tools, the classes of causes in which the important causes are
likely to be found are selected, thus zooming in on the Red X. Once the Red X is
identified, either an irreversible corrective action is taken, or the tolerances on the
Red X are tightened and controlled.
The Shainin system is built around a set of tools that are plainly understood and
easily applied, hereby refraining fiom more advanced techniques. The theory is
clarified using a clear vocabulary (featuring concepts as "Red X" and "homing in
strategy") because of its simplicity and the integration of tools the system appeals to
persons with a technical background and limited knowledge of statistics.
2.1.3 TQM and its implementation steps
According to Juran and Grayna (1993), emphasis on customer satisfaction, broad
application of quality concepts, and participation of all employees has given rise to a
new title TQM. TQM is an approach to improving the competitiveness, effectiveness
and flexibility of a whole organization. It is essentially a way of planning, organizing
and understanding each activity. The philosophy of TQM, in the words of Bates
(1993), recognizes that customer satisfaction; business objective, safety and
environmental considerations are mutually dependent and applicable in any
organization. According to Barclay (1993), the impact of TQM on any organization
is, first, to ensure that the management adopts a strategic view of quality.
Eight points that guide implementation of TQM are:
1. The organization needs long-term commitment to constant improvement