DISTRIBUTED CONTROL MONITORING SYSTEM USING
CONTROLLER AREA NETWORK
Ahmad Fairuz Muhammad Amin
1,a*, Ishak b Aris
2,b1 Faculty of Electrical Engineering, Universiti Teknikal Malaysia Melaka, Hang Tuah Jaya 76100 Durian Tunggal,
Melaka, Malaysia. aEmail: ahmadfairuz@utem.edu.my
2 Department of Electrical and Electronic Engineering, Faculty of Engineering, Universiti Putra Malaysia, Serdang
43400, Malaysia. bEmail: ishakaris @eng.upm.edu.my
Abstract— Network-based systems are widely used in many application areas such as intelligent systems and distributed systems. To design distributed systems, distributed information processing and intelligent terminals are required. This system can be integrated efficiently into the present automation management network system. This paper presents the development of distributed network control system based on Controller Area Network (CAN). The system includes three micro controller based boards with PIC18F458 with Analog-to-Digital (ADC) interface for analog measurement. The first board use a ADC input sensor for revolution per minute (RPM) calculation of motor, while the second board uses to capture temperature and the third board which connects to PC for Graphical User Interface (GUI) display for monitoring system. The three boards communicate via the existing data communications network. These micro controller based hardware devices are driven by programs written in the C programming language, while LabVIEW provides the user-control interface. This paper will present the methodology, design approach and results of the online monitoring system.
Keywords - Controller Area Network (CAN), RPM Microcontroller, LabVIEW
I. INTRODUCTION
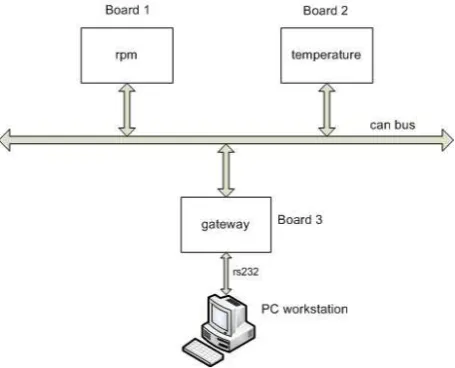
This system comprises three boards which contain micro controller based for RPM and temperature measurement respectively and the third board acts as a gateway which connects to the PC that simulate the GUI display as shown in Figure 1. These two parts communicate through a CAN bus. The micro controller chips run programs written in the C programming language. The second board communicates with the PC through a RS232 serial bus. A graphical user interface (GUI) simulates the dashboard of a vehicle using program written in LabVIEW.
The CAN protocol was developed by Bosch in the 1980’s, and the CAN network is widely applied in many automation industries, particularly in the automotive industry [1, 9]. It is an advanced serial communication bus system with a transmission speed from several Kb/s to 1Mb/s, depending on the physical bus length. CAN
efficiently supports distributed real time control with a high level of security[2].
Figure 1: CAN communication system
A CAN port is a two-wire, half-duplex, high-speed network system that can reach up to 1 Mbit/s. The implementation of CAN is based on peer-to-peer and broadcast communication functions. CAN is protocol for short messages with 0 to 8 bytes. The CAN specification [3, 4] defines protocols for the physical and data link layers, which enable communication between the network modes.
17 Dec 2012
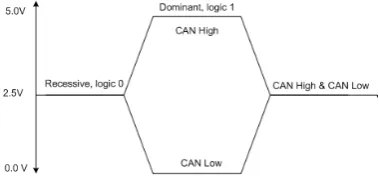
Figure 2: Physical CAN voltage levels
There are two popular CAN specifications[3], CAN 2.0A, standard CAN, using 11 bits for node identification and the other standard is CAN 2.0B or extended CAN, using 29 bits for node identification. For CAN 2.0A allows 2048 unique identifiers (211), while CAN 2.0B has 29 bits identifier provide 537 million unique identifiers (229)[6] as shown in Table 1. The employment of this existing date communications network in this design enables the system to integrate efficiently with the current management network system.
Table 1: CAN Versions [7]
In this project, the infra red is used to calculate of a motor RPM unit and a sensor LM35 to measure the temperature which is the inputs for Capture/Compare/PWM (CCP) and ADC ports respectively of micro controller Board 1 and Board 2. The micro controller chip, PIC18F458, has a built-in CAN controller and controls the sensor. The third board, Board 3, consists of a PIC18F458 micro controller chip, and a RS 232 driver chip (MAX 233), which drives the RS 232 communications between the board and the PC. The LabVIEW programming language, which was developed by National Instrument Co.(NI), is applied to create a GUI for controlling the whole system in the PC. The reason for using LabVIEW in the design is that it is a graphical programming language that is easy to design and is widely used in industry. In LabVIEW, a user interface (Front Panel) is built using the Controls Palette, which includes a set of tools and objects, and the Block Diagram, which contains the codes to control the Front Panel objects. This is built using the Functions Palette that includes the graphical representations of the Front Panel objects.
II. SYSTEM DESIGN
The block structure diagram of this design is shown in Figure 2. Board 1, is a revolution per minute (RPM)
module, and Board 2 is temperature module. Both boards communicates to Board 3 which is a gateway from the CAN bus to the PC using RS232 serial communications. The design consists of two parts, the hardware and the software. The design of the system based on the hardware; the micro controller based circuit board designs, and the software; the programs for the micro controller chips, and the GUI in the PC for displaying the test results and for controlling the system.
Figure 2: CAN Bus Monitoring System
A. Micro controller board design
CAN Low and in their inactive state they normally sit at 2.5V. The CAN bus has two states namely CAN High and CAN Low as shown in Figure 2 Dominant state occurs when the CAN High voltage is higher than CAN Low voltage, and Recessive state occurs when CAN High and CAN Low voltage are at the same level [8]
B. Software
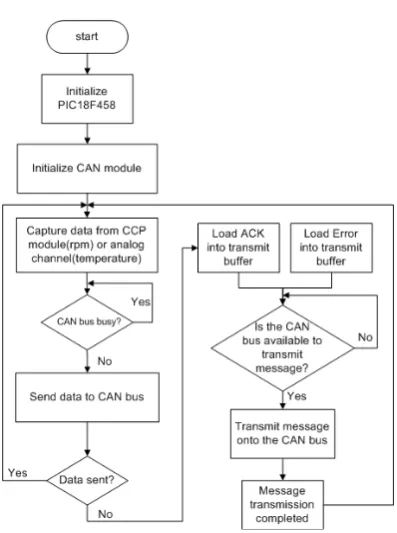
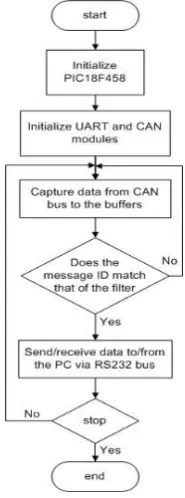
The programs for the PIC18F458 chips are written using CCS PIC micro C compilers. This C complier utilizes a Windows Integrated Development Environment (IDE), which makes the programs easily can be created. A development programmer, PICKit Version 2, is used to program the micro controller chips. The flowchart of the first program, as shown in Figure 5, is for the micro controller chip on Board 1 and Board 2. It initializes the chip, initializes the CAN module, and captures the data from the pins of CCP module for the calculation of the rpm using infrared to dc motor. For Board 1, the IR circuit outputs pulses whenever it is interrupted (this type of IR circuit is also known as a 'photo-interruptor' circuit). The microcontroller will stand by waiting to see the rising edge of one of these pulses as shown in Figure 3.Anytime a rising edge is detected the PIC will interrupt the current software and run a special subroutine to take note that the change on the signal occurred. This subroutine calculates the rpm based on the number of rising edge of the pulses. The RPM can be found using equation 1. The RPM data are sent to the Board 3 via the CAN controller and CAN transceiver. For Board 2, the temperature data is collected by temperature sensor, LM35, and is given by 10mV/oC. Thus, for example, at 20oC the output voltage is 200 mV. The flowchart of the program for Board 3 is shown in Figure 6. This program initializes the chip, captures the data from CAN bus to the buffers, initializes the UART module, and sends/receives the data to the PC via the RS 232 driver.
period is a duration of complete one cycle a isclock cycles to execute single instruction b is number of blades of fan
rising edges
Figure 3: Output pulse from infra red for RPM measurement
Figure 5: Flow Chart of the program for micro controller chip for Board 1 and Board 2
17 Dec 2012
Figure 6: Flowchart of the program for Board 3
Figure 7: Part of the Block Diagram of the LabView program
III. RESULTS
To verify the data received is correct, a CAN bus monitoring system, a NI-CAN Bus Monitor (NBM) is used and hardware NI-CAN USB 8473s is connected to the CAN bus. The speed used for this test is 1.0 Mbits which also apply to Board 1, Board 2 and Board 3. In this setup, NBM monitors all the data received from the CAN bus and the result is displayed as shown in Figure 8.
Figure 8: NI-CAN Bus Monitoring System
There are three IDs 0x302, 0x204 and 0x202 which represent Board 1, Board 2 and Board 3 identifiers (IDs) respectively. From the Figure 7, the data received is in hexadecimal number, is extracted Lab View programming and the data displayed in GUI, usi. For example, the data from the Board 2 with ID 0x204 is 60 02, is arranged as 0206, which the first byte is the lowest byte value and followed by next higher byte value. These bytes are converted to decimal number which is the value is 59.5oC as shown in Figure 9.
Figure 9: From Panel of the LabView program
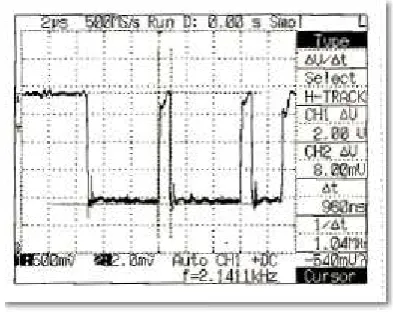
Figure 9: CAN Measurement using digital oscilloscope
IV. CONCLUSION
Controller Area Network, like any field-bus system that is based on serial communication, will reduce wiring, which was originally considered only as an advantageous side effect. CAN supports all the requirements such as real-time behaviour, simple protocol and short messages for automotive and automation applications. The paper presents the CAN data successfully extracted from the CAN bus and display in GUI in PC. This data can be to establish the reliable route for messages to take in order to reach its destination. This project can be extended using more nodes that can be distributed to monitor and control others sensors or actuators which extensively being used in vehicle communication and manufacturing plant.
ACKNOWLEDGMENT
The authors wish to thank to the staff of Institute of Advanced Technology, Universiti Putra Malaysia for providing the facilities and resources to complete the above project successfully.
V. REFERENCES
[1] CiA, "CAN in Automation (CiA): Controller Area Network (CAN)," 2008.
[2] Gergeleit, M. Streich, H., "Implementing a distributed
high-resolution real-time clock using the can bus," in 1st international
CAN-conference, Mainz, Germany, 1994.
[3] Robert Bosch GmbH, “CAN Specification, Ver 2.0 (1991)", [Online]. Available: http://www.can.bosch.com. [Accessed: Jan. 24, 2008]
[4] Craig P. Szydlowski ,Intel Corp, "CAN Specification 2.0: Protocol and Implementations," in Future Transportation
Technology Conference & Exposition Los Angeles, CA, USA:
SAE International, 1992.
[5] W. Stallings, Data & Computer Communications, 6/E Prentice Hall, 2000.
[6] K. Tindell, A. Burns, and A. J. Wellings, "Calculating controller area network (CAN) message response times," Control
Engineering Practice, vol. 3, pp. 1163-1169, 1995.
[7] S. Nilsson, "Controller Area Network - CAN Information." [8] D. Paret, Multiplexed Networks for Embedded Systems: CAN,
LIN, FlexRay, Safe-by-Wire... SAE International, 2007.