ON MODELLING THE AVERAGE SCORES OF
NATIONAL EXAMINATION FOR PUBLIC
SENIOR HIGH SCHOOL IN WEST JAVA
KARIN AMELIA SAFITRI
GRADUATE SCHOOL
BOGOR AGRICULTURAL UNIVERSITY BOGOR
STATEMENT OF ORIGINALITY
The author hereby states that this thesis which is entitled On Modelling the Average Scores of National Examination for Public Senior High School in West Java is based on author’s own research with from supervisors comission and has not been published before. Information source which was either derived or cited from either published or unpublished work from another writer has been mentioned in the text and listed in the bibliography which is the final part of this thesis.
The writer hereby bestows this copyright from this research to Bogor Agricultural University.
Bogor, September 2015
Karin Amelia Safitri
NIM G152130511
RINGKASAN
KARIN AMELIA SAFITRI. Pemodelan Data Rata-Rata Ujian Nasional pada Sekolah Menengah Negeri di Jawa Barat. Dibawah bimbingan oleh ANANG KURNIA dan KHAIRIL ANWAR NOTODIPUTRO.
Pendidikan formal di Indonesia terdiri dari pedidikan pra-sekolah, Sekolah Dasar (SD), Sekolah Menengah (SMP-SMA), dan perguruan tinggi. Pemerintah Indonesia sudah berusaha keras untuk meningkatkan kualitas pendidikan di Indonesia. Peningkatan kualitas pendidikan dapat direpresentasikan dalam bentuk Ujian Nasional (UN) yang diujikan pada siswa.
Penelitian ini dilakukan dengan tujuan untuk melihat faktor apa saja yang mempengaruhi UN dan mendapatkan model yang terbaik. Data yang digunakan pada penelitian ini adalah data panel yang berupa data UN siswa SMA Negeri dari tahun 2011-2014 dan peubah bebas yang digunakan adalah Indeks Pmbangunan Manusia (IPM), Pendapatan Dometik Regional Bruto (PDRB), bahan pembelajaran, proses pembelajaran, tenaga pendidik, fasilitas sekolah, total akreditasi dan rata-rata Ujian Sekolah (US).
Skor rata-rata UN untuk kasus ini tidak bebas dan sangat bervariasi untuk setiap SMA Negeri dan setiap tahun sehingga SMA Negeri dianggap unit individu dan tahun bisa diasumsikan pengaruh tetap dan acak. Sehingga, data pada penelitian ini dimodelkan dengan Linear Mixed Model (LMM), Generalized Estimating Equation (GEE), dan model tetap. Dengan membandingkan nilai R-square, regresi dengan menambahkan pengaruh tetap sekolah dan pengaruh tetap waktu menghasilkan model terbaik dalam menjelaskan keragaman data UN dibandingkan jika dengan GEE dan LMM.
Model dengan efek tetap sekolah dan waktu dengan menambahkan peubah dummy dapat menangkap keragaman dari setiap subjek baik sekolah maupun waktu. Jika sekolah dan waktu diasumsikan sebagai pengaruh acak tidak menghasilkan model yang baik. Begitupula jika tahun mengikuti autoregressive atau AR(1) model yang dihasilkan menghasilkan R-square yang cukup tinggi tetap ada kemungkinan bahwa tahun tidak mengikuti AR(1) tetapi lebih tepatnya sekolah dan waktu diasumsikan sebagai pengaruh tetap. Semua peubah ebas memberikan kontribusinya masing-masing dalam menaikkan skor UN dimana peubah bebas tersebut adalah IPM, PDRB, bahan pembelajaran, proses pembelajaran, tenaga pendidik, fasilitas sekolah, total akreditasi dan rata-rata US.
SUMMARY
KARIN AMELIA SAFITRI. On Modelling the Average Scores of National Examination for Public Senior High School in West Java. Supervised by ANANG KURNIA and KHAIRIL ANWAR NOTODIPUTRO.
Formal education in Indonesia is commonly divided into stages such as preschool, primary school (SD), Secondary School (SMP-SMA), and universities/colleges. Indonesian government has been taking serious efforts on how to improve the quality of education in Indonesia. The roadmap for continous improvement of education quality can be designed based on the results of National Examination (UN) taken regularly by high school students.
This research was aimed at exploring informations on how the scores of
UN can be linked with other explanatory variables and to find the best model. A panel data which consists of average scores of UN for all public senior high schools (SMA Negeri) in West Java Provinces during 2011-2014 and other related variables such as total scores of accreditation, regional domestic product, human development index, scores of school’s facilities and its infrastructure, scores of school’s educators, average scores of final school exams, were used in this research.
The average scores of UN in this case were dependent on variations between high schools and time periods as well as other explanatory variables in which the effects were either fixed or random. The data of this research was modelled with linear mixed models, the Generalized Estimating Equation (GEE), two fixed effects approach. This research showed that by comparing the coefficient of determination, the regression with adding two fixed effects of time and school provided a model of better performance than the GEE and linear mixed model in explaining the variability of the response variable which was the average scores of UN.
A model with fixed effect which used dummy variables had an ability to catch the variability of the subjects in this case the subjects were schools and time, had the highest R-squared value was because time effect is suitable if being assumed to be fixed, not fitted if assumed to be either AR(1) or random effect. All explanatory variables gave its own conribution at increasing the average scores of
UN which is human development index, regional domestic product, the average scores of US and five components of accreditation (the scores of educators, facilities, content, process, and total accreditation.
Key words: fixed effects, GEE, linear mixed model, national examination, random effects.
© IPB Copyright, 2015
Copyright Reserved
Prohibited to quote some or all of this paper without including or mentioning the source. Quoting is only for educational purposes, research, scientific thesis, report writing, criticism, or reviewing an issue; and citations are not detrimental to the interests of IPB
Prohibited to announce and reproduce part or all of this paper in any form without permission IPB
A Thesis submitted to the Graduate School of Bogor Agricultural University
as a partial fullfilment of the requirement for the degree of Master of Science
at
Department of Statistics
ON MODELLING THE AVERAGE SCORES OF
NATIONAL EXAMINATION FOR PUBLIC
SENIOR HIGH SCHOOL IN WEST JAVA
GRADUATE SCHOOL
BOGOR AGRICULTURAL UNIVERSITY BOGOR
2015
ACKNOWLEDGEMENT
All praises and gratitude is only to Allah Subhanahu WaTa’ala for the grace and the blessings He never stops giving so as the writer can accomplish the writing of this thesis which has a title “On Modelling the Average Scores of National Examination for Public Senior High School in West Java”.
The writer also gives best thank to the most awesome advisors, Dr. Anang Kurnia, M.Si and Prof. Dr. Khairil Anwar Notodiputro, M.S who have been helping, critisizing, teaching the writer about everything related to her thesis. Big thank you to the best parents in the world for the prayers, support, encouragement and everything they have been giving to the writer. Thank you too for all the staffs of Applied Statistics Study Program, all of her friends in Statistics for their helping hands and advices.
The writer realizes that the thesis still need critics and opinion for the implementation of the next research in the future. The writer hopes this research will be useful of the scientific work.
Bogor, September 2015
CONTENTS
LIST OF TABLES vi
LIST OF FIGURES vi
LIST OF APPENDICES vi
1 INTRODUCTION 1
Background 1
Research Questions 2
Objectives 3
Research Benefit 3
2 LITERATURE REVIEWS 3
Panel Data 3
Fixed Effect Model 4
Linear Mixed Model 4
Estimation Method 6
Generalized Estimation Equation 7
Sampling Technique 7
3 MATERIALS AND METHODS 9
Data 9
Variables 9
Methodology 10
4 RESULT AND DISCUSSION 12
Principal Component Analysis 14
The Estimated Model 15
Overview of the Best Model 17
Prelimary Analysis of Required Sampling Technique 20
5 CONCLUSION AND RECOMMENDATION 22
Conclusion 22
Recommendation 23
REFERENCES 23
APPENDICES 25
LIST OF TABLES
1 Structures of working correlation matrix 7
2 The descriptive statistics of natinal examination 13 3 Coefficient correlation between response and explanatory variables
for natural science 13
4 Coefficient correlation between response and explanatory variables
for social science 13
10 Parameter estimates for the three selected components of natural
science 17
11 Parameter estimates for the first five components of social science 18 12 Parameter estimates for the two selected components of natural
science 18
13 Number of sampled cluster with different bound of errors 21
14 Variance of average of UN 22
LIST OF FIGURES
1. Scatterplot of the average score of UN versus years for a) natural
science b) social science in West Java 12
2. Normality plots for a) natural science b) social science 19 3. Residual versus predicted value a) natural science b) social science 20
4. Sampling scheme 20
3 Analysis of variance of the five principal component of social science 25 4 Analysis of variance of the two selected principal component of
social science 25
5 Eigen vectors for natural science 26
6 Eigen vectors for social science 26
7 Statistics descriptive of natural science 26
8 Statistics descriptive of social science 26
9 Statistics descriptive of each municipality/regency for natural science
10 Statistics descriptive of each municipality/regency for social science
in 2014 28
11 The formula of Estimated mean of three stage sampling ( stratified sampling – cluster sampling – simple random sampling) 29 12 The formula of Estimated variance of three stage sampling ( stratified
INTRODUCTION
Background
Education plays important roles for the national development. Quality of human resources can be improved through better quality of education continuously. In Indonesia, there are several types of education namely formal, non-formal and informal education which are complemented each other. The level of formal education comprises of elementary education, high school or intermediate education, and higher education. A good quality school must provide quality teaching, curriculum, management, and facilities. The quality of a school can be reflected by the national examination scores and the school examination scores, in Indonesia namely as UN and US, respectively. represent the quality of education mapping itself (Permendikbud No.5). UN
case has been urgently required for this research due to the importance of respresenting the education in Indonesia. Some previous research related to
UN was carried out by Sinaga (2011) analyzed correlation between the scores of UN, US and school grades using canonical analysis. Mongi (2014) also did research about relation between scores of UN and accreditation standards in West Java.
Senior High School which is commonly abbreviated as SMA in Indonesia acknowledged its role in preparing students to continue to the college-level studies. Therefore, This research has analyzed the data of UN
scores all public SMAs in West Java. These SMAs have been referred as observation units. This kind of data is panel data, since the data is a combination of cross sectional data and time series data. Data was taken in four years sequently from 2011-2014.
A linear mixed model is an appropriate approach which has beenused in this research since response variable is normally distributed. Linear mixed model is also well suited for the analysis of panel data, where each time series constitues an individual curve as a cluster. The model accommodates both fixed effects and random effect. The linear mixed model is an extention of linear model for data that are collected in groups. linear mixed model was useful in the analysis of panel data because it has accommodated the correlation of repeated measurements which are made on the same unit, the heterogeneity among subjects, and inference toward certain subjects.
2
Another approach that is used for analysis in this research is Generalized Estimating Equation (GEE). GEE is used to model the correlated data from repeated measure studies (panel data) and basically, it uses quasi-score likelihood for estimating the model parameters. GEE covers the extentions of Generalized Linear Model (GLM) to panel data. Specifically, GEE is a population averaging method that models panel data in which the response is a member of the exponential family of distribution, for example continous, binary, grouped and count data.
It is important to mention this research considered that UN scores can be affected by internal factors as well as external factors. The external factors are the factors within school, education system, and the effect of school policies. Economics condition of each regency/municipality in West Java where the schools are located may affect the quality of education. Hence, it will affect the UN scores of the schools. This economic condition can be measured by the gross regional income per capita (commonly mentioned as PDRB in Indonesia) just like what Ahmad (2011) has stated that the government funds allocated for education sector can affect economic growth or PDRB and vice versa. According to Statistics Indonesia (2008), the growth rate of PDRB also influences human development index which is abbreviated as IPM in Indonesia through household expenditures for daily primary needs including foods, medicines, and school stuffs. The growth rate of PDRB may also influence IPM through domestic expenditure policies made by government including priority funds for social aspects. In contrast, IPM may influence PDRB through qualified human resources in terms of good health and education services.
Another reason why UN is highlighted in this research because of the students pass rate is no longer measured by UN since 2015, due to the change of education system. This is not wise way to spend much money for performing UN every year for every school. On the other hand UN is solely used for measuring things that do not maximally improve the education in Indonesia. Therefore, UN is better to be conducted for some schools as a focused sample to mindmap the education instead of using the population of all schools in Indonesia as measured target. The critical analysis is required as preliminary task to do due to evaluate how the sampling can be applied for UN implementation used for the consideration.
Research Questions
1. What is the best model in modelling between average scores of UN all public SMAs for both natural science major and social science major and other explanatory variables such as IPM, PDRB, average scores of
US, total accreditation scores, educators scores, school facilities scores, teaching content scores, and teaching process scores?
3
Objectives
The main objectives of this study are
1. To develop the best model for modelling between average scores of UN
all public SMAs for both natural science major and social science major and another explanatory variables mentioned above.
2. To evaluate how much do the explanatory variables contribute at affecting the average scores of UN.
Apart from the main objectives mentioned above, this study also has a secondary objective which is to preliminary analyze the possibility of designing samples for evaluating student achievement.
Research Benefit
The best models which is obtained in this research will lead to what influence UN the most. As the first preliminary step to evaluate the process of conducting the UN since there has been provision that UN is no longer used to measure student pass rate.
LITERATURE REVIEWS
Panel Data
A panel data set is one that follows a given sample of individuals over time, and thus provides multiple observations on each individual on the sample (Hsiao 2003). Observing a panel data set is basically observing a broad section of subjects over time, and thus allows us to study dynamic, as well as cross sectional, aspects of a problem (Frees 2004).
Baltagi (2005) mentioned the main advantages of panel data analysis such as.
1. Solves individual heterogeneity.
2. Provides more informative dataset, handles collinearity of variables, controls some types of ommited variables without observing them, obtains degree of freedom in a bigger amount.
3. Studies comprehensively the dynamics of adjustments.
4. Identifies and estimates effects which cannot be taken into traditional technique (e.g. time series analysis and usual linear regression).
5. Reduces bias when estimating because of plenty number observations. Define following general panel data model for observation of cross section data i at time t
4
where is a vector of regression coefficient with K x 1 where K is number of explanatory variables, is a response variable observed for individual quantities were non random. Fixed and random effects to respectively refer to the population average and subject specific effects. Fixed effect model which has form as.
(2) where denoted subject dimension which equals 1, 2, ... N. denoted time dimension which equals 1, 2, ..., T and with specification of residual
where is the number of explanatory variables.
, with is an identity matrix, is a vector. is matrix of dummies which is included in the regression to estimate α if the parameters are assumed to be fixed (Baltagi,2008).
Linear Mixed Model
According to Jiang (2007), linear mixed model takes general form that can be written as
5
Jiang (2007) also stated that estimation in linear mixed model consists of estimation toward both the fixed effect and random effect that can be shown below. Estimation of fixed effect is carried out using Best Linear Unbiased Estimator (BLUE)
̂ (5) and the random effect prediction which is Best Linear Unbiased Prediction (BLUP) can be written as
̃ ( ̂ (6) In fact, variance component V is unknown therefore, in estimating fixed effect and random effect, V is replaced by the estimator ̂ and the estimation result is empirical best linear unbiased predictor (EBLUP)
̂ ̂ ̂ (7) where ̂ and ̂ are estimator using Maximum Likelihood Estimation (MLE) or Restricted Maximum Likelihood (REML).
Jiang (2007) mentioned that the estimation result using REML for variance componen is a consistent estimator without assuming normality from random variable and error. REML is also an estimation method that is more robust and practical.
6
Setting these results to zero will obtain the following equations
{ mixed model are the traditional approach, Maximum Likelihood Estimation (MLE), and Restricted Maximum Likelihood (REML). One of those approaches used for this study is REML.
REML can produce the unbiased or nearly estimator for variance and it does not require more complex computation just like the MLE estimators. Searle (1992) stated that the REML approach is now more preferable to estimate the variance parameters in mixed model.
y is a response vector that normally distributed which is transformed for z = A’y which has distribution z ~ N(0, A’VA). Define a non-zero n x then we come to the final expression of the desity of z
{
( ̂ ( ̂ }
the final density of z leads to the restricted or residual log likelihood which is written below.
7 usually known as generalized estimating equation (GEE). Basically, GEE uses quasi score likelihood theory.
GEE approach in for estimating by using quasi-score likelihood equationwhich is shown as follow
∑ [ ] with [ ] ⁄ dan ⁄ ⁄
is diagonal matrix with element var( ), is working correlation matrix for , and is constant (Dobson 2002). Some general forms of structure of working correlation matrix presented in the Table 1 as follow
Table 1. Structures of working correlation matrix Stuctures obtained by separating the population elements into nonoverlapping groups, called strata, then selecting a simple random sample from each stratum. The principal reasons for using stratified random sampling areas follows:
8
1. Stratification may produce a small bound on the error of estimation. This result is particularly true if measurements within strata are homogenous
2. The cost per observation in the survey may be reduced by stratification of the population elements into convenient groupings 3. Estimates of population parameters may be desired for subgroups of
the population. These subgroups should then be identifiable strata. The first step in the selection of a stratified random sample is to clearly specify the strata then each sampling unit of the population is placed into its appropriate stratum. After the sampling units have been divided into strata, select a simple random sample from each stratum.
Estimator of the population mean is
̅ ∑
̅
where is number of sampling units in stratum i, i = 1, 2, .. L, ̅ denotes the sample mean for the simple random sample selected from stratum i.
Estimator variance of ̅ is
A two stage cluster sample is obtained by first selecting a probability sample of clusters and then selecting a probability sample of elements from each sampled cluster (Scheaffer et al. 2006). Cluster must be as heterogeneous (different) as possible within, and one cluster should look very much like another in order for the economic advantages of cluster sampling to pay off. If a population being divided into nonoverlapping groups of elements. These groups are considered to be clusters, then a simple random sample of groups is selected, and the sampled groups are then subsampled.
The advantages of two stage cluster sampling are
1. A frame listing of all elements in the population may be impossible or costly to obtain, whereas obtaining a list of all clusters may be easy
2. The cost of obtaining the data may be inflated by travel costs if the sampled elements are spread over a large geographic area. Thus, sampling clusters of elements that are physically close together is often economical.
9
population, is the number of clusters selected in a simple random sample, is the number of elements in cluster . is the number of elements selected in a simple random sample from cluster equals ∑ ̅ is the sample mean for the ith cluster ∑ and is the th observation in the sample from the th cluster, is
̂ ( ∑ ̅ ̅
∑ ̅
The estimated variance of is
̂ ̂ ( (
̅ ̅ ∑ (
where
∑ ̅ ̅
and
∑ ( ̅
is simply the sample variance among the terms ̅ and that is the sample variance for the sample selected from cluster .
MATERIALS AND METHODS
Data
1. The average scores of UN and US for both natural science diciplines and social science diciplines of all SMANs in West Java 2011-2014. Data was accessed from Educational Research Center, Ministry of Education and Culture with the lowest score is zero and the highest one is 10 then it is multipled with 10 therefore the score range becomes between 10 and 100.
2. Data of total accreditation scores, educators scores, school facilities scores, teaching content scores, teaching process scores, school management scores, school finance scores, and graduates competence scores were accessed in National Accreditation Institution.
3. Data of human development index and gross regional product in West Java were accessed through Statistics Indonesia website.
Variables
10
Y : The average scores of UN each SMAN for both natural science and social science
X1 : IPM scores each regency/municipality in West Java X2 : PDRB each regency/municipality in West Java X3 : Teaching content scores each SMAN in West Java X4 : Teaching process scores each SMAN in West Java X5 : Educators scores each SMAN in West Java
X6 : School facilities scores each SMAN in West Java X7 : Total accreditation scores each SMAN in West Java X8 : The average scores of US each SMAN in West Java
Research Methodology
This research is divided into two to reach the goals, first is modelling, and the second is sampling technique. Some steps in data analysis process in this research are
Modelling The Data
1. Exploratory data analysis
In this step, the variability and mean of response variable in each regency/municipality in West Java was investigated variable to visualize the information was provided.
2. Identification of the multicollinearity among explanatory variables The multicollinearity was identified by calculating the coefficient of correlation among the explanatory variables. The data was then analyzed using principal component analysis to remove the multicollinearity.
3. Modelling the data with the linear mixed model (LMM)
Models were fitted by incorporating fixed and random effects which accomodated that every school i at time t had their own intercept. The model which contained mixed effect took form as:
̂ ̂ ̂ ̂ , where ̂ is a vector of estimated beginning. In contrast, the time effect is assumed to be random because year can not be limited and there will always be next year therefore the data includes 2011, 2012, 2013 and 2014.
11
dummy variables respectively. The model parameters was estimated using restricted maximum likelihood (REML).
4. Modelling the data with generalized estimating equation (GEE).
̂ ̂ ̂ , where ̂ is the estimated school effect approached to be fixed and this model was estimated using GEE which accomodates the correlated response variable using the working correlation matrix : AR(1) in condition of the time series data which was taken solely covers 4 years. This model is considered because it is able to accomodate the heterogeneity among school effect using dummy variables. GEE model with response variable is normally distributed using identity link function. The working correlation matrix has the following form as shown below assumed to be fixed into the equation took form as
̂
The model parameters were estimated using quasi-score likelihood where the variance of as a function of the mean, contained the working correlation matrix autoregressive.
5. Modelling the data with fixed effects
This model was built with consideration that the numbers of both of schools and time were defined from the beginning. Because of the effects of schools and time were decided to be fixed, it has been added dummy variables into the model which could be written as
̂ ̂ ̂ ̂
where ̂ denoted the estimated school effect and ̂ is the estimated time effect. The model parameters were estimated by using analysis of variance.
6. Evaluation of the models by comparing the R-squared value and mean square error of each model. The model with the largest value is assumed as the best model.
7. Interpretation of the data analysis results.
Sampling Technique
1. Divided population in this case covers West Java into two strata which are city and regency.
2. West Java has 9 cities and 19 regencies in which is considered as population clusterings.
12
B on error of estimation which are in this research 0.05, 0.07, and 0.09, respectively.
4. n was defined, chose element of sampled cluster by using simple random sampling.
5. Making an experiment by taking schools in each cluster with simple random sampling in terms of the characteristics how many schools each municipality/regency has.
6. Calculated the variance of the average scores of UN for each school in each municipality/regency in which there had 6 variances found out with three stages sampling formula which include stratified sampling, cluster sampling, and simple random sampling.
13
RESULT AND DISCUSSION
As it has been commonly acknowledged in Indonesia, there are two programs available in many senior high schools namely natural science and social science. This research has both utilized and analyzed the data of those two different programs separately due to not every senior high schools in West Java has both natural science and social science and it then can not be concluded that students learning ability in natural science is as equal as in social science.
There were two initial models established. Those two models were built based on the data of natural science and social science. Evaluating the model and selecting the best model was done by comparing the R-squared value and mean square error of each model.
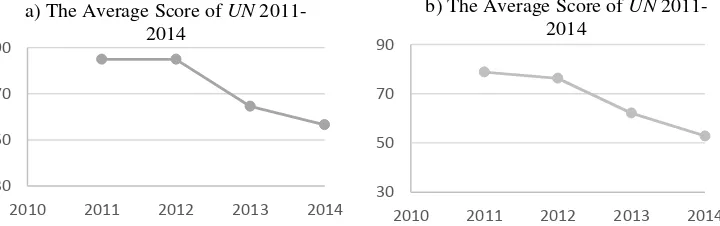
The averages scores of UN every year have been presented in Figure 1.
Figure 1. Scatterplot of the average score of UN versus years for a) natural science b) social science in West Java
The Figure 1 showed that there was such a decline on the slope between year 2012 and 2013. The most current years which are 2013 and 2014, the average scores of UN for natural science has decreased. Sharp slope also happened between year 2012 and 2013 on the plot of social science major.
Another exploration obtained was the mean and variability of the average scores of UN in the very curren year, 2014 for each municipality/regency were also provided in Appendix 9 and Appendix 10. Both of natural and social science, Bandung City has the higest mean of the average scores of UN. Bandung City is one of big cities in Indonesia in which its goverment pays much attention for education there.
The descriptive statistics of the average scores of UN of all public senior high schools in West Java also shown in the Table 2.
14
Table 2. The descriptive statistics of national examination
Term 2011 2012 2013 2014 system of UN, enforced that each task paper has been made exactly different for each student which was implemented since 2013 in order to dismiss every kind of cheating students possibly could do in UN performance.
Another descriptive statistics measured the relationship between response variable and explanatory variable has been statistically illustrated by coefficient correlation shown in the following table.
Table 3. Coefficient correlation between response and explanatory variables for natural science Table 4. Coefficient correlation between response and explanatory variables
for social science
regency/municipality in West Java, X3 : Teaching content scores each SMAN in West Java
X4 : Teaching process scores each SMAN in West Java, X5 : Educators scores each
SMAN in West Java, X6 : School facilities scores each SMAN in West Java, X7 : Total
accreditation scores each SMAN in West Java, X8 : The average scores of US each SMAN in
West Java
15
natural and social science the correlation between Y and X is not very strong.
Another exploration to make sure by calculating variance inflation factor (VIF) to quantify the severity of multicollinearity in an ordinary least squares regression analysis. The following table showed VIF of all X.
Table 5. Variance inflation factor of explanatory variables Predictor VIF there was multicollinearity which could cause a serious problem which make the standard error get higher if it was not removed and would lead to the wrong conclusion for this study.
Principal Component Analysis
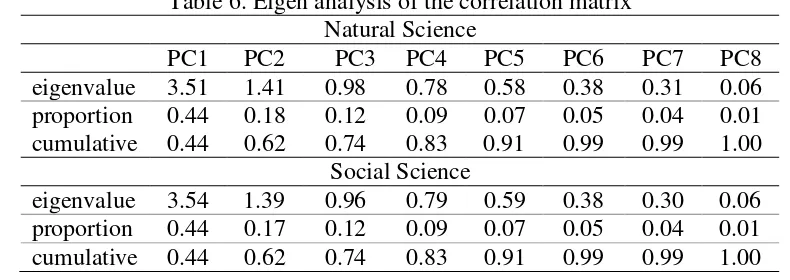
From the result shown Table 5, it is clear that multicollinearity among explanatory variables has been existed. Principal component analysis has been widely used to eliminate the correlation between explanatory variables through transformation which has been presented in Table 5. It then can be ensured that all explanatory variables is independent. Many methods to solve multicollinearity yet principal component analysis has been chosen in order to include all informations in X without eliminating an X that has high VIF value. Table 6 of eigen analysis for both natural and social science is shown below and eigen vectors which was generated shown by Appendix 5 and Appendix 6.
16
Table 6 showed that the cumulative proportions of variance explained by the first five components have shown 0.91 both for natural and social science
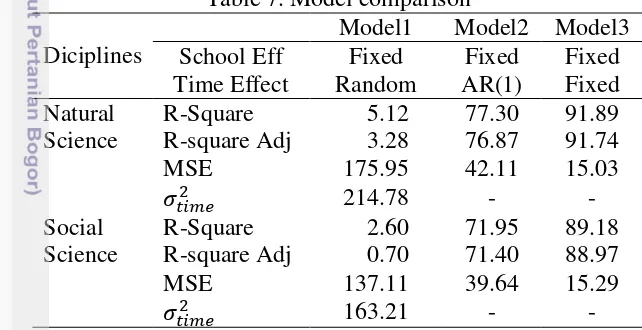
The response (the average scores of UN) is continous variable which was assumed normally distributed.This assumption was justified by the central limit theorem. Here the response variable (the average scores of UN) has been modelled with those five components for each program respectively. Every modelling which has been done in order to find best model gave different results by comparing the value of R-square, R-square adjusted, and mean square error. The Table 7 shows the result of 3 different modellings in the simple version.
Table 7 showed that it was directly identified that the best model was model 3 in which both school effect and time effect were assumed to be fixed with the highest R-squared value, 91,89 for natural science and 89,23 for social science, and with the lowest MSE 15,03.
The data also has been modelled with linear mixed model in Model 1. This model contained two effects, fixed and random effects outright. The response (average scores of UN) is a normally distributed outcome which is allowed to use the linear mixed model. School effectwas assumed to be fixed effect and time effect was assumed to be random effect. This model was not the best model because time should not be random effect. In fact, time was fixed effect because the sequence of year of observed data was defined by the researcher from the beginning.
17
sequence of time which only included 4 years observed data. Therefore it could mean that possibly data of 2014 was not affected by the previous year, data of 2013. It also occured in data of 2013 was not affected by data of 2012 and so forth.
Another plot to see that the best model was a model which was good at predicting. The accuracy at predicting can be presented in a plot between the average scores of UN and its predicted values shown in the following table.
Table 8. Plots of the actual and predicted values in each model
Natural Science Social Science
Modelling with Generalized Estimating Equation
Modelling with Linear Mixed Model
Modelling with Fixed School Effect and Fixed Time Effect
18
around the diagonal line. Both in model 3 for natural science and social science, standardized residual was normally distributed.
Overview of Model 3 (Fixed Effect Model)
Model 3 which had form as ̂ ̂ ̂ ̂ where ̂ is the estimated model parameters, ̂ is the estimated response variable observed for school i at time t, is the vector of principal components for school i
at time t, ̂ is the estimated schools effect, ̂ is the estimated time effect which were assumed to be fixed was ensured because of the numbers of schools and time (the observed years) were both defined and chosen from the beginning by researcher.
Model 3 is a model with fixed effect which used dummy variables had an ability to catch the variability of the subjects in this case the subjects were schools and time, had the highest R-squared value was because time effect more fits if it was assumed to be fixed rather than to be random or AR(1). Beside that, the variance of time ( 2011 – 2014 ) was quite high because there was always modification of system of implementation of UN
globally every year. The model parameters were resulted in the Table 9. Table 9. Parameter estimates for the first five components of natural science
Term Coef SE coef T-Value P-Value which indicated that those were statistically significant. After that, response variable Y was remodelled with and to generate the coefficient regression before transforming back to x.
Table 10. Parameter estimates for the three selected components of natural science
Term Coef SE coef T-Value P-Value
w1 1.79 0.67 2.66 0.01
w3 2.85 0.37 7.74 0.00
w5 -8.25 0.99 -8.31 0.00
Table 10 showed that linier combination of all explanatory variables which were IPM, PDRB, the scores of educators, facilities, content, process, total accreditation and the average scores of US took part at significantly affecting the response variable (the average scores of UN). The resulting equation for natural science took form as
19 explanatory variables is fixed, it could be interpreted that the coefficient of
IPM score (X1) is 2.30 which indicated that the average score of UN is
each change of 1 unit in educators scores’s (X5), Y changes 0.12 unit. The definition of regression coefficient in the school facilities scores (X6) which is 0.15 is the average scores of UN is predicted to increase 0.15 when the school facilities score goes up by one. Of teaching process variable, for each change of 1 unit in total accreditation scores (X7), Y changes 0.20 unit. The average score of UN is also predicted to increase 0.09 when the average score of US (X8) score goes up by one. These two models both for natural science and social science have different intercept for every school i at time
t which was considered as the variability and it were denoted by and . The analysis of variance for natural science is represented in the Appendix 1 and Appendix 2.
Another program the public senior high schools have is social science and resulting the model parameter estimation is shown in Table 11.
Table 11. Parameter estimates for the first five components of social science
Term Coef SE coef T-Value P-Value indicated that those were statistically significant.
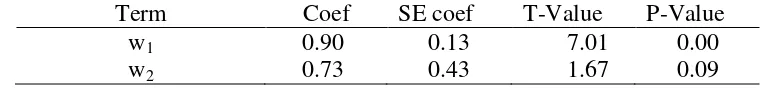
Table 12. Parameter estimates for the two selected components of social science
Term Coef SE coef T-Value P-Value
w1 0.90 0.13 7.01 0.00
20
From table 12 which generated equation using regression with fixed effects was
̂
The equation above was tranformed into the original form by using the formula of mean and standard deviation of each explanatory variable which were reresented in Appendix 8 as
̂
From the resulted equation of social science, the interpretation of regression coefficients in terms of all explanatory variables is fixed is the coefficient of IPM score (X1) is 0.25 which indicated that the average score of UN is predicted to increase 0.25 when IPM score goes up by one. The average score of UN is also predicted to increase 0.05 when PDRB (X2) score goes up by one. The average score of UN is predicted to increase 0.05 when teaching content (X3) goes up by one. Of teaching process variable, for each change of 1 unit in teaching process (X4), Y changes 0.03 unit. For each change of 1 unit in educators scores (X5), Y changes 0.05 unit. The definition of regression coefficient in the school facilities scores (X6) which is 0.03 is the average scores of UN is predicted to increase 0.03 when the school facilities score goes up by one. Of teaching process variable, for each change of 1 unit in total accreditation scores (X7), Y changes 0.07 unit. The average score of UN is also predicted to increase 0.10 when the average score of US (X8) score goes up by one. The analysis of variance for social science can be seen in the Appendix 3 and Appendix 4.
Assesing the residual plots of the best models are needed. The following plot showed the normality of the residuals.
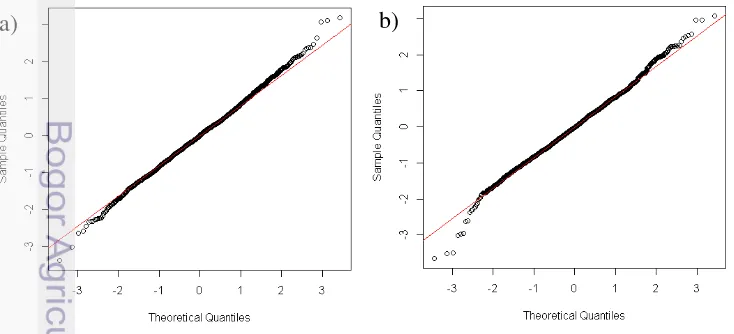
Figure 2. Normality plots for a) natural science b) social science Figure 2 showed that residuals of fixed model for natural science and social science are both normally distributed. The homoscedacity assumption for fixed model is also not violated shown by the Figure 3.
21
Figure 3. Residual versus predicted value for a) natural science b) social science
Since the plot on the Figure 3 can be categorized as well-behaved plot because of the standardized residual points do bounce randomly around the zero line. This suggests that the linearity assumption of relationship between response and principal component scores is not violated.
Preliminary Analysis Of The Required Sampling Method For National Examination
In West Java there are 8 municipalities and 19 regencies in which being consideration for making strata because it is possible there have a significance difference between schools in the municipalities and other schools that are located around regencies. Locations may have probability to differ the output of the schools, in this context, the average scores of UN. Almost all schools in the cities tends to have more sophisticated facilities than schools in regencies which means the higher scores for UN must be reached easily by the schools in the municipalities.
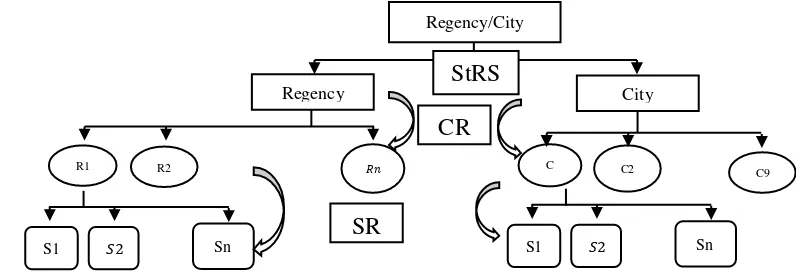
In this sampling technique, the next steps after making two stratas are clustering. To see more about the technique sampling that is used in this research, it is represented by the sampling scheme Figure 4.
Figure 4. Sampling Scheme
Regency/City
City Regency
R1 R2 C
11 C2 C9
S1 Sn
StRS CR
SR
S1 Sn
22
To determine the number of cluster to be sampled is by using the formula (Scheaffer et al. 2006) which is
∑ ∑
where is the fraction of clusters allocated to stratum i, is the population variance for stratum i, and , where B is bound of error.
The writer did an experiment used data of UN 2014 for natural science for example. It has done for thrice replications with three sample sizes of cluster which are obtained by the formula above with three different bound of errors.
The consideration of choosing bound of errors 0.05, 0.07, and 0.09 because if it was taken less than 0.05 the number of cluster would be out of maximum number cluster (27 clusters). If it was taken more than 0.09 the number of cluster would be close to zero. The table 13 showed the number of sampled cluster with different bound of errors.
Table 15. Number of sampled clusters with different bound of errors Bound of errors The number of sampled clusters
0.05
and
0.07
and
0.09
and Clusters are sampled with simple random sampling for clusters from municipality stratum and regency stratum, respectively.
23 number of schools which is sampled with simple random sampling in cluster
j, is number population of clusters (municipality/regency) in stratum k, k is stratum (municipality/regency) =1,2, is number of sampled clusters in stratum k, is the ith observation of schools in the sample from the jth cluster and the kth stratum, i= 1, 2, . . , . The formula derivation of mean and variance of three stages sampling are shown both in Appendix 11 and Appendix 12.
Table 16. Variance of average scores of UN
Number of
24
CONCLUSION AND RECOMMENDATION
CONCLUSION
It was concluded from this research that the UN scores could be modelled using multiple regression approach with fixed effects in which school and time effects that can catch the variability of every subject. This model was used only for analyzing the four years observed data.
For natural science, the scores of PDRB, teaching process, educators, school facilities, total accreditation and the average score of US gave positive contributions when its score goes up by one unit to the average scores of UN. Otherwise, for its change of one unit of the scores of IPM and teaching content gave negative contributions to the average scores of UN . For social science, all explanatory variables gave positive contributions when its score goes up by one unit to the average scores of UN.
RECOMMENDATION
According to the fact that the average scores of UN is getting lower from time to time, the West Java government must pay serious attention to maintain and improve the quality of education. From the best model obtained that the average scores of UN increased along with the increasing scores of teaching content, teaching process, educators and facilities in every school. Moreover, related to human development index (IPM), government should put attention to improve the society life expectancy, mean years of schooling, expected years of schooling, and gross national income and through PDRB government can dispose the fund for education.
For the next implementation of National Examination can be more effective if not all schools in West Java included. Use a three stage sampling technique (Stratified Sampling – Cluster Sampling – Simple Random Sampling) more fits with the condition of all schools in West Java.
REFERENCES
Ahmad A. 2011. Analisis hubungan pengeluaran pendidikan dan pertumbuhan ekonomi dengan menggunakan pendekatan kausalitas Granger. Jurnal Ekonomi & Pendidikan, Volume 8 Nomor 2, November 2011
Baltagi BH. 2005. Econometrics Analysis of Panel Data Ed ke-3. England: John Wiley & Sons Ltd.
[BPS] Badan Pusat Statistik. 2008. Index Pembangunan Manusia 2007-2008. Jakarta : BPS.
25
Aliyah/Sekolah Menengah Atas Luar Biasa dan Sekolah Menengah Kejuruan Tahun Pelajaran 2007/2008. Jakarta : Depdiknas.
Dobson AJ. 2002. An Introduction to Generalized Linear Models. Chapman Hall, London, UK.
Frees EW. 2004. Longitudinal and Panel Data: Analysis and Applications
in the Social Sciences. Cambridge University Press, New York.
Hsiao C. 2003. Analysis of Panel Data (2nd edition). Cambridge University
Press, New York.
Henderson CR, Kempthorne O, Searle SR, Von KCN. 1959. Estimation of environmental and genetic trends from records subject to culling.
Biometrics 15 (2) : 192-218.
Jiang J. 2007. Linear, Generalized Linear Mixed Models and Their Applications. New York : Springer.
Longford NT. 1993. Random Coefficient Models. Oxford: Oxford University Press.
Mongi CE. 2014. Penggerombolan dan pemetaan kabupaten/kota di Provinsi Jawa Barat berdasarkan nilai ujian nasional SMA dan akreditasi sekolah [Tesis]. Bogor (ID): Institut Pertanian Bogor. Rao CR. 1973. Linear Statistical Inference and its Applications. New York:
Wiley.
Searle SR, Casella G, McCulloch CE. 1992. Variance Components. New York: Wiley.
Scheaffer RL, Mendenhall W, Ott RL, Gerow KG. 2006. Elementary Survey Sampling 6th Edition. USA: Thomson Brooks/Cole.
Sinaga SS. 2011. The uses of canonical analysis to know the pattern of relationship among scores of national exam, scores of school exam, and progress report (case study at SMA Budhi Warman II Jakarta) [Tesis]. Bogor (ID): Institut Pertanian Bogor.
26
Appendix 1 Analysis of variance for the five components of natural science
Source DF Adj SS Adj MS F-value P-Value
Appendix 3 Analysis of variance for the five components of social science
Source DF Adj SS Adj MS F-value P-Value
27
Appendix 5 Eigen vectors for natural science
Variables Natural Science Standardized Accreditation 0.52 -0.05 0.01 -0.12 -0.04 Standardized US scores 0.09 0.37 -0.83 0.23 -0.30 Appendix 6 Eigen vectors for social science
Variables Social Science Standardized Accreditation 0.51 -0.06 0.06 -0.11 0.04 Standardized US scores 0.11 0.28 -0.91 0.08 0.28 Appendix 7 Statistic descriptive for natural science
Explanatory Variable Mean Standard Deviation
Total accreditation 89.54 6.39 59.16 98.88
The average scoresof US 83.01 3.02 73.63 94.23 Appendix 8 Statistics descriptive for social science
Explanatory Variable Mean Standard Deviation
Total accreditation 89.57 6.39 59.16 98.88
28
Appendix 9 Statistics descriptive of each municipality/regency for natural science in 2014
Municipality / Regency School Status Mean Min Max Stdev
M. BANDUNG N 41.35 23.65 57.65 4.95
M. BANJAR N 35.51 25.60 50.55 4.68
M. BEKASI N 39.48 25.60 54.65 5.10
M. BOGOR N 42.07 27.65 56.05 4.99
M. CIMAHI N 38.37 25.70 52.60 4.64
M. CIREBON N 36.42 23.65 54.55 4.84
M. DEPOK N 39.43 24.75 55.20 5.53
M. SUKABUMI N 35.93 23.30 51.80 5.01
M. TASIKMALAYA N 36.93 25.60 52.30 5.10
R. BANDUNG N 34.87 24.05 50.80 4.90
R. BANDUNG BARAT N 33.37 22.70 49.95 4.27
R. BEKASI N 33.31 21.55 55.65 4.89
R. BOGOR N 33.87 21.90 51.20 5.22
R. CIAMIS N 33.82 24.65 51.60 4.25
R. CIANJUR N 34.37 24.90 53.20 4.40
R. CIREBON N 32.67 22.80 50.05 4.39
R. GARUT N 32.35 18.55 50.05 4.24
R. INDRAMAYU N 31.59 23.65 50.20 3.44
R. KARAWANG N 30.79 22.75 52.05 3.28
R. KUNINGAN N 33.99 25.00 51.65 4.19
R. MAJALENGKA N 33.29 24.30 51.70 3.86
R. PURWAKARTA N 34.00 23.80 52.15 5.13
R. SUBANG N 30.72 21.50 49.55 4.76
R. SUKABUMI N 35.06 24.60 54.05 5.41
R. SUMEDANG N 33.16 22.60 53.75 4.12
R. TASIKMALAYA N 33.55 23.65 47.45 4.62
R. PANGANDARAN N 31.31 25.80 43.00 2.94
29
Appendix 10 Statistics descriptive of each municipality/regency for social science in 2014
Municipality / Regency School Status Mean Min Max Stdev
M. BANDUNG N 35.99 21.80 52.70 4.58
M. BANJAR N 33.02 23.95 49.20 4.10
M. BEKASI N 33.82 21.95 52.05 4.73
M. BOGOR N 39.33 25.40 54.30 5.23
M. CIMAHI N 33.43 23.85 50.65 4.53
M. CIREBON N 32.07 19.90 49.95 4.39
M. DEPOK N 35.74 21.20 54.95 6.60
M. SUKABUMI N 31.35 21.75 48.60 4.45
M. TASIKMALAYA N 32.51 22.25 49.45 4.41
R. BANDUNG N 32.26 20.60 49.15 4.17
R. BANDUNG BARAT N 30.89 22.80 51.25 3.86
R. BEKASI N 30.02 21.80 52.05 4.22
R. BOGOR N 31.27 19.65 49.55 5.09
R. CIAMIS N 31.62 21.30 48.60 3.94
R. CIANJUR N 32.23 23.20 48.45 4.55
R. CIREBON N 30.20 20.65 50.00 3.84
R. GARUT N 29.94 22.20 49.80 3.80
R. INDRAMAYU N 30.08 19.15 48.80 3.74
R. KARAWANG N 29.05 22.00 47.95 3.34
R. KUNINGAN N 32.30 22.85 52.15 4.19
R. MAJALENGKA N 31.42 22.50 46.70 4.03
R. PURWAKARTA N 31.27 23.15 49.45 4.31
R. SUBANG N 28.38 21.30 50.15 4.05
R. SUKABUMI N 33.01 22.35 51.55 5.52
R. SUMEDANG N 31.01 22.40 47.35 3.79
R. TASIKMALAYA N 31.28 21.95 44.70 4.42
R. PANGANDARAN N 29.22 22.50 42.90 2.88
31
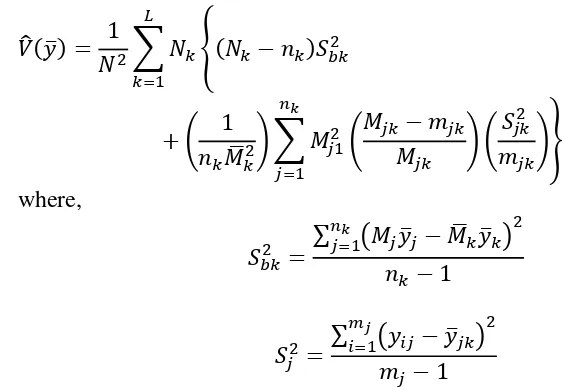
Appendix 12 The formula of estimated variance of three stage sampling (stratified sampling – cluster sampling – simple random sampling)
̂ ̅ [ ̂ ̅ ̂ ̅ ]
Estimated variance of ̅ from two stages cluster sampling in strata 1
32
BIOGRAPHY