DETERMINANTS OF INDONESIA’S MANUFACTURING
EXPORT: A PANEL DATA ANALYSIS
AHMAD SOHIBIL KAHFI
POSTGRADUATE SCHOOL
BOGOR AGRICULTURAL UNIVERSITY BOGOR
iii
STATUTORY DECLARATION
I, Ahmad Sohibil Kahfi, hereby declare that the master thesis entitled ‘Determinants of Indonesia’s Manufacturing Export: A Panel Data Analysis’ is my original work under the supervision of Advisory Committee and has not been submitted in any form and to another higher education institution. This thesis is submitted independently without having used any other source or means stated therein. Any source of information already stated in the part of reference of this thesis. Herewith I passed the thesis copyright to Bogor Agricultural University
Bogor, Januari 2016
iv
RINGKASAN
Ahmad Sohibil Kahfi. Faktor Penentu Ekspor Manufaktur di Indonesia: Analisis Data
Panel. Dibimbing oleh NOER AZAM ACHSANI dan FLORIAN PLOECKL.
Nilai ekspor Indonesia terus mengalami penurunan sejak 2012. Masalah ini
menarik perhatian pemerintah Indonesia untuk segera diselesaikan dengan cara
meningkatkan performa ekspor total. Salah satu sektor yang dapat ditingkatkan adalah
sektor manufaktur. Namun pada 2014, kontribusi dari sektor manufaktur terhadap nilai
ekspor total Indonesia hanya sebesar kurang lebih 40%, dimana kontribusi tersebut harus
ditingkatkan untuk memenuhi permintaan dunia terhadap produk manufaktur. Tujuan
dari penelitian ini adalah untuk menganalisis efek dari faktor penentu untuk ekspor
manufaktur di Indonesia.
Beberapa faktor utama yang dapat meningkatkan ekspor manufaktur antara lain
adalah nilai tukar rupiah, foreign direct investment (FDI), gross domestic product
(GDP), dan kebijakan perdagangan. Faktor tersebut dianalisis menggunakan regresi data
panel dengan pendekatan random effect model. Hasil dari analisis menunjukkan bahwa
perubahan relative dari nilai tukar, foreign GDP, jarak antara dua negara, dan tariff
secara signifikan mempengaruhi ekspor manufaktur di Indonesia.
Berdasarkan hasil penelitian, terdapat beberapa rekomendasi untuk pemerintah
Indonesia untuk meningkatkan performa ekspor manufaktur. Rekomendasi pertama
adalah dengan menjaga ekspor Indonesia ke negara-negara besar dan dengan
memperluas pasar ekspor Indonesia ke negara lain. Rekomendasi kedua adalah dengan
menjaga stabilitas nilai tukar rupiah dan mendukung industry local untuk menggunakan
teknologi yang lebih maju. Kemudian, dengan mendukung penyederhanaan proses
import melalui system satu atap dan mengefektifkan penerapan tariff melalui negosiasi
FTA.
Kata kunci: produk manufaktur, ekspor, nilai tukar, FDI, foreign GDP, kebijakan
v
SUMMARY
Ahmad Sohibil Kahfi. The Determinants of Indonesia’s Manufacturing Export: A Panel Data Analysis. Under supervision of NOER AZAM ACHSANI and FLORIAN PLOECKL.
Indonesia’s export value has been decreasing since 2012. This raised government concern to address this issue by increasing total export performance. One sector that can
be improved in this strategy is the manufacturing sector. In 2014, the contribution of manufacturing sector to Indonesia’s total export value was only about 40% which should be increased to fulfill global manufacturing products’ demand. The aim of this study is to analyse the impact of determinant factors on Indonesia’s manufacturing export.
Factors that can support Indonesia’s manufacturing export include the exchange rate, foreign direct investment (FDI), gross domestic product (GDP) and trade policies.
The factors are examined using panel data regression with a random effect model. The
results reveal that relative change of exchange rate, foreign GDP, distance between two countries and average tariffs significantly affect Indonesia’s manufacturing export.
Based on the results, there are recommendations for Indonesian government to
increase its manufacturing export performance. First recommendation is to maintain Indonesia’s export to rich countries and to diversify its export market. Secondly, to stabilise the rupiah exchange rate and to encourage industries to use more advanced
technologies. Next is to suggest simplification of import processes by promoting a
national single window system and tariffs improvement through FTA negotiation.
Keywords: Manufactures, export, exchange rate, FDI, foreign GDP, trade policies, panel
vi
©Copyright belongs to IPB, 2016
All rights Reserved Law
Prohibited quoting part or all of this paper without including or mentioning the source. The quotation is only for educational purposes, research, scientific
writing, preparation of reports, writing criticism, or review an issue; and citations are not detrimental to the interest of IPB.
vii
DETERMINANTS OF INDONESIA’S MANUFACTURING
EXPORT: A PANEL DATA ANALYSIS
AHMAD SOHIBIL KAHFI
Master Thesis
As a requirement to obtain a degree Master of Science in
Economics Program
POSTGRADUATE SCHOOL
BOGOR AGRICULTURAL UNIVERSITY
BOGOR
viii
ix
ACKNOWLEDGEMENT
My greatest gratefulness goes to almighty god, ALLAH SWT, who provides me
opportunities to study until I complete this dissertation. His guidance supports me to
solve all challenges during my study.
Also, I present my deepest gratitude, for my supervisors, Prof. Noer Azam
Achsani and Dr. Florian Ploeckl. Obviously, they have provided precious knowledge,
ideas, time and all other supports to help me accomplish this dissertation.
Following this, nothing that I can deliver but great thanks for my families,
especially for my parents who continuously pray to ALLAH for my success and my wife
giving her best efforts to support me finish this study.
I also want to thanks to all my colleagues from the University of Adelaide, IPB,
the Ministry of Trade Republic of Indonesia and the south road family. Thanks for
having very pleasant experiences together. I hope our friendship will be long-lasting.
At the end, I would declare that all mistakes in this study are my own.
Bogor, January 2016
xi
Table of Contents
LIST OF TABLES xii
LIST OF FIGURES xii
1. INTRODUCTION 1
2. BACKGROUND 2
The importance of manufacturing for the economy 2
Manufacturing export performance in Indonesia 3
3. LITERATURE REVIEW 4
Exchange Rate 4
Foreign Direct Investment 5
Gross Domestic Product 6
Trade Policies 7
4. METHODOLOGIES AND DATA 8
Methodologies 8
Data 11
5. RESULT 11
Finding the best approach 11
Impact of each determinant 12
6. CONCLUSION 15
REFERENCES 17
APPENDIX 20
xii
LIST OF TABLES
Table 1. Hausman’s test between FEM and REM 11 Table 2. Impact of each determinant on the Indonesia’s manufacturing export (random
effects) 12
LIST OF FIGURES
Figure 1. Indonesia’s total export value and its change from 2004 to 2014 1 Figure 2. Manufacturing export value and total export value in Indonesia from 2004 to
1. INTRODUCTION
In 2011, Indonesia made history by doubling its export value to approximately USD 203 billion over a period of five years from 2006 (Figure 1). Generally,countries take more than five years to double their export value,yet only Indonesia, Belgium, Russia, Switzerland, the United States, and Brazil have successfully achieved this in a five year period, as stated by the former Trade Minister, Gita Wirjawan (Suryanto, 2012).
However, this improvement did not continue in the following year. The economic crisis in 2011 caused export demand from Indonesia’s trading partner countries to decline; consequently Indonesia’s export value fell to USD 190 billion (Sukarno, 2012). Another reason for the decline in export value was the drop in export mining commodities’ prices, as stated by the head of Statistics Indonesia, Suryamin (Syafputri, 2013). The export value, then,dropped consistently in the following years to approximately USD 176 billion in 2014 (Figure 1) (Ministry of Trade, 2015).
Source: Ministry of Trade, 2015
Figure 1. Indonesia’s total export value and its change from 2004 to 2014
To address the decline in export trade, Indonesia’s government, through the Ministry of Trade, established a target which to triple Indonesia’s export value in the five year period from 2014 to 2019. However, the Indonesian government has also introduced a policy prohibiting export of raw materials in order to guarantee natural resource sustainability and develop local industries (Gunawan, 2014). Therefore, in order to meet the target, the government aims to focus on increasing export performance in the manufacturing sector,which has more value added thanprimary products.
As the Ministry of Trade prepares strategies to boost Indonesia’s manufacturing export value, two questions arise which this study aims to answer:
-20
2004 2005 2006 2007 2008 2009 2010 2011 2012 2013 2014
%
2
1. What are factors significantly affect the export performance of the manufacturing sector in Indonesia?
2. How big is the impact of each factor on the export performance of the manufacturing sector in Indonesia?
This study consists of six chapters commencing with the introduction. The second chapter briefly describes the importance of manufacturingand manufacturing export performance in Indonesia. Following this, previous case studies and issues are examined through a review of the literature. The fourth chapter presents the methodology and data for this study, followed by a discussion of the results in chapter five. The final chapter draws conclusionsand offer some recommendations for the future.
2. BACKGROUND
Manufacturing essentially contributes to an economic development. This section concisely explains manufactures’ role on the economy and the manufacturing export performance in Indonesia.
The importance of manufacturing for the economy
In 1960, the term, newly industrializing economies (NIEs) was introduced due to the massive growth of industrialisation in Asia. Indonesia, whose economic growth was about 6 percent a year, joined the NIEs together with Malaysia and Thailand. One specific characteristic of these countries was a huge improvement in exports from the manufacturing sector as industrialisation was integrated into international trade (Trade and Development Report, 1996). Therefore, it is important for a country to develop manufacturing export performance by diversifying export from natural-based to manufacturing-based to support economic growth.
3
Manufacturing export performance in Indonesia
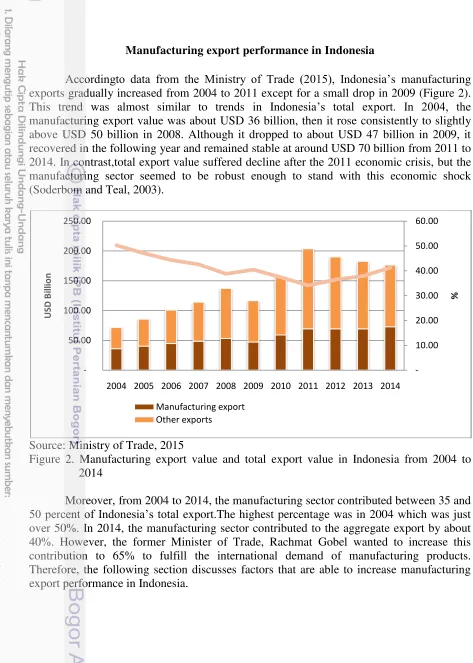
Accordingto data from the Ministry of Trade (2015), Indonesia’s manufacturing exports gradually increased from 2004 to 2011 except for a small drop in 2009 (Figure 2). This trend was almost similar to trends in Indonesia’s total export. In 2004, the manufacturing export value was about USD 36 billion, then it rose consistently to slightly above USD 50 billion in 2008. Although it dropped to about USD 47 billion in 2009, it recovered in the following year and remained stable at around USD 70 billion from 2011 to 2014. In contrast,total export value suffered decline after the 2011 economic crisis, but the manufacturing sector seemed to be robust enough to stand with this economic shock (Soderbom and Teal, 2003).
Source: Ministry of Trade, 2015
Figure 2. Manufacturing export value and total export value in Indonesia from 2004 to 2014
Moreover, from 2004 to 2014, the manufacturing sector contributed between 35 and 50 percent of Indonesia’s total export.The highest percentage was in 2004 which was just over 50%. In 2014, the manufacturing sector contributed to the aggregate export by about 40%. However, the former Minister of Trade, Rachmat Gobel wanted to increase this contribution to 65% to fulfill the international demand of manufacturing products. Therefore, the following section discusses factors that are able to increase manufacturing export performance in Indonesia.
2004 2005 2006 2007 2008 2009 2010 2011 2012 2013 2014
4
3. LITERATURE REVIEW
Export is products and services produced domestically but sold overseas (Mankiw, 2010). Exporting is one part of international trade activity. A country exports products to the global market when it has excess supply. This means that the export of a country is an excess of domestic supply of goods and services which are produced although its citizen do not consume them (Deliarrnov, 1995). Goldstein and Khan (1985) stated that the export performance of a country is also determined by export demand from other countries. Theoretically, the factors affecting exports performance of a country come from supply and demand.
Exchange Rate
One major factor of export discussed in many research studies is the exchange rate, which is the rate or ratio between two currencies used by people to trade across countries. Depreciation or a decrease in the value of the money of a particular country causes its local products to be cheaper for other countries, which experience an appreciation under these conditions (Mankiw, 2010). Consequently, it increases overseas consumption and raises domestic export demand. However, Krugman, Obstfeld and Melitz (2012) state that this situation requires the Marshall-Lerner condition, in which depreciation can increase export value if export volume is elastic to changes of the exchange rate or the elasticity’s absolute value of export volume to exchange rate changes is more than one.
In the case of Indonesia, Hossain (2009) and Pratikto (2012) both found that the exchange rate significantly affects Indonesia’s export performance, although they adopted different estimations to reach this conclusion. Hossain (2009) used the autoregressive distributed lag (ARDL) bound testing approach to analyse how global income and export prices influenced the Indonesia’s exports from 1975 to 2005. This author found that relative export prices negatively affect Indonesia’s export volume. Following this, Pratikto (2012) examined impact of the real effective exchange rate (REER) on export and import value in Indonesia by using a vector autoregression (VAR) approach. This research revealed that the REER is necessary to explain the volatility of export and import value in Indonesia.
These research contributions made specific recommendations to the Indonesian government. Firstly, Hossain (2009) suggested that appreciation of the rupiah, after the huge depreciation period, explains the slowdown in exports during that period. Therefore, it was recommended that the Indonesian government introduce a policy to maintain the rupiah exchange rate at the optimal level in order to support the increase of Indonesia’s manufacturing export value. On the other hand, Pratikto (2012) stated that the exchange rate is not the sole factor determining export performance by showing that depreciation cannot simply increase the export or reduce the import. Therefore, the exchange rate only cannot be considered as a major factor determining Indonesia’s trade performance, and the Indonesian government should also consider other aspects to improve Indonesia’s export performance.
5
and analysed the data using the Cox PH model. Their results suggest that the exchange rate has a significant effect on China’s manufacturing exports because Chinese industries majorly rely on less advanced technologies. Therefore, China depends much more on cheap price to compete with products from other countries. Appreciation of the Chinese currency (RMB) causes Chinese commodity prices to become more expensive, and consequently, reduces its manufacturing exports. According to this finding, the authors recommended that the Chinese government conducts deeper studies into export markets in developed countries which have more stable and durable economies to ensure Chinese manufacturing export continuity. The authors also suggested that while a stable RMB exchange rate is preferable for Chinese manufacturers, the Chinese government should not interfere with the RMB exchange rate and let the exchange rate depend on the market. Finally, the Chinese government should also encourage innovation and use of advanced technologies to increase competitiveness of Chinese products.
Foreign Direct Investment
The second main factor to be considered in export trade is foreign direct investment (FDI). Tangavelu and Narjoko (2014) explain that such investment comes in the form of capital and transferring technologies, skills, knowledge, and connection. Therefore, FDI can support industries to expand productivity and develop competition among local industries by improving resource allocation more effectively. A practical example of the use of FDI was explained by Vernon (1966) in Denisia (2010). Vernon developed production cycle theory to explain FDI made by the US companies in Western Europe after the second World War in the manufacturing industries. It was begun with production of new innovative products by the US companies for local consumption. Then high demand from Euro of those manufactured products caused the US firms, having the advantage of technology on international competitors, began to export. Then, once the technologies became known, European firms have started imitating American products. Therefore, US companies were forced to perform production facilities on the local markets to maintain their market shares in those areas. This theory managed to explain certain types of investments in Europe Western made by U.S. companies between 1950 and 1970.
There are other benefits of FDI. Ebadi and Ebadi (2015) affirm that FDI can also help domestic industries to improve the product quality due to the recognition of international standards by domestic manufacturing which can increase export opportunities. Furthermore, Kokko (1996) as cited in Tangavelu and Narjoko (2014) explains that FDI causes structural change in the composition of commodities from total exports because of gains in market access and competitiveness.
6
Japan, Italy and Denmark reduced their export performance because the FDI was targeted to only reach the domestic market rather than export.
More recently, Amighini and Sanfilippo (2014) found that investment hinders export improvements. These authors analysed the impact of FDI and other factors on Africa’s export development by modeling export development using variables such as GDP, inflation rate, the exchange rate and FDI. They then estimated their model utilizing a generalized method of moments (GMM) estimator. The results showed that investment to GDP negatively affected manufacturing exports indicating that investment does not allocate effectively to support domestic industries.
In Indonesia, according to Rahmaddi and Ichihasi (2013), over the last 25 years, foreign investment has been dominated by Japanese investment. Japan invested in various industries in Indonesia, such as the metal, machinery, electronic and vehicles industries. This investment caused an increase in Indonesia’s manufacturing exports by more than 20% each year and almost six-fold in total from 1987 to 1996. For this reason, Rahmaddi and Ichihasi (2013) investigated the effects of this investment on Indonesia’s manufacturing exports. The authors defined manufacturing products as those in SITC 5 to SITC 8 and applied panel data regression. The study found that FDI significantly supports manufacturing export growth in Indonesia. More specifically, a one percent addition in FDI in Indonesia supports an almost 0.1% increase in Indonesian manufacturing exports. Furthermore, the authors specified that the industries gaining the most significant benefits from FDI are the metal, machinery and electronic industries as a one percent addition in FDI leads to a 0.25% increase in exports for those industries.
Gross Domestic Product
Gross domestic product (GDP) is the total production and expenditure of goods and services in a country (Mankiw, 2010). Based on Goldstein and Khan (1985), local GDP determines the supply of exports and foreign GDP has an impact on the demand for exports. Furthermore, GDP is also effective in supporting export diversification.
Shao et al (2012) and Rahmaddi and Ichihasi (2013) found that foreign GDP significantly affects a country’s export performance. In particular, Shao et al (2012) found that GDP and GDP per capita of partner countries significantly affect manufacturing exports in China. Manufacturing export duration from China is longer in high GDP countries, indicating that China primarily depends on trading partners with large economies such as the USA and the EU. The authors explained that this condition has not changed even though China’s government has tried to diversify its export markets. According to these findings, the authors recommended that the Chinese government conducts studies about export market in developed countries having more stable and durable economy to ensure Chinese manufacturing export sustainability.
7
Trade Policies
Trade policy is an important instrument for encouraging manufacturer development, particularly under the current trend of trade liberalisation. Generally, trade policies are dividedinto two categories: tariff and non-tariff measures. Tariffs are the most popular policies used to restrict trade. However, global acknowledgment of trade liberalisation has caused countries to reduce the use of tariff instruments. Therefore, another way to restrict trade is through the use of non-tariff measures (NTMs); consequently, the number of countries applying NTMs has increased and its coverage of products has become wider (World Bank and IMF, 2008). Hoekman and Nicita (2011) note that the use of NTMs instruments represents the level of development of a country. A more developed country will apply more NTMs, as evidenced by the high number of developed countries exploiting NTMs.
Akinkugbe (2009) stated that the practices of tariff barriers may hinder export improvement even though upgrading of infrastructure and effective governance can expand export activities. These findings come from examining the effect of trade facilitation in 20 African countries on manufacturing export performance between 1995 and 2004 using a panel data regression method. Similarly, according to Hoekman and Nicita (2011), tariff policies are still widely exerted by poor countries with limited access to the global market. Therefore, they suggest that lowering tariffs can improve a country’s market access.
Free Trade Agreements (FTAs) are a major instrument for countries seeking to expand their market access and raise export value. For this reason, Yang and Zarzoso (2014) and Nguyen (2014) analysed the impact of FTAs on export performance, particularly manufacturing exports. Yang and Zarzoso (2014) investigated the impact of the ASEAN-China Free Trade Agreement (ACFTA) on agricultural and manufacturing trade creation and trade diversion dating from 1995 to 2010. They adopted a panel data gravity equation as their statistical analysis tool. Focusing on the manufacturing sector, they found that the coefficients of FTA in their model were positive and significant. This means that FTA encourages manufacturing export performance of FTA member countries.
Moreover, Nguyen (2014) explored how Japan’s economic partnership agreements (EPAs) affect the export performance of Japan’s partner countries. The EPAs caused Japan to reduce tariff barriers and encouraged Japan to invest in its partner countries. These agreements benefit Japan, particularly in the industrial sector in two ways. Firstly, Japan can benefit from the low labour costs from the developing countries in which it invests. The second advantage is that reducing import tariffs will boost Japanese companies overseas to export to Japan. Therefore, the author suggested that the Japanese government conduct further research into Japanese trade agreements to provide better knowledge of the impacts of its agreements.
8
Moreover, Marks (2015) examined the impact of the ASEAN-China Free Trade Agreement (ACFTA) on Indonesia’s economy by using a simple partial equilibrium simulation. Firstly, This author highlighted that the initial impact of the ACFTA was for each member country to reduce its tariff barriers. Targets for reduction varied between 50% on ‘highly sensitive products’ and zero on ‘normal-track items’. Then, focusing on the bilateral trade between Indonesia and China, based on the author’s estimation, the ACFTA caused China to reduce its import tariffs from Indonesia from 5.1% to 1.1%. This reduction led to an increase in Indonesia’s export value to China by almost $2 billion, mainly from mining and manufacturing such as machinery, vehicles and food.
According to these results, researchers suggest governments of FTA member countries review their trade policies to improve the FTA. They recommend that the FTA should not only focus on reducing tariff barriers but also consider other aspects, such as reaching agreement on product standards and customs process simplification.
To sum up, there are for four main factors discussed in this study, which are the
This section briefly describes the model, approaches and data used in this study. To examine the impact of each determinants of manufacturing export, this study applies a gravity model and analyzes them by using panel data regression with fixed effects and random effects approaches.
Methodologies
According to previous research, one of some methods that is appropriate to determine factors that significantly affect the Indonesia’s manufacturing export performance is a gravity model. This is because the gravity model captures bilateral factors that affect trade such as geographical distance, and other economical factors (Yang and Zarzoso, 2014).
Gravity Model
The gravity model suggests that trade between two countries positively relates to GDP of those countries, but negatively relates to trade barriers between those countries. According to Chunxiang and Mengge (2012), one of the natural trade barriers is distance which represents trade cost. Further distance leads to a higher trade cost which consequently causes less export. Bilateral trade between two countries is formulated as:
= 0( �) 1( �) 2( ) 3(� ) 4 (4.1)
9
country j. � is a vector of other determinants of export between county i and country j(Sheldon, Mishra, and Thompson, 2013). Therefore, to make a regression of these data is different to a regression of a regular cross-section or time-series only. A panel data regression has a double subscript on its variable representing individuals and time series. Baltagi (2008) formulated the model of panel data regression as:
� = + ′ + = 1,…, ; = 1,…,� (4.2)
Where denotes individuals and represents time. Hence, error component, , of this model consists of individual effects that cannot be observed and other disturbance.
= � + (4.3)
Where � shows time-invariant individual effect and shows other interference.
Approaches of the panel data regression include the fixed effect model and the random effect model. The fixed effect model (FEM) considers the individuality of each cross-section unit and let the intercepts differ for each individual ( 1). Yet, this model still assumes that the slope coefficients are constant across individuals. Gujarati (2003) formulated the model as:
= 1 + 2 2 + 3 3 + (4.4)
The intercept 1 has subscript i to show that the intercepts of individuals may be different because of particular characteristics of each individual. However, it has no subscript t to suggest that each individual is time invariant.
Although the random effect model (REM)has the same basic model as FEM,
By combining equation (4.4) and (4.5), the equation becomes (Gujarati, 2003):
= 1+ 2 2 + 3 3 +� +
= 1+ 2 2 + 3 3 + (4.6)
10
The composite error term consists of error from the cross-section (�) and the combination between time series and cross-section error component ( ).
Hausman’s test consequently, it is better to use the FEM approach.
Specification
This paper applies the gravity model as proposed by Sheldon, Mishra, and Thompson (2013) with some more variables are added to the equation.1 After applying a logarithm Where ln( ) is the logarithm of Indonesia’s real manufacturing export value to country j2 in year t, which is ranging from 2005 to 2014.ln � is the logarithm of real GDP of country j in year t. ln � � is the logarithm of real exchange rate against country j in
year t. � �
� �−1
is the ratio of real exchange rate of year t and the prior year representing a
relative change of exchange rate in year t. ln is the logarithm of bilateral distance between Indonesia and country j. ln −1 and ln −1 are the logarithms of the amount of positive total FDI inflows (investment) and the amount of negative total FDI inflows (disinvestment) to Indonesia from country j in year t-1.
1The equation excludes a factor of Indonesia’s GDP, because this study only focuse
s on Indonesia. The use
of time dummies takes up the effect of Indonesia’s GDP changes.
2
11
time dummies to capture particular effects in each year affecting Indonesia’s manufacturing export value.
Data
This study utilises yearly panel data, dating from 2005 to 2014, which consists of 28 countries resulting in a total of 280 observations. Countries, chosen in this study, are the top 28 importing countries in 2014, which contribute approximately 90 percent of the total of Indonesia’s manufacturing exports.
Indonesia’s nominal manufacturing export data are obtained from the Ministry of Trade, Republic of Indonesia. The nominal export data are, then, adjusted to real value by using the export price index with a year base of 2005 obtained from Bank Indonesia’s Producer Prices Indices (2015). Real GDP data in constant USD at 2005 prices, the nominal exchange rate data, population data and data of the import days of each country are sourced from the World Bank’s World Development Indicator (2015). To obtain the real exchange rate, nominal exchange rate data are multiplied by the relative price between two countries represented by the ratio of consumer price index (CPI) of each trading partner and Indonesia (Siregar and Rajan, 2004). The consumer price index is also obtained from the World Bank’s World Development Indicator (2015). Data of nominal FDI inflows to Indonesia are acquired from UNCTAD. According to UNCTAD (2013), these data are on a net basis, therefore, their value each year might be positive representing investment or negative representing disinvestment. There is a problem when these data are transformed to logarithm value. Hence, to address this problem, these data are divided into two variables: investment, consisting of positive value of FDI inflows, and disinvestment, consisting of the absolute value of the negative value of FDI inflows. According to Cavallari and d’Addona(2013), nominal FDI data are scaled by the GDP deflator of each partner country from the World Bank’s World Development Indicator (2015) to obtain real values. Data of distances between each country and Indonesia are from CEPII (2015) and the average tariff data from the World Bank’s WITS (2015).
5. RESULT
Finding the best approach
According to Gujarati (2010), one formal test to find the more appropriate model between FEM and REM is a Hausman’s test. The result of Hausman’s test is presented on Table 1.
Table 1. Hausman’s test between FEM and REM Hausman Test
Statistic d.f Prob.
12
The null hypothesis of the Hausman’s test is difference in coefficients of FEM and REM is systematic. Based on Table 1, p-value for the Chi-square statistic is 0.919 which is greater than = 0.05, therefore the null hypothesis cannot be rejected. This means that coefficients between FEM and REM are not significantly different. Consequently, the more appropriate approach for this study is REM.
Impact of each determinant
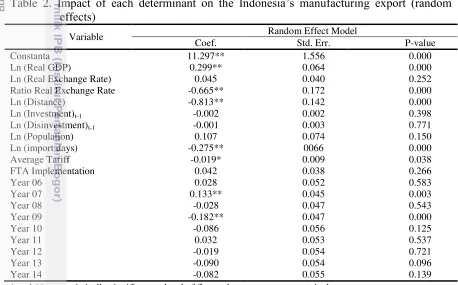
Table 2 shows the result of the panel data regression with random effects estimation of Indonesia’s manufacturing export value. The estimation shows that real foreign GDP, the ratio of real exchange rate, distance, import time and average tariff have a statistically significant effect on Indonesia’s manufacturing export performance. However, results indicate that the coefficients of real exchange rate level, FDI inflows, population and the implementation of FTA are not statistically significant. Hence, those factors cannot be assumed to affect Indonesia’s manufacturing export performance.
Table 2. Impact of each determinant on the Indonesia’s manufacturing export (random
Ratio Real Exchange Rate -0.665** 0.172 0.000
Ln (Distance) -0.813** 0.142 0.000
Ln (Investment)t-1 -0.002 0.002 0.398
Ln (Disinvestment)t-1 -0.001 0.003 0.771
Ln (Population) 0.107 0.074 0.150
Ln (import days) -0.275** 0066 0.000
Average Tariff -0.019* 0.009 0.038
FTA Implementation 0.042 0.038 0.266
Year 06 0.028 0.052 0.583
* and ** are statistically significant at level of five and one per cent, respectively.
13
The coefficient of the ratio of the exchange rate, representing a relative change in the exchange rate, is (-0.655) which is a significant effect on manufacturing export value at the level of 1%. This means that one percent increase in this ratio causes export value decreases by about 0.65%. This indicates that a depreciation of the rupiah will reduce Indonesia’s manufacturing exports. There are, at least, two possible reasons supporting this argument. The first reason is the nominal effect of the rupiah depreciation. It causes Indonesian products to be cheaper for international buyers using other currencies. Therefore, buyers spend less money than before depreciation although they buy the same amount of Indonesian products. As a consequence, the total value of Indonesia’s export significantly decreases. The second reason is that Indonesia’s manufactures rely much on the imported raw material. Rupiah depreciation causes imported raw materials to become more expensive resulting in a reduction of import of raw material for manufacturing. Consequently, manufacturing production falls and its export value decreases.
The coefficient of distance between Indonesia and its partner countries is negative (-0.813) and significant at the level of 1%. This means that Indonesian exports less manufacturing products to countries located at a greater distance. For example, distance between Indonesia and Thailand is two times larger than the distance between Indonesia and Malaysia, therefore, Indonesia’s manufacturing export value to Thailand is expected to be less than its value to Malaysia by about 81% if other factors do not change.
The effect of the number of days for the importing process is negative (-0.275) and significant at the level of 1%. This means that a one percent reduction on importing days causes an increase in manufacturing exports by 0.27%. A practical example of this finding is if Malaysia reduces its average importing days from 10 days to 9 days, Indonesia’s manufacturing export to Malaysia is expected to increase by about 2.7 percent under a condition of no changes in other factors.
The impact of the average import tariff applied by each partner can be seen in the coefficient of the average tariff which is -0.019 and significant at the level of 5%. This means that if the tariff is one percent higher; the export value reduces by about 0.02%. This suggests that higher tariffs lead to lower export value. For instance, if the average import tariffs applied in Malaysia increase from around 5% to about 6%, it is expected that Indonesia’s manufacturing export to Malaysia will fall by 0.02% if all other factors do not change.
On the other hand, FTA implementation does not have significant effect on Indonesia’s manufacturing exports. Although the coefficient of the FTA dummy is positive, this value is not significant at the level of 5%. This indicates that the implementation of the FTA only has an effect through tariffs, which significantly affect manufacturing export.
14
Sanfilippo (2014), the negative relationship between investment and export performance means that either FDI is not allocated efficiently or FDI is targeted to reach only the domestic market and not the export market.
Focusing on time dummies, in which 2005 becomes a year base, based on the estimation, export value in 2007 and 2009 significantly differ from other years. The coefficient of the time dummy in 2007 and 2009 are 0.133 and -0.183 respectively. To know the real effect of the time dummy, it needs a mathematical operation to retransform it from the logarithm form.
15
supported improvement in Indonesia’s manufacturing export performance. The third factor was that in 2007 Indonesia successfully reduced its dependency on the US as Indonesia’s biggest export market. In 2007, the US was still the second largest export market for Indonesia even though its contribution to Indonesia’s non-oil and gas export performance decreased, from about 17% in 2000 to 12% in 2007.At the same time, Indonesia’s export to Malaysia, China and India increased by 48%, 22%, and 21% respectively, which in total, contributed to 22% of Indonesia’s non oil and gas export. This export market diversification seems to be beneficial for Indonesia’s manufacturing export performance by increasing its value. Additionally, the improvement of export performance in 2007 also contributed to economic growth in Indonesia, reaching 6.3 percent which was the highest growth since the 1990s (Bulman report, 2008).
On the other hand, in 2009, Indonesia’s manufacturing exports suffered a significant decrease. This reduction started from the middle of 2008. Based on the Purna report (2009), this reduction was mainly caused by the financial crisis of 2008 which led to a slowdown in the global economy. According to Indonesia economic quarterly report (2009), the highest drops in manufacturing exports were to Japan, Singapore, the US and China. These declines were due to a fall in the prices of Indonesia’s export commodities such as mining products, oil and rubber.
6. CONCLUSION
Indonesia’s total export value has been decreasing since 2012 due to the global economic crisis and the drop of commodity price in 2011. This study, focusing on export in manufacturing sector, is conducted to support the Indonesian government to overcome this problem. By applying panel data regression using random effect approach, this study analyses the impact of export determinants on Indonesia’s manufacturing export performance to the biggest 28 partner countries from 2005 to 2014.
Results of this study show that real foreign GDP and distance between Indonesia and its partner countries have a statistically significant effect on Indonesia’s manufacturing export. Real foreign GDP positively affects manufacturing export, whereas distance negatively affects the export performance. However, Indonesia cannot interfere with these factors, therefore there are no direct policy recommendations that can influence these factors, except to conduct deeper research to understand and maintain Indonesia’s export to rich countries which have a higher export share than other countries. In addition, the government should also consider other countries with which to diversify its export market because if GDP of those countries increase in the future, this will encourage an increase in Indonesia’s manufacturing export. Moreover, this can also minimize the impact of trade shock suffered by partner countries in the future.
16
more advanced technologies to reduce dependency of Indonesia’s export on price competitiveness influenced by the rupiah exchange rate. In regard to import days and average tariffs, the Indonesian government can suggest simplification of import processes by, for example, promoting a national single window system and tariffs improvement through FTA negotiation in order to improve international trade between countries.
17
REFERENCES
Akinkugbe O. 2009.Trade facilitation and Africa’s manufactured goods’ export: a panel data analysis’. Journal of Comparative International Management. 9(2): 77-88. Amighini A, Sanfilippo M. 2014. Impact of south-south FDI and trade on the export
upgrading of African economies. World Development. 64:1-17.
Baltagi BH. 2008. Econometric analysis of panel data. Chichester: John Wiley & Sons Ltd. Bank Indonesia. 2015. Producer Prices Indices. viewed 24 September 2015.
<http://www.bi.go.id/sdds/series/ppi/index_ppi.asp>
Bulman T. 2008. Indonesia: economic and social update. Washington. DC: World Bank. Cavallari L,d’Addona S. 2013. Nominal and real volatility as determinants of FDI. Applied
Economics. 45: 2603-2610.
Centre d’Etudes Prospectives et d’Informations Internationales (CEPII). 2010. Distance.viewed 24 September 2015. <http://www.cepii.fr/anglaisgraph/ bdd/distances.htm>
Chen B. 2014. Trans-Pacific Barriers: a case study of Five Asia-Pacific Developing Countries and Canada. China Economic Journal. 7(2): 251-260.
Chunxiang L, Mengge F. 2012. Influential factors and potential calculation of Zhejiang export based on extended gravity model of trade. International Conference on Information Management, Innovation Management and Industrial Engineering. 2: 388-392.
Corden WM, Neary JP. 1982. Booming sector and de-industrialization in a small open economy. Economic Journal. 92: 825-848.
Coxhead I, Li M. 2008. Prospects for skills-based export growth in a labour-abundant, resource-rich developing economy. Bulletin of Indonesian Economic Studies. 44(2): 209-238.
Deliarrnov. 1995. Pengantar Ekonomi Makro. Jakarta: UI Press.
Denisia V. 2010. Foreign Direct Investment theories: An overview of the main FDI theories. European Journal of Interdisciplinary Studies. 2(2): 104-110.
Ebadi A, Ebadi A. 2015. How the export volume is affected by determinant factors in a developing country?. Research in World Economy. 6(1): 143-150.
Goldstein M,Khan S. 1985. Income and price effects in foreign trade. In Jones R,Kenen P.1985. Handbook of International Economics.vol. II. Amsterdam: North-Holland. Gujarati DN. 2003. Basic econometric. Boston: McGraw Hill.
Gunawan H. 2014. Keran ekspor bahan mentah akan ditutup total.Kontan. viewed 21 September 2015. <http://industri.kontan.co.id/news/keran-ekspor-bahan-mentah-akan-ditutup-total>.
Hoekman B, Nicita A. 2011. Trade policy, trade costs, and developing country trade.World Development. 39(12): 2069-2079.
Horst. T 1972. The industrial composition of U.S. exports and subsidiary sales to the Canadian market. in Rahmaddi R, Ichihashi M. 2013. The role of foreign direct investment in Indonesia’s manufacturing exports. Bulletin of Indonesian Economic Studies. 49(3): 329-354.
18
Hossain AA. 2009. Structural change in the export demand function for Indonesia: estimation, analysis and policy implications. Journal of Policy Modelling. 31(2): 260-271.
Indonesia Economic Quarterly report 2009. The World Bank. viewed 16 October 2015. <http://siteresources.worldbank.org/INTINDONESIA/Resources/Publication/280016-1235115695188/5847179-1243851359474/61647391243851879653/Full.Report.bh. pdf>
Jones R,Kenen P.1985. Handbook of International Economics, vol. II. Amsterdam: North-Holland.
Kokko A. 1996. Productivity spillovers from competition between local firms and foreign affiliates. in Thangavelu SM, Narjoko D. 2014. Human capital, FTAs and foreign direct investment flows into ASEAN.Journal of Asian Economics. 35: 65-76.
Krugman PR, Obstfeld M, Melitz MJ. 2012.International Economics, Theory and Policy, Tenth Edition.Boston: Pearson.
Mankiw NG. 2010.Principles of Economics. Stamford: Cengange Learning.
Marks SV. 2015. The ASEAN-China Free Trade Agreement: political economy in Indonesia. Bulletin of Indonesian Economic Studies. 51(2): 287-306.
Ministry of Trade. 2015. Total balance of trade of Indonesia. viewed 25 August 2015.
<http://www.kemendag.go.id/en/economic-profile/indonesia-export-import/indonesia-trade-balance>
Nguyen XD. 2014. Effect of Japan’s Economic Partnership Agreements on the extensive margin of international trade. The International Trade Journal. 28(2): 169-191. Pain N, Wakelin K. 1998. Export performance and the role of foreign direct investment. In
Rahmaddi R, Ichihashi M. 2013. The role of foreign direct investment in Indonesia’s manufacturing exports. Bulletin of Indonesian Economic Studies. 49(3) 329-354. Pratikto R. 2012. Dynamics of Indonesia’s international trade a VAR approach.Procedia
Economics and Finance. 4: 149-159.
Puma I, Hamidi, Prima. 2009. Perekonomian Indonesia tahun 2008 tengah krisis keuangan global. Jakarta: Ministry of State Secretariat of the Republic of Indonesia.
Rahmaddi R, Ichihashi M. 2013. The role of Foreign Direct Investment in Indonesia’s manufacturing exports. Bulletin of Indonesian Economic Studies. 49(3): 329-354. Shao J, Xu K,Qiu B. 2012. Analysis of Chinese manufacturing export duration. China & performance in the 1990s. Journal of The Japanese and International Economies. 18: 218-240.
Soderbom M, Teal F. 2003. Are manufacturing exports the key to economics success in Africa?. Journal of African Economics. 12(1) 1-29.
19
Suryanto. 2012. Indonesia gandakan ekspor dalam 5 tahun. Antaranews. viewed 21 September 2015 <http://www.antaranews.com/berita/295465/indonesia-gandakan-ekspor-dalam-5-tahun>.
Syafputri E. 2013. Ekspor merosot, impor membengkak tahun 2012. Antaranews. viewed 21 September 2015 <http://www.antaranews.com/berita/356127/ekspor-merosot-impor-membengkak-tahun-2012>.
Thangavelu SM, Narjoko D. 2014. Human capital, FTAs and foreign direct investment flows into ASEAN. Journal of Asian Economics. 35: 65-76.
Trade and Development Report. 1996. United Nations Conference on Trade and Development. viewed 25 August 2015 <http://unctad.org/en/Docs/tdr1996_en.pdf> UNCTAD. 2013. FDI Flows. UNCTAD. viewed 26 September 2015
<http://unctad.org/en/Pages/DIAE/Investment%20and%20Enterprise/FDI_Flows. asx>.
Vernon R. 1966. International investment and international trade in the product cycle. in Denisia V. 2010. Foreign Direct Investment theories: an overview of the main FDI theories. European Journal of Interdisciplinary Studies. 2(2): 104-110.
World Bank. 2015. World Development Indicators. viewed 24 September 2015
<http://databank.worldbank.org/data/reports.aspx?source=world-development-indicators#selectedDimension_WDI_Series>
World Bank. 2015. World Integrated Trade Solution (WITS). The World Trade. viewed 24 September 2015 <http://wits.worldbank.org/WITS/WITS/AdvanceQuery/ TariffAndTradeAnalysis/AdvancedQueryDefinition.aspx?Page=TariffandTradeAnaly sis>
World Bank and IMF. 2008. Global Monitoring Report 2008. Washington DC: World Bank Yang S, Zarzoso IM. 2014. A panel data analysis of trade creation and trade diversion effects: the case of ASEAN-China Free Trade Area. China Economic Review. 29:138-151.
20
APPENDIX
Appendix 1. Indonesia's manufacturing export destination countries in 2014
No. Country
2014
Export Value (USD) Share (%) Cumulative Share (%)
10 PHILIPPINES 2,090,799,442 2.87 62.51
11 UNITED ARAB EMIRATES 2,024,392,466 2.78 65.28
12 NETHERLANDS 1,809,358,565 2.48 67.77
13 SAUDI ARABIA 1,687,168,369 2.32 70.09
14 INDIA 1,608,247,079 2.21 72.29
15 TAIWAN, PROVINCE OF CHINA 1,565,818,799 2.15 74.44
21