DETERMINANTS INFLUENCING THE IMPOSITION OF NON-TARIFF MEASURE AND ITS IMPACT ON INDONESIAN PALM OIL EXPORT: THE CASE OF SPS, TBT AND QUANTITATIVE RESTRICTION MEASURES
YUDHA AJISURYA PRATAMA
POSTGRADUATE SCHOOL
BOGOR AGRICULTURAL UNIVERSITY BOGOR
STATUTORY DECLARATION
I, Yudha Ajisurya Pratama, hereby declare that the master thesis entitled “Determinants Influencing the Imposition of Non-Tariff Measure and Its Impact on Indonesian Palm Oil Export: The Case of SPS, TBT and Quantitative Restriction Measures” is my original work under the supervision of Advisory Committee and has not been submitted in any form and to another higher education institution. This thesis is submitted independently without having used any other source or means stated therein. Any source of information originated from published and unpublished work already stated in the part of references of this thesis. Herewith I passed the thesis copyright to Bogor Agricultural University.
RINGKASAN
YUDHA AJISURYA PRATAMA. Faktor-Faktor yang Mempengaruhi Pengenaan Non-Tariff Measures dan Dampaknya Terhadap Ekspor Minyak Sawit Indonesia Pada Kasus SPS, TBT, dan Quantitative Restriction Measures. Dibimbing oleh BAMBANG JUANDA dan RICHARD POMFRET.
Sejak krisis finansial dunia, penggunaan non-tariff measures (NTMs) dalam perdagangan internasional menjadi lebih sering dan luas digunakan, sementara itu pengaruhnya terhadap perdagangan masih ambigu. Penelitian-penelitian sebelumnya menunjukkan bahwa NTMs dapat meningkatkan atau membatasi perdagangan. Terlebih lagi, pengaruhnya dapat berubah seiring waktu dan berbeda antar partner dagang satu dan lainnya. Kondisi ini menyebabkan studi tentang pengaruh NTMs terhadap komoditas spesifik sangat dibutuhkan untuk mengukur pengaruh aktualnya dalam perdagangan. Mengingat peran penting yang dimiliki oleh industri minyak sawit terhadap sektor ekonomi dan sosial di Indonesia, maka pengaruh dari pengenaan NTMs yang menyimpan ancaman terhadap potensi perkembangan eksport minyak sawit perlu diperhitungkan. Tujuan dari penelitian ini adalah untuk mengukur pengaruh dari faktor-faktor terhadap pengenaan NTMs dalam bentuk sanitary and phytosanitary (SPS), technical barrier to trade (TBT) dan quantitative restriction measures, serta bagaimana pengaruhnya terhadap perdagangan minyak sawit Indonesia.
Model regresi logistik digunakan untuk menganalisis faktor-faktor yang diduga mempengaruhi pengenaan NTMs pada ekspor minyak sawit Indonesia dengan menggunakan data dari 40 negara importir terbesar minyak sawit Indonesia. Sedangkan model gravity digunakan untuk mengukur pengaruh NTMs terhadap ekspor minyak sawit Indonesia pada 23 negara importer terbesar. Hasil dari logistic regression model menunjukan bahwa volume impor minyak sawit pada tahun 2012 dan 2013 serta with GDP dan GDP per kapita negara pengimpor memiliki pengaruh terhadap pengenaan NTMs. Hasil dari gravity model mengindikasikan bahwa SPS dan quantitative restriction measures memiliki pengaruh menghambat eksport kelapa sawit Indonesia, sementara TBT memiliki pengaruh meningkatkan ekspor. Empat rekomendasi kebijakan yang diajukan kepada pemerintah untuk memformulasikan kebijakan yang komprehensif agar dapat secara efektif menangkap peluang dan menghadapi tantangan dalam pasar minyak sawit dunia adalah dengan cara mengembangkan industri hilir produk minyak sawit, membuat peraturan yang mengharuskan penggunaan sertifkasi industry minyak sawit yang berkelanjutan, melakukan penindakan hukum yang lebih ketat, meningkatkan kesadaran lingkungan dari masyarakat.
SUMMARY
YUDHA AJISURYA PRATAMA. Determinants Influencing the Imposition of Non-Tariff Measure and Its Impact on Indonesian Palm Oil Export: The Case of SPS, TBT and Quantitative Restriction Measures. Under Supervision of BAMBANG JUANDA and RICHARD POMFRET.
Since the global financial crisis, the use of non-tariff measures (NTMs) in international trade policy has become more frequent and widely used while their effect on trade is still ambiguous. Previous studies have shown that NTMs can either promote or restrict trade. Furthermore, the impact may potentially change over time or affect various trade partners differently. These conditions make a study of the impact of NTMs on specific trade commodities crucial to measuring their actual impact on trade. Given the significant role that the palm oil industry plays in Indonesian social and economic sectors, the imposition of NTMs may pose a threat to the industry’s growth potential. The objectives of this study are to observe the influence of factors which determine the imposition of NTMs in the forms of sanitary and phytosanitary (SPS), technical barrier to trade (TBT) and quantitative restriction measures, and how these affect palm oil trade.
The logistic regression model was developed to analyse factors influencing the imposition of NTMs on palm oil exports using a dataset of the 40 largest Indonesian palm oil importing countries in 2013. While, the gravity model was developed to measure the impact of NTMs on palm oil exports in 23 largest importing countries. Results of the logistic regression model show that import volumes in 2012 and 2013 along with GDP and GDP per capita are very likely influence the imposition of NTMs in importing countries. Meanwhile, results of the gravity panel model indicate that SPS and quantitative restriction measures have a trade impeding effect on Indonesian palm oil exports, while TBT has a trade promoting effect. Four policy recommendations are proposed to the policy makers to formulate a comprehensive policies to effectively seize opportunities and address challenges in international palm oil market namely promote downstream industries of palm oil products, develop regulations to enforce the use of sustainable palm oil certification, promote more stringent law enforcement, and increase community environmental awareness.
© Copyright belongs to IPB, 2016
All rights Reserved Law
Prohibited quoting part or all of this paper without including or mentioning the source. The quotation is only for educational purposes, research, scientific writing, preparation of reports, writing criticism, or review an issue; and citations are not detrimental to the interest of IPB.
Master Thesis
As a requirement to obtain a degree Master of Science in
Economics Program
POSTGRADUATE SCHOOL
BOGOR AGRICULTURAL UNIVERSITY BOGOR
2016
YUDHA AJISURYA PRATAMA
2
ACKNOWLEDGEMENT
First and foremost, my greatest gratitude goes to Allah SWT, the God Almighty, for His countless blessings and mercies. I would also like to express my immense gratitude to my supervisors, Professor Richard Pomfret and Professor Bambang Juanda, for their idea, worthwhile suggestions, time and patience for assisting me throughout the process of writing this dissertation. I would also like to express my gratitude to all staff at the University of Adelaide, most notably, Athena Kerley, Dr. Florian Ploeckl, Niranjala Seimon, and Augustine Bhaskarraj for their assistance and support throughout my study at The University of Adelaide.
I would also like to acknowledge with thanks to the Ministry of Trade and the Australian Awards Scholarship for providing the sponsorship to undertake my master in Bogor and Adelaide. I also wish to thank the University of Adelaide and Bogor Agricultural University for providing me the chances to pursue my master degree.
I would also like to acknowledge A plus Editing for providing me editorial assistance to improve the quality of my thesis. The editorial intervention was restricted to Standards D and E of the Australian Standards for Editing Practice.
I want to thank all my friends, especially my colleagues from batch 1 and 2 of IPB Kemendag for their support, laugh, and help during this challenging stage of my study.
Finally I would like to thank my parents, younger sister and brother for their support and encouragement throughout the entire process of my study. This dissertation is dedicated to them.
All errors are solely my own.
Bogor, January 2016
6
TABLE OF CONTENTS
LIST OF TABLES vi
LIST OF FIGURES vi
LIST OF APPENDICES vi
1 INTRODUCTION 1
2 BACKGROUND 2
World Palm Oil Market 2
Indonesian Palm Oil Industries 4
Non-Tariff Measures 5
3 LITERATURE REVIEW 6
NTMs, Trade Distortion and Asymmetric Information 6
Previous Studies on NTMs 7
4 METHODOLOGIES AND DATA 8
Logistic Regression Model 9
Gravity Model 10
5 RESULTS AND DISCUSSION 12
Determinants Influencing the Imposition of NTMs on Palm Oil 12
The Impact of NTMs on Export 13
6 CONCLUSION AND POLICY RECOMMENDATIONS 17
Conclusion 17
Policy Recommendations 18
Promote Downstream Industries for Palm Oil Products 18
Increase Community Environmental Awareness 18
Develop Regulations to Enforce the Use of Sustainable Palm Oil
Certification 18
Promote More Stringent Law Enforcement 19
REFERENCES 20
APPENDICES 23
LIST OF TABLES
1 The odds ratio of logistic regression model for determinants influencing
the incidences of NTMs on palm oil 12
2 Regression Results for the impact of NTMs on indonesian palm oil
exports 14
LIST OF FIGURES
1 World vegetable oils consumption 3
2 Price comparison of major vegetable oils 3
3 Indonesian palm oil exports 4
4 Classification of non-tariff measures 5
5 NTMs enforced on Indonesian palm oil 6
LIST OF APPENDICES
1
INTRODUCTION
For more than a decade, globalisation has changed the way the world’s economy develops. Globalisation is a process which make peoples and nations become more interconnected in every way, including economically (Lodge 1995). One of the effects of globalisation in the economic sector is the emergence of trade liberalisation. The fundamental philosophy of trade liberalisation is based on the argument that its implementation will benefit the countries involved and improve their welfare. The action needed to achieve this vision is by diminishing the factors which limit trade flow between trade partners. Several concrete efforts have been made in the form of the establishment of The General Agreement on Tariffs and Trade (GATT) and The World Trade Organisation (WTO) and the world has since seen a decline in tariff and non-tariff barriers imposed on international trade.
However, since the global financial crisis of 2007-08 there has been renewed growing concern regarding the implementation of non-tariff measures (NTMs) on foreign trade. During this period, many countries experienced slow domestic growth and real exchange rate appreciation which led to market power loss and subsequently resulted in reduced competitiveness. Consequently, this also led to the reintroduction of protectionism, notably the use of NTMs, in international trade policies (Bussière and others 2011; Georgiadis and Gräb 2013). The use of NTMs has long been a contentious topic among economists. Many argue that the implementation of NTMs has trade-impeding effects due to the impact on trade costs while others claim that NTMs could also increase trade among countries due to improved mutual understanding of product compliance between trade partners.
As one of the main export commodities in the agricultural sector, palm oil has made an undisputed contribution to Indonesia, not only in enhancing economic growth by maintaining trade surplus and foreign exchange earnings, but also in improving social conditions in the country. According to World Growth (2011), the palm oil industry provides developing countries (DCs) an opportunity to escape from poverty by providing a livelihood for small plantation holders and their workers to improve living standards. This argument is strengthened by Susila (2004) who found that palm oil based-activity alleviated poverty by generating 63 per cent of household income in oil palm plantation communities. However, like other agricultural products, this export commodity has been heavily challenged by the implementation of NTMs.
As compared to other vegetable oils, palm oil is considered the most efficient in terms of yield, land utilisation, supply reliability and is more economical. Palm oil is also used in producing cleaner alternatives to fossil fuel (Mba and others 2015; Monteiro de Carvalho and others 2015; World Growth 2011). However, NTM implementation on palm oil may have a trade hindering effect. Thus, two questions are raised:
1. What are the determinants influencing the imposition of NTMs on palm oil? 2. What are the impacts of NTMs, either SPS, TBT or quantitative restriction,
on Indonesian palm oil exports?
2
Second, the gravity model is used to estimate the influence of determinants predicted to have an impact on Indonesian palm oil exports in 30 largest palm oil importing countries from Indonesia.
This study is structured into six sections beginning with the introduction. The second section provides an overview of the world palm oil market, Indonesian palm oil industries and NTMs. Section three reviews the literature on trade distortion and asymmetric information, and examines previous empirical studies on NTMs. The fourth section discusses the data and methodology. The following section presents and discusses the results, and the final section concludes the study.
2
BACKGROUND
The first part of this chapter highlights the prospect of palm oil in the world market, the following part discusses the conditions for Indonesian palm oil industries, and the last part examines NTMs on palm oil.
World Palm Oil Market
Vegetable oils is a term used to define an oil extracted from plant-based products such as soybeans, oil palm, rapeseed and sunflowers. Besides used as cooking oil, vegetable oil is also found in many food and non-food products.Along with Indonesia, which currently is the largest producer of palm oil, there are several countries which could be considered as major producers of vegetable oils, namely the United States, India and China which all produce soybean, rapeseed and sunflower oil, and the European Union (EU) which produces rapeseed and sunflower oil, and Malaysia which produces palm oil.
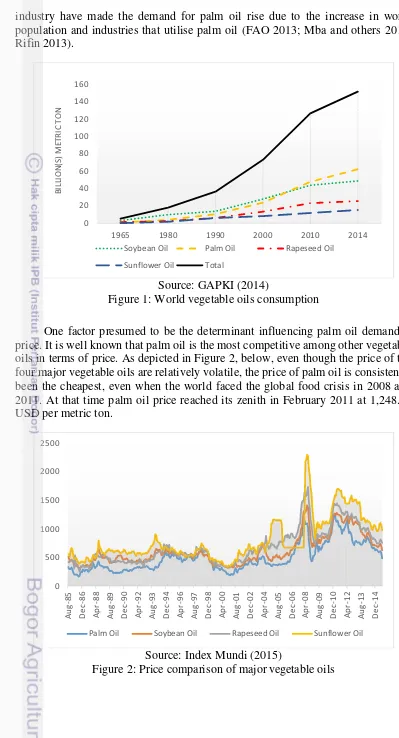
industry have made the demand for palm oil rise due to the increase in world population and industries that utilise palm oil (FAO 2013; Mba and others 2015; Rifin 2013).
Source: GAPKI (2014)
Figure 1: World vegetable oils consumption
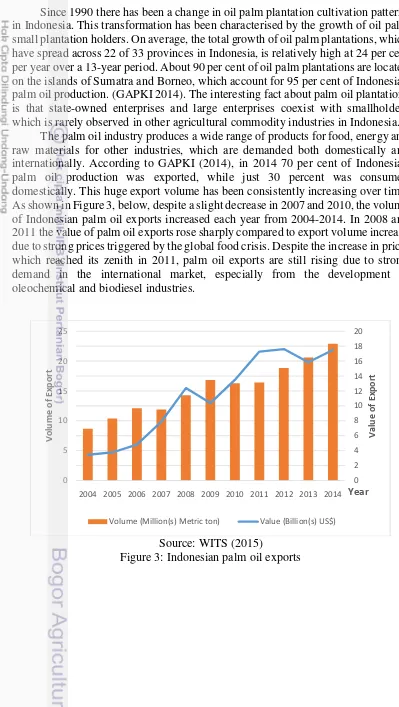
One factor presumed to be the determinant influencing palm oil demand is price. It is well known that palm oil is the most competitive among other vegetable oils in terms of price. As depicted in Figure 2, below, even though the price of the four major vegetable oils are relatively volatile, the price of palm oil is consistently been the cheapest, even when the world faced the global food crisis in 2008 and 2011. At that time palm oil price reached its zenith in February 2011 at 1,248.55 USD per metric ton.
Source: Index Mundi (2015)
Figure 2: Price comparison of majorvegetable oils 0
4
Indonesian Palm Oil Industries
Since 1990 there has been a change in oil palm plantation cultivation patterns in Indonesia.This transformation has been characterised by the growth of oil palm small plantation holders. On average, the total growth of oil palm plantations, which have spread across 22 of 33 provinces in Indonesia, is relatively high at 24 per cent per year over a 13-year period. About 90 per cent of oil palm plantations are located on the islands of Sumatra and Borneo, which account for 95 per cent of Indonesian palm oil production. (GAPKI 2014). The interesting fact about palm oil plantations is that state-owned enterprises and large enterprises coexist with smallholders which is rarely observed in other agricultural commodity industries in Indonesia.
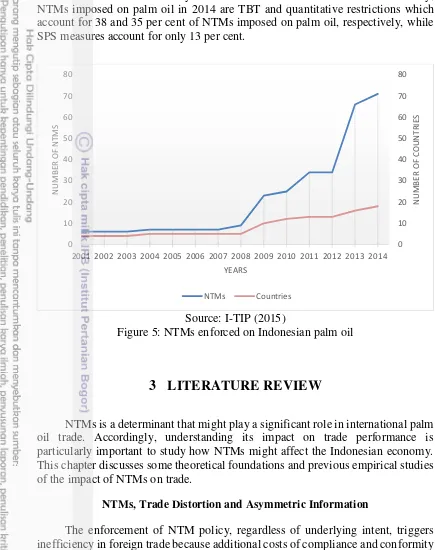
The palm oil industry produces a wide range of products for food, energy and raw materials for other industries, which are demanded both domestically and internationally. According to GAPKI (2014), in 2014 70 per cent of Indonesian palm oil production was exported, while just 30 percent was consumed domestically. This huge export volume has been consistently increasing over time. As shown in Figure 3, below, despite a slight decrease in 2007 and 2010, the volume of Indonesian palm oil exports increased each year from 2004-2014. In 2008 and 2011 the value of palm oil exports rose sharply compared to export volume increase due to strong prices triggered by the global food crisis. Despite the increase in price, which reached its zenith in 2011, palm oil exports are still rising due to strong demand in the international market, especially from the development of oleochemical and biodiesel industries.
Source: WITS (2015)
Figure 3: Indonesian palm oil exports 0
2004 2005 2006 2007 2008 2009 2010 2011 2012 2013 2014 0
Non-Tariff Measures
NTMs are a form of policy that may create a distortion effect on foreign trade. UNCTAD (2013) describes NTMs as “all policy-related trade costs incurred from production to final consumer, with the exclusion of tariffs”. This added cost would create a gap between the price in the domestic market and in importing countries. Besides distorting price, NTMs could also limit trading quantity and in some cases even have a prohibitive effect. Being one of the instruments which has an impact on trade cost, appropriate NTM implementation might be vital not only to protect domestic consumers and industries, but also to reduce disputes with trading partners.
As shown in Figure 4, below, UNCTAD (2013) classifies NTMs into 16 types which are divided into two main categories, import and export measures. The import measures category is divided into two sub-categories, technical and non-technical measures. Technical measures, such as non-technical barriers to trade (TBT) and sanitary and phytosanitary (SPS) measures, are imposed to protect domestic consumers by applying technical requirements related to standards and the quality of products in terms of technical specifications, contents limitations or restrictions, process of production and conformity assessment. Non-technical measures, such as quantitative restrictions, countervailing measures and anti-dumping measures, are NTMs usually imposed to protect domestic industries by either limiting imported goods directly through quotas or indirectly through price control measures.
Source: UNCTAD (2013)
Figure 4: Classification of non-tariff measures
6
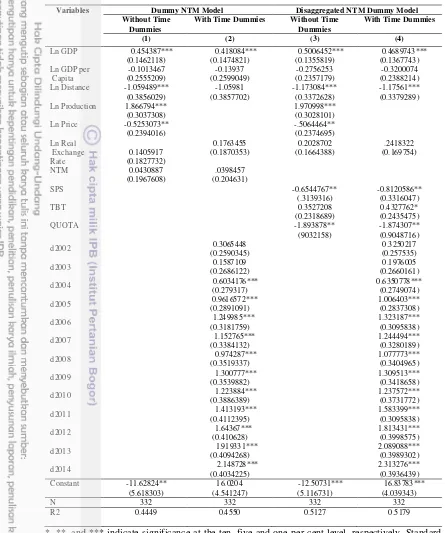
correct market failure caused by financial crises in 2007-2008 and 2011. Primarily, NTMs imposed on palm oil in 2014 are TBT and quantitative restrictions which account for 38 and 35 per cent of NTMs imposed on palm oil, respectively, while SPS measures account for only 13 per cent.
Source: I-TIP (2015)
Figure 5: NTMs enforced on Indonesian palm oil
3
LITERATURE REVIEW
NTMs is a determinant that might play a significant role in international palm oil trade. Accordingly, understanding its impact on trade performance is particularly important to study how NTMs might affect the Indonesian economy. This chapter discusses some theoretical foundations and previous empirical studies of the impact of NTMs on trade.
NTMs, Trade Distortion and Asymmetric Information
The enforcement of NTM policy, regardless of underlying intent, triggers inefficiency in foreign trade because additional costs of compliance and conformity assessment are incurred by producers in exporting countries in order to obtain market access to the export destination enforcing the regulations. Maskus and others (2013) examined the impact of enforced product standards on the cost of production in developing country firms and found that on average the production fixed cost rises by 4.7 per cent due to meeting export destination compliance. In addition, these authors found that variable costs also increase, ranging from 0.06 to 0.13 per cent. Additional costs may distort trade directly in terms of price, and may
0
2001 2002 2003 2004 2005 2006 2007 2008 2009 2010 2011 2012 2013 2014
also either limit or restrict trade, and consequently might reduce welfare compared to having a free market.
Despite the additional cost incurred by the use of NTMs, several type of NTMs, particularly SPS and TBT, are beneficial to reduce asymmetric information on international trade. The term asymmetric information refers to the situation where agents do not have the same level of information (WTO 2012). The enforcement of labeling or conformity assessment on food safety standards is used to reduce customer uncertainty regarding product quality and contents. Thus, reducing asymmetric information on imported goods (Farida 2015).
From the discussion above, some conclusions can be drawn. First, in importing countries prices of commodities on which NTMs are imposed tend to be higher due to reduced competition from imported goods. This benefits producers while harming consumers. Second, from a consumer protection view, consumers in the importing country benefit because they are protected from low-quality or contaminated goods. Third, for producers in exporting countries NTMs have ambiguous effects. On one hand they face rising production costs leading to reduced product competitiveness that might lead to less demand. On the other hand meeting enforced compliance and conformity assessment of the export destination could reduce asymmetric information by signaling about the quality of their products which might lead to increased demand due to increased consumer confidence to buy the products.
Previous Studies on NTMs
Many previous studies examining the impact of NTMs on trade performance provide evidence that NTMs could have diverse results on cross border trade. Mainly, those studies use a gravity model to determine the NTM impact. In this study, several relevant studies are discussed to gain deeper understanding of how NTMs could affect international trade.
The majority of studies on NTMs suggest that the imposition of NTMs results in decreased export performance. Wall (1999) analysed the impact of import protection on US trade and welfare using panel data analysis to measure the impact of exporting country GDP, importing country GDP, and Trade Policy Index variables on trade flows. Results showed that import protection imposition in the US cause a 26.2 per cent decrease on US exports, while US import tariffs lower US imports from non NAFTA countries by 15.4 per cent per year.
In reality, irrespective whether the intention of NTM imposition is protectionist or not, evidence suggests that NTMs could trigger greater distortion than tariffs. As observed by Chen and others (2008) export performance of Chinese agricultural commodities and aquatic products are facing greater challenge from food and safety standards than import tariffs. More stringent food standard applied by the US, EU and New Zealand, compared to CODEX international standards, would reduce China’s export to those countries by 21, 23, and 23 per cent, respectively. While if equivalent import tariff was applied, it would only impact export performance by 15 per cent to EU and 11 per cent to Japan.
8
export in G-90 countries. Using gravity model, they found that these policy reduce export of developing countries and LDCs only, while export from OECD countries are not significantly affected. This might happen because developed countries, like OECD, have the technology and similar awareness towards environment and food safety standards to comply with import country requirements.
Although most of previous literature found that imposition of NTMs have unwanted consequences on trade performance, a considerable amount of study has also shown that it may not always be the case. Farida (2015) explored the impact of NTMs on Indonesian coffee trade. Using gravity panel with fixed effect and OLS estimation, this author found that NTMs consistently have positive and statistically significant effect on Indonesian coffee export, whether used as a single dummy variable or when disaggregated into SPS and TBT variables. Moreover, when fixed effect estimation is used, NTM variables still show positive signs. While, when disaggregated into SPS and TBT, only TBT that consistently shows positive impact. Fassarella and others (2011) examined the impact of SPS and TBT on Brazil’s poultry meat export from 1996 to 2009 shows similar findings. Using gravity model with fixed effect estimation, these authors show that TBT measure can stimulate export, while SPS measure may have the opposite effect. These findings reveal that besides impeding trade, NTMs can also act as trade catalyst, especially when policies are intended to reduce asymmetric information between producer and consumer regarding product quality, such as the use of labelling.
Another compelling finding on the impact of NTMs is that in several cases the effect is not permanent, but changes after some period of time. This was demonstrated by Peterson and others (2013) regarding the impacts of US phytosanitary regulation for several fruit and vegetable commodities between 1996 and 2008. Using gravity equation on exports from 89 countries, they found that initially SPS impacted negatively on US imports. However, the effect was not permanent and altered after some time. The alteration was due to experience and understanding gained by exporting countries about the standard required to enter the US market. This understanding results in compliance with the requirement and improved product quality. This empirical evidence is strengthened by Song and Chen (2010) who obtained similar results when estimating the impact of food safety standards on Chinese exports. They found that the short and long effects of the regulations are different. While the short run had a statistically significant effect on China’s Chinese export, the long run effect shows otherwise.
From the examples above, we can see that the impact of NTMs are diverse in terms of direction and magnitude. Moreover, in some cases the effect can be time bound and may also affect one country to another differently. Accordingly, we need a deeper understanding when considering different characteristics and polices to analyse the impact of NTMs in trade in order to legislate suitable policies to overcome challenges that arise.
4
METHODOLOGIES AND DATA
NTM’s impact on trade. The logistic regression model is used to identify determinants which cause the imposition of NTMs, while the gravity panel data model is applied to estimate their impact on trade across borders by utilising dummy variables to capture the incidence of NTMs on a country’s trade policies.
Logistic Regression Model
The logistic regression model, or the logit model, is a model developed to measure the relationship between binary regressand and one or more regressors to explain probabilities of the regressand (Hosmer and others 2013). This model assumes that the response or dependent variables are categorical and coded as either 0 or 1.
As explained by Juanda (2009), logistic regression model is derived from cumulative logistic probabilities function and has a basic form as follows:
= = + =1 + �1 −� = 1
1 + �− + ��
While the logit form of the model are shown below:
= � 1 − = +
Where, e represents the base number of the natural logarithm (e=2.71828...), and ��
−�� represents odds ratio which is the probability ratio on the occurrence of
one incident compared to the alternative incident.
Depending on the number of independent variables and observations, the logistic regression model can be developed into a multiple logistic regression model (Hosmer and others 2013) with k numbers for explanatory variables, and i numbers for observations. Juanda (2009) shows that the multiple logistic regression model takes the following form:
= � =1 + �− + �1 �+⋯+ ����
While the logit form of the model are shown below:
� � = � 1 − � =� + � + ⋯ + �
Where in this study � denotes the presence of NTM imposition on palm oil, is the intercept, are the estimated coefficients and � to � are variables which are expected to have influence on the imposition of NTMs on palm oil.
Two multiple logistic regressions are developed in this study to measure the influence of determinants that could trigger the incidences of NTMs affecting Indonesian palm oil exports.
Model 1:
� − � � �� � � = + � + + +
10
Model 2:
� − � � �� � � = + � + + +
� �
Where ‘IMPVOL’ indicate the total value of imported palm oil in the years 2013 measured in million metric ton, ‘GDP’ is the size of the economy which represents the capacity to import palm oil products measured in billion US dollars. ‘GDPCAP’ is the income level of each country weighted by their population which represents the purchasing power of the individual for consumption measured in hundred US dollars. ‘POP’ indicates the country population which represents the size of the country’s palm oil absorption capacity measured in million people. The dependent variable is the incidences of NTMs in the year 2013, which takes the value of 1 if at least one type of NTM is enforced by the country, otherwise it is 0 if no NTMs were imposed.
This model uses secondary data on 40 top palm oil importer countries collected only for the years 2013 based on data availability. This study uses HS 15111 (palm oil and its fractions) as the analysed commodity.
Import price is calculated based on the data for palm oil imports from the Ministry of Trade of Indonesia. Data for GDP, GDP per capita and population are extracted from the World Development Indicators (WDI). The data for NTM incidences are taken from the WTO.
Gravity Model
This study uses the gravity model to measure the impact of NTMs on Indonesian palm oil exports. The gravity model was inspired by the Newtonian law of gravity which states that gravitational force is proportionally related to the objects masses and inversely related to the square distance between them. Gravity models were first developed by Tinbergen (1963) to explain a positive correlation between the volume of trade to GDP and a negative correlation to distance. Since then, the gravity model has been widely used as an international trade model. Gravity models represent trading volume as a function of GDP and distance between two trading partners.
Dummy NTM Model: importing countries and the year of trade, respectively. are the estimated variables’ coefficients and � is the error term.
denotes the export volume of Indonesian palm oil to importing country in year , measured in kilograms. The number of observed countries was 23, based on the top 30 of the largest total export volume of palm exports from Indonesia in 2014 which have complete data (i.e., India, China, Pakistan, Italy, Netherlands, Bangladesh, Egypt, Spain, Singapore, Malaysia, Russian Federation, USA, Ukraine, South Africa, Benin, Philippines, Brazil, Turkey, Tanzania, Germany, Ghana, Angola and Mauritania) in a 14 year period of observation from 2001 to 2014. This responding variable data was taken from the Ministry of Trade of the Republic of Indonesia which stems from the Indonesian Central Bureau of Statistics (BPS) database focusing on palm oil (HS code 1511) as the subject of study.
denotes importing countries’ GDP used as a proxy for palm oil absorption capacity in importing countries, which measured in US dollars. This variable captures economic size, demand for palm oil and purchasing power. Statistics for GDP of each importing country were obtained from the World Development Indicators (WDI) database.
� denotes the GDP per capita of importing country in real terms which indicates palm oil absorption capacity from household consumption as it is used as the proxy for standard of living or income level. Statistics for GDP per capita were extracted from WDI.
denotes geographical distance between Indonesia and importing countries measured in kilometres. This independent variable was obtained from the CEPII database and used as a resistance variable which acts as a proxy for transportation cost.
denotes palm oil production in Indonesia measured in kilograms. This variable was used to observe the potential export capacity. Data for palm oil production was obtained from the Ministry of Agriculture of the Republic of Indonesia.
� denotes the international prices of palm oil measured in USD per metric ton. Statistics for the palm oil price were taken from the Index Mundi.
denotes the real exchange rate between exporting and importing countries. Statistics for this variable were taken from the UNCTAD database.
12
dummy variable, which takes on the value 1 if there is at least one NTM imposed on palm oil, either SPS, TBT or quantitative restriction, and zero otherwise. The second model uses NTM dummy variables which were disaggregated into three dummy variables, i.e. SPS, TBT and QR, which take the value of 1 if the importing country enforced at least one of the disaggregated NTMs and zero otherwise. These measures were obtained from the WTO’s I-TIP database focusing on palm oil (HS code 1511).
As a benchmark, alternative models were also developed through the introduction of time dummies on both models. To avoid colinearity, the variables such as palm oil price and production which are invariant across countries at a particular time are omitted from these models. The introduction of time dummies are intended to capture various effects that may have an influence in a given year. These variables take the value of 1 for a particular year and zero otherwise.
This study used panel data consisting of 23 countries and 14 time periods, with a total of 322 observations. In this study, estimation techniques were selected using three tests in the forms of the F Test, Hausman Test and LM Test to decide the preferred model with the most efficient and consistent estimation between the pooled least squares, fixed effect model or random effect model.
5
RESULTS AND DISCUSSION
Determinants Influencing the Imposition of NTMs on Palm Oil
The results of the logistic regression model are shown in Table 1, below. Three models are developed to measure the incidences of NTMs on Indonesian palm oil exports in the year 2013. The time selection used for this model is due to the significant increases in NTM incidences in the selected years, having almost doubled from 34 incidences in the previous year to 66 incidences, while the selection of determinants is based on Farida (2015) model which measures the incidence of SPS and TBT measures on Indonesian coffee exports with some modifications.
Table 1: The odds ratio of logistic regression model for determinants influencing the incidences of NTMs on palm oil
Model 1 Model 2
Import Volume 1.021447** 1.0012370**
Importing Countries GDP 1.001263 ***
Importing Countries GDP per capita 1.005841***
Importing Countries population 0.987276 *** 0.999427***
Import Price 0.998407 0.99825
*, **, and *** indicate significance at the ten, five and one per cent level, respectively. Source: Author Calculations
of palm oil are increased by 1 million metric ton, the probability of NTMs imposition will multiplied by 1.021447 and 1.001237 respectively. This happened presumably due to two factors. First, as discussed in the previous chapter, protectionist policies are used to protect domestic industries. This can be seen from the I-TIP WTO database where the US and EU countries impose six and four types of NTMs on palm oil imports, respectively. As is widely known, both the US and EU produce competing products for palm oil in terms of soybean and rapeseed oil. Secondly, concern raised by some environmental organisations has impacted on the imposition of NTMs because a higher export value means higher production which comes from increased rainforest deforestation for the expansion of palm oil plantations.
GDP and GDP per capita show statistically significant coefficient estimations at the five per cent level. Both variables are used to represent a country’s capacity to absorb palm oil imports. While GDP represents absorption capacity of palm oil as raw material for industrial activities, GDP per capita represents household consumption of products derived from palm oil. The first model predicts that an increase of a billion USD on importing countrie’s GDP will multiply the probability of NTMs imposition by 1.001263 times, while the second model shows that an increase of 100 USD on GDP per capita will multiply the probability of NTMs imposition of palm oil by 1.005841.
The population determinant also shows a statistically significant coefficient. As GDP per capita, population is also used to represent household absorption in terms of consuming imported goods. However, the effect of population shows the value of is less than 1 in the odds ratio for both models, this results indicate that the increase in population might reduce the use of non-tariff measures due to the increase in demand for palm oil in household consumption. These 2 models predicts that if the population of the importing countrie’s are increases by 1 million people, the probability of NTMs imposition will decrease by 0.987276 and 0.999427 times respectively.
Meanwhile, the import price shows statistically insignificant estimation results. This suggests that price is not associated with the imposition of NTMs on palm oil. As highlighted earlier, even on reaching its highest price when the global food crisis occurred, palm oil was still the cheapest vegetable oil compared to all of its competitors. Thus, even when price rises competitiveness is still high, which might explain why these two determinants are not related. Moreover, unlike other commodities which have diverse qualities or grade (i.e. coffee and tea) palm oil is rather homogenous which means its price is similar for all producers.
The Impact of NTMs on Export
14
Table 2: Regression Results for the impact of NTMs on indonesian palm oil exports
Variables Dummy NTM Model Disaggregated NTM Dummy Model
Without Time Dummies
With Time Dummies Without Time Dummies
d2003 (0.2686122) 0.1587109 (0.2660161) 0.1976005
d2004 0.6034176***
*, **, and *** indicate significance at the ten, five and one per cent level, respectively. Standard errors are in parentheses.
Source: Author Calculations
statistically significant at the one per cent level. These results imply that the increase in importing countries GDP as a proxy for economic size would also raise Indonesian palm oil exports.
The distance variable has consistent estimation signs, but opposite to GDP. This result is consistent with gravity model theory that describes distance as a trade impeding attribute in international trade. However, only three of four models where distance is estimated are coefficients statistically significant at one per cent level. Only in model 2 where NTM and time dummies are used does distance have statistically insignificant coefficient. These results suggest that distance has a restrictive effect on palm oil trade due to the need for higher transportation costs when trading with more distant countries, thus resulting in lower export volume.
Due to its nature, which takes the same value for all of the countries in each specific year, Indonesian palm oil production is only estimated in the model without time dummies (columns 1 and 3). In both models, the production coefficients show consistent positive signs and are statistically significant at the one per cent level, suggesting that higher production would draw higher export quantity.
Similarly, price is only estimated in models 1 and 3 where time dummies were not included. For both models, price has a negative sign and statistically significant coefficients at the five per cent level. This is in line with the law of demand where price and demand quantity have an inverse relationship.
Unexpected results are found with GDP per capita which has negative coefficients sign but is statistically insignificant in all four models. These results are in contrary to the initial hypothesis which predicts that it has positive correlation with the quantity of palm oil imported to the country. This is possibly related to the environmental Kuznets curve (EKC) which shows the relationship between environmental degradation and income per capita (Tietenberg and Lewis 2011). The EKC explains that beyond a certain level of income per capita people become more aware and concerned about the environment. Thus, as palm oil industries are often linked with deforestation, welfare growth may lead people to reduce the use of palm oil. Moreover, most high income countries who imported palm oil also have a viable domestic product substitute, such as rapeseed and sunflower oil in the EU, and soybean, rapeseed and sunflower oil in US. These two conditions are presumed to be the reasons for this phenomena.
The objective of this study is to measure the impact of NTMs in the form of SPS, TBT and quantitative restriction. Four models have been developed to achieve this objective by utilising dummy variables to capture the non-tariff measures. The first and second models used only one NTM dummy which represents all three types of the non-tariff measure, while the third and fourth models use three dummies to represent each SPS, TBT and quota measure individually. However, evident in Table 2, in both models at the one, five and ten per cent level of significance, NTM dummies are insignificant with and without time dummies. These results imply that the effect of NTMs is still ambiguous or do not have an effect at all. However, these insignificant results could also possibly mean that from the three types of NTMs represented by this dummy there may be a contradicting impact on Indonesian palm oil exports.
16
restriction have a negative sign and statistically significant coefficients at the five per cent level, while TBT measures have negative signs, but are statistically insignificant. However, when time dummies are introduced to the fourth model, all three types of NTMs have statistically significant coefficients, while the signs for particular NTM types are consistent with model 3. This suggests that, as discussed earlier, these three types of NTMs have different effects on export with SPS having a restrictive effect on palm oil trade possibly due to the extra cost needed to obtain a conformity assessment which led to reduced palm oil competitiveness in these countries’ markets. By using simple mathematical calculations the magnitude of SPS impact on trade is obtained from the model. On average, the imposition of the SPS measure reduced Indonesian palm oil export by 11,420 metric tons holding other factors constant. This finding is similar to that of (Chen and others (2008)) who also found an inverse relationship between this determinant on exports. Another type of NTM which shows a restrictive effect on trade is quantitative restricton. Using the same calculation, on average quantitative restriction measure reduces Indonesian palm oil export by17,386 metric tons holding other factors constant. This result suggests that this type of policy has a trade impeding effect by limiting the amount of palm oil exported.
However, for TBT the result shows that it has a positive correlation with the volume of palm oil exports. As discussed chapter 3, TBT such as labelling can promote trade by reducing assymetric information which promotes consumer confidence as they can be assured of product quality. By using simple mathematical calculation the magnitude of TBT impact on trade is obtained from the model. On average, the imposition of TBT measure increased Indonesian palm oil export by 11,122 metric tons holding other factors constant. This result is in line with Farida (2015) who found a positive relationship between coffee export and the imposition of TBT due to product labeling which provide consumers assurance regarding quality of Indonesian coffee. As for palm oil, in addition to being concerned about product quality, some consumers also have concerns regarding allegations about the environmental impact of palm oil industries. Accordingly, having labels, such as the Roundtable on Sustainable Palm Oil (RSPO) certified label, those issues can be reduced or eliminated.
Another interesting finding comes from results of the time dummies. Both models including this variable (models 2 and 4) show robust and consistent results. From 13 time dummies introduced to the model, 11 years dummies from 2004 to 2014 have positive signs and statistically significant coefficients at the one per cent level, while dummies for the years 2002 to 2003 are insigificant. One analysis that could be drawn from these results is potential relationship with the biofuel industry boom in the early 2000s which demanded large amounts of palm oil as its raw material. In terms of magnitude, in model 4, even though there is still a positive coefficent for dummies 2008 and 2010, the coefficient is lower than for previous years. This could be an indication of when the global food crisis took place and commodities reached their highest prices, thus resulting in lower exports than the previous year.
6
CONCLUSION AND POLICY RECOMMENDATIONS
Conclusion
While the incidence of NTMs on international trade policy have become more frequent and widely used, the magnitude and direction of their impact on trade flow remain inconclusive. Previous studies have shown that NTMs can affect trade in two distinct ways, either enhance or hinder trade. Furthermore, in several cases, the impact can potentially change overtime or affect various trade partners differently. This case by case effect of NTMs makes study of their impact on particular trade commodities on a country’s trade performance crucial to measuring actual impact on trade. Given the significant role the palm oil industry plays in Indonesian social and economic sectors, the imposition of NTMs may pose a threat to its growth potential
Accordingly, this study aims to observe incidences and effects of NTMs on Indonesian palm oil exports. First, the logistic regression model was developed to analyse factors influencing the imposition of NTMs on palm oil exports using a dataset of the 40 largest Indonesian palm oil importing countries in 2013. Second, the gravity model was developed to measure the impact of NTMs on palm oil exports in 23 countries from the 30 largest importing countries. The remaining countries were not included in this study as data was incomplete.
Results of the logistic regression model suggest that import volume, GDP and the GDP per capita, and population of importing countries determined the imposition of NTMs on palm oil trade in 2013. From the two models developed, import volumes consistently show positive and significant coefficient signs indicating the potential to influence imposition of NTMs in importing countries.It is possible that the enforcement of NTMs is related to protectionist policies imposed to reduce import quantity in order to protect domestic vegetable oil industries. Similar to the volume of imports, both GDP and GDP per capita have positive and significant coefficient signs in the models where they are included (models 1 and 2, respectively). This may be related to greater environmental awareness of people in high income countries which drives the imposition of this policy type due to allegations of negative environmental impacts on rainforests caused by palm oil plantations. Meanwhile, based on the results of all two models, palm oil prices are unlikely to influence the imposition of NTMs on palm oil trade.
18
consumer confidence regarding the quality of Indonesian palm oil. Meanwhile, due to the contrasting effect from each type of NTM, the use of one dummy variable which represents all three type of NTMs was not suitable for measuring impact on trade.
Given that importing countries are imposing import tariffs and at the same time Indonesia is applying export duties to palm oil as part of its trade policy, further research is needed to address these variables to examine how these regulations counteract each other and impact on Indonesian palm oil export performances.
Policy Recommendations
Based on conclusion above, several recommendations are proposed to the governments, namely:
Promote Downstream Industries for Palm Oil Products
The development of downstream industries that utilise palm oil needs to occur to gain added value on products in the international market. Currently, only 23 of more than 100 types of palm oil derivative products, edible and non-edible, have been produced in Indonesia (Ministry of Industry 2014). In regards to the high value added which can be gained by producing derivative products rather than sale as raw materials, a regulation to promote downstream industries of palm oil is needed. Besides gaining more revenue from the added value, producing other types of palm oil derivative products also may broaden the Indonesian export market. Thus, policy to promote downstream industries are required to encourage producers to invest. These policies can be in the form of tax exemptions, technical assistance and subsidies for producers.
Increase Community Environmental Awareness
Many palm oil producers are smallholders from rural areas who use non-environmentally friendly methods (i.e. slash and burn technique) to reduce time and costs in land clearing for oil palm plantations. Many of these people are not aware of the consequences and outcomes of their action. Public awareness is needed for the government to achieve goals in reducing environmental degradation, such as biodiversity loss and haze problems. Thus, raising environmental awareness of communities in oil palm plantations is urgently needed in order to promote a sustainable palm oil industry. There are two recommended practical solutions that may increase public awareness:
a. Adding environmental education to the elementary school curriculum. This method introduces knowledge about environmental impacts of human activities and also gives children a sense of belonging towards their environment;
b. Using media to spread the message and educate the community about environmental issues and socialise government regulations and sanctions on environment preservation to the community.
Develop Regulations to Enforce the Use of Sustainable Palm Oil Certification
sustainability of their production processes to provide assurance to consumers that Indonesia’s palm oil is not causing environmental harm. Accordingly, a regulation to encourage or even enforce producers to obtain certification on Indonesian palm oil products before they are exported is a high priority need. This practical policy can be in the form of certification as an export requirement, higher taxation for producer which do not acquire certification, or giving technical assistance for palm oil, especially smallholders, to acquire certification.
Promote More Stringent Law Enforcement
20
REFERENCES
BBC. South East Asia haze: What is slash-and-burn?. http://www.bbc.com/news/business-23026219 [viewed 15 November 2015]
Bussière M, Pérez-Barreiro E, Straub R, Taglioni D. 2011. Protectionist Responses to the Crisis: Global Trends and Implications. World Economy 34(5):826-852.
[BPS] Biro Pusat Statistik. 2014. Statistical Yearbook of Indonesia 2014. Indonesian Central Bureau of Statistics
Carter C, Finley W, Fry J, Jackson D, Willis L. 2007. Palm Oil Markets and Future Supply. European Journal of Lipid Science and Technology 109(4):307-314. [CEPII] Centre d'Etudes Prospectives et d'Informations Internationales. 2010. Distance. Centre d'Etudes Prospectives et d'Informations Internationales. http://www.cepii.fr/anglaisgraph/bdd/distances.htm. [viewed 3 September 2015]
Chen C, Yang J, Findlay C. 2008. Measuring the Effect of Food Safety Standards on China’s Agricultural Exports. Review of World Economics 144(1):83-106.
Disdier A-C, Fontagne L, Mimouni M. 2008. The Impact of Regulations on Agricultural Trade: Evidence from the SPS and TBT Agreements. American Journal of Agricultural Economics 90(2):336-350.
[FAO] Food and Agriculture Organization. 2013. FAO Statistical Yearbooks: World food and agriculture. Food and Agriculture Organization of the United Nations.
Farida YSH. 2015. The Impacts of Non-Tariff Measures on Indonesian Coffee Exports: Evidence from the SPS And TBT Measures [Master Thesis]. Adelaide: The University of Adelaide.
Fassarella LM, de Souza MJP, Burnquist HL. 2011. Impact of Sanitary and Technical Measures on Brazilian Exports of Poultry Meat. Selected Paper prepared for presentation at the Agricultural & Applied Economics Association’s 2011 AAEA & NAREA Joint Annual Meeting July 24-26, 2011. Pittsburgh, Pennsylvania.
[GAPKI] Gabungan Pengusaha Kelapa Sawit Indonesia. 2014. Industri Minyak Sawit Indonesia Menuju 100 Tahun NKRI (Indonesian Palm Oil Industry Towards 100 Years of The Republic of Indonesia), Gabungan Pengusaha Kelapa Sawit Indonesia, Jakarta
Georgiadis G, Gräb J. 2013. Growth, real exchange rates and trade protectionism since the financial crisis. European Central Bank.
Hosmer DW, Lemeshow S, Sturdivant RX. 2013. Applied Logistic Regression. Hoboken: Wiley.
Index Mundi. 2015. Palm Oil Monthly Price. Index Mundi 2015.
http://www.indexmundi.com/commodities/?commodity=palm-oil&months=60. [viewed 4 September]
Lim S, Teong LK. 2010. Recent trends, opportunities and challenges of biodiesel in Malaysia: An overview. Renewable and Sustainable Energy Reviews 14(3):938-954.
Lodge GC. 1995. Managing Globalization in the age of Interdependence. San Diego, CA: Jossey-Bass.
Maskus KE, Otsuki T, Wilson JS. 2013. Do foreign product standards matter? Impacts on costs for developing country exporters. Asia-Pacific Journal of Accounting & Economics 20(1):37-57.
Mazzanti M, Zoboli R. 2008. Waste generation, waste disposal and policy effectiveness: Evidence on decoupling from the European Union. Resources, Conservation and Recycling 52(10):1221-1234.
Mba OI, Dumont M-J, Ngadi M. 2015. Palm oil: Processing, characterization and utilization in the food industry – A review. Food Bioscience 10:26-41. [MoA] Ministry of Agriculture. 2015. Basis data pertanian (Agricultural
database). The Ministry of Agriculture of Republic of Indonesia. http://aplikasi.pertanian.go.id/bdsp/index.asp. [viewed 4 September 2015] Monteiro de Carvalho C, Silveira S, Rovere ELL, Iwama AY. 2015. Deforested and
degraded land available for the expansion of palm oil for biodiesel in the state of Pará in the Brazilian Amazon. Renewable and Sustainable Energy Reviews 44:867-876.
Mukherjee I, Sovacool BK. 2014. Palm oil-based biofuels and sustainability in southeast Asia: A review of Indonesia, Malaysia, and Thailand. Renewable and Sustainable Energy Reviews 37:1-12.
Peterson E, Grant J, Roberts D, Karov V. 2013. Evaluating the Trade Restrictiveness of Phytosanitary Measures on U.S. Fresh Fruit and Vegetable Imports. American Journal of Agricultural Economics 95(4):842-858.
Rifin A. 2013. Analysis of Indonesia's Market Position in Palm Oil Market in China and India. Journal of Food Products Marketing 19(4):299-310.
Rusmana Y, Listiyorini E. Palm Oil Export Growth Stalling in Indonesia on Biofuel
Jump [Internet]. Bloomberg.
http://www.bloomberg.com/news/articles/2014-03-02/palm-oil-export-growth-stalling-in-indonesia-on-biodiesel-surge [viewed 7 September 2015]
Song H, Chen K. 2010. Trade Effects and Compliance Costs of Food Safety Regulations: the Case of China. Agriculture and Agricultural Science Procedia 1:429-438.
Susila WR. 2004. Contribution of Oil Palm Industry to Economic Growth and Poverty Alleviation in Indonesia. Jurnal Litbang Pertanian 23.
Tietenberg T, Lewis L. 2011. Environmental & Natural Resources Economics. New Jersey: Prentice Hall.
Tinbergen J. 1963. Shaping The World Economy. International Executive 5(1):27-30.
[UNCTAD] United Nations Conference on Trade and Development. 2013. Non-Tariff Measures to Trade: Economic and Policy Issues for Developing Countries. Geneva: UNCTAD.
22
World Growth. 2011. The Economic Benefit of Palm Oil to Indonesia. Arlington, VA: World Growth.
World Bank. 2015. World Development Indicators. World Bank. http://databank.worldbank.org/data/home.aspx. [viewed 2 September 2015] [WTO] World Trade Organization. 2012. World Trade Report 2012. Trade and
public policies: A closer look at non-tariff measures in the 21st century Geneva, SA: World Trade Organization.
APPENDICES
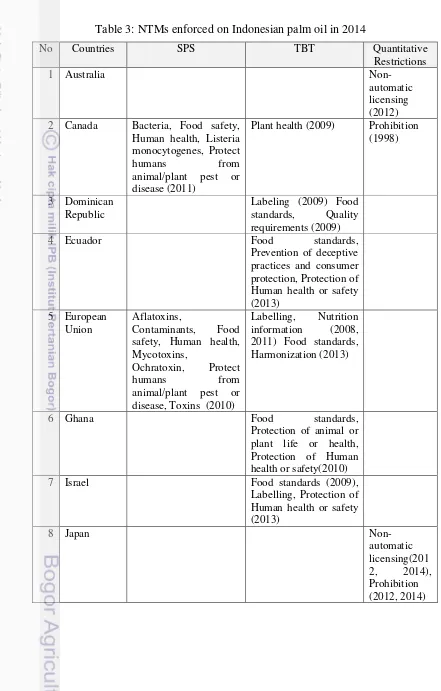
Table 3: NTMs enforced on Indonesian palm oil in 2014
24
18 Thailand Certification, control
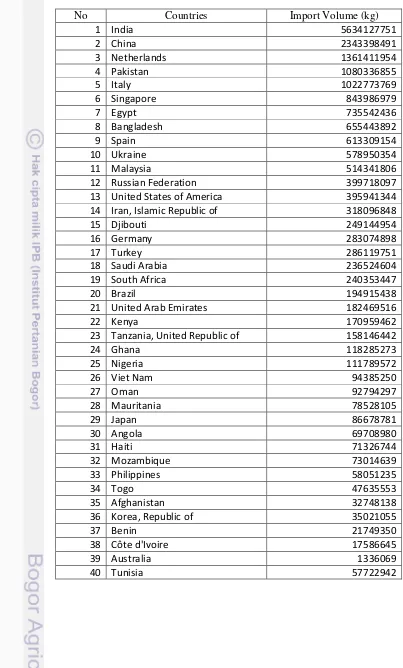
Table 4: 40 largest importer of Indonesian palm oil in 2013
No Countries Import Volume (kg)
1 India 5634127751
12 Russian Federation 399718097
13 United States of America 395941344
14 Iran, Islamic Republic of 318096848
15 Djibouti 249144954
16 Germany 283074898
17 Turkey 286119751
18 Saudi Arabia 236524604
19 South Africa 240353447
20 Brazil 194915438
21 United Arab Emirates 182469516
22 Kenya 170959462
23 Tanzania, United Republic of 158146442
24 Ghana 118285273
36 Korea, Republic of 35021055
37 Benin 21749350
38 Côte d'Ivoire 17586645
39 Australia 1336069
26