A Generic Psychovisual Error Threshold for the
Quantization Table Generation on JPEG Image
Compression
Nur Azman Abu, Ferda Ernawan and Nanna Suryana
Faculty of Information and Communication Technology, Universiti Teknikal Malaysia Melaka Melaka, Malaysia
e-mail: [email protected], [email protected] and [email protected]
Abstract—Thequantization process is a main part of image
compression to control visual quality and the bit rate of the image output. The JPEG quantization tables are obtained from a series of psychovisual experiments to determine a visual threshold. The visual threshold is useful in handling the intensity level of the colour image that can be perceived visually by the human visual system. This paper will investigate a psychovisual error threshold at DCT frequency on the grayscale image. The DCT coefficients are incremented one by one for each frequency order. Whereby, the contribution of DCT coefficients to the error reconstruction will be a primitive pyschovisual error. At certain threshold being set on this psychovisual error, the new quantization table can be generated. The experimental results show that the new quantization table from psychovisual error threshold for DCT basis functions gives better quality image at lower average bit length of Huffman code than standard JPEG image compression.
Index Terms—psychovisual error thresholds, quantization
table, discrete Cosine transform, JPEG image compression. I. INTRODUCTION
The human eye is capable of perceiving various levels of colors. Some bits of accuracy can be neglected without causing perceptual breakdown in the image. For example, the human eye can hardly differentiate among the green leaves of a tree. A psychovisual error threshold can be used to model a better human visual system. As a result, a better understanding can be reached on how the human eye perceives image quality. The concept of psychovisual error threshold can be applied on a wide range of image processing applications such as steganography, image watermarking, image projection and image compression.
This paper will explore on the concept of psychovisual error threshold to generate a better quantization table on JPEG image compression only. The sensitivity of the human eye can be fully explored and exploited in the qualitative experimental by measuring just noticeable difference of the compressed image from the original image. However, it is too expensive costly to conduct qualitative experiment. In this quantitative experiment, the concept of just noticeable difference of the compressed image from the original image shall be extracted at psychovisual threshold.
JPEG quantization tables have been widely used over the last few decades as the default quantization table in image compression. The quantization tables play a central role in the compression fidelity performance of JPEG coding. JPEG
quantization of the DCT coefficient produces distortion in the output of the compressed image. The popular quantization table optimization is obtained by quality scaling factor for the quantization table value. The quality scaling factor of quantization table has been implemented in many image processing applications such as image compression [1] and JPEG steganography [2]. Scaling factor on JPEG quantization tables is intended low, medium or high bit rate compression.
Many different methods have been proposed in order to get optimal quantization table for JPEG image compression. The underlying objectives is to minimize the lost of fidelity which occurs during the quantization process. Several approaches have been obtained using stochastic optimization [3], perceptual image quality assessment [4], optimal zeroing strategy along quantization table [5] and rate distortion theory [6]-[8]. Each of these methods uses the same quantization tables for each block image and they are not compliant with the standard JPEG image compression algorithm. For real time image applications, the complexity of the encoder increases with significantly.
Quantization tables have been produced from a series of psychovisual experiments which determine the visibility thresholds for the DCT basis functions [9]. Psychovisual error threshold can be obtained from quantitative by evaluating the just noticeable difference of the compressed image from the original image at various frequency orders. This experiment investigates one by one the effect of incrementing DCT coefficients to an image. The JPEG quantization value is used as reference for a maximum of incrementing DCT coefficients. The effect of an increment DCT coefficient is calculated and analyzed to get a psychovisual error threshold of the images. This paper proposes a new quantization table for luminance channel based on the concept of this psychovisual threshold on DCT basis function.
II. DISCRETE COSINE TRANSFORM
The 2-D DCT is a popular transform used in JPEG compression standard. The image input is first divided into 8×8 blocks of image data. DCT is then used to transform each 8×8 block into frequency domain. The definition of the two-dimensional DCT for input image A and output image B is given as follows [10]:
(1)
for , , … , and , , … ,
where
√ ,
,
and √
, .
, .
(2)
The two-dimensional DCT can be computed using the one dimensional DCT horizontally and then vertically across the signals. The inverse of DCT is given as follows:
(3)
for , , … , and , , … ,
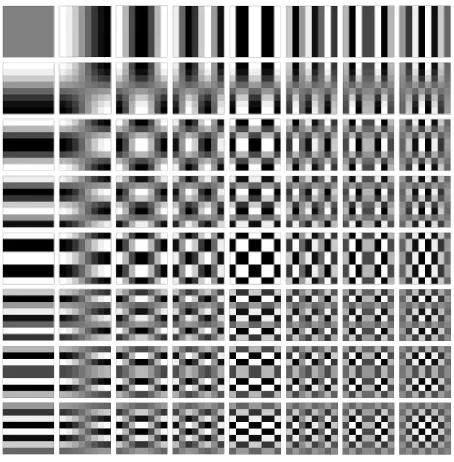
The 2-D DCT basis functions are generated by multiplying two 1-D DCT basis functions. The DCT basis function is shown in Figure 1 below. The outputs of a transformed 8×8 block of image data are 64 DCT coefficients. The coefficient in the upper top left most corner of the array basis function is called DC coefficient and the rest of the coefficients are called AC coefficient.
Figure 1. 8×8 DCT basis function.
Fig. 1 shows a combination of horizontal and vertical frequencies of two dimensional DCT. There are 64 two dimensional cosine basis functions that are generated by multiplying a horizontal against vertical set of one dimensional 8-point basis functions. The horizontal set of basis function represents a horizontal frequency and another
set of basis function represents a vertical frequency. Refer to Figure 1, the neutral gray represents zero in this figure, white represents positive amplitudes and black represents negative amplitudes [11].
III. EXPERIMENTAL DESIGN
A. Design on JPEG Quantization Table
The loss visual image information in image compression occurs in the quantization process by quantizing the transform coefficients. The bit rate and quality of the compressed image are controlled by quantization table. Therefore, the quantization table is a crucial element of image compression performance.
The principle of the quantization process is to estimate the variance of coefficient transform and give more bits to coefficient with larger variance. The quantization table is constructed to set an optimum allocation of bits. The quantization table for the luminance below for DCT is defined mathematically as follows [12]:
= (4)
These tables were obtained from a series of psychovisual experiments which determined the visibility thresholds for the DCT basis functions on a 760×576 image and at a viewing distance equal to six times the screen width [9]. In 1993, Pennebaker claimed that these values are supposed to be at the threshold of visibility [11]. The three-dimensional visualization of JPEG quantization for luminance is shown in Figure 2.
Figure 2. 3D Visualization of JPEG Quantization Table for Luminance.
B. JPEG Image Compression
In order to measure the performance of a new quantization table design, a new quantization table as visual threshold shall be applied in JPEG image compression. First, the grayscale image is divided into the 8 8 size blocks, and each block of the image data is transformed by the two-dimensional DCT baseline sequential coding. Next, the transformed coefficient of each block is quantized with a quantization table independently. This process is to remove the high frequencies or discards information which is not visually significant. This quantization process indirectly reduces the accuracy of DCT coefficients in an integer representation [11]. The visualization of JPEG based line coding is given in Figure 3. In this research, a new quantization table designed based on psychovisual error threshold is proposed to replace the suggested quantization tables [12] from JPEG standard image compression.
C. Entropy Coding
Within the JPEG standard, there are two popular techniques on entropy coding which are Huffman coding and Arithmetic coding. Huffman coding is computationally simpler and easy to implement. Huffman coding is a coding technique to produce the shortest possible average code length from the source symbol set and the probability of occurrence of the symbols [13]. Using these probability values, a set of Huffman code of the symbols can be generated by Huffman Tree. Next, the average bit length score is calculated to find the average bit length of DC and AC coefficient.
D. Image Quality Assessment
In order to measure the quality of reconstruction image, the Full Error is used and calculated to analyze image reconstruction error. The image reconstruction error shall be calculated by obtaining the differences between reconstruction image , and original grayscale image , . The image reconstruction error can be defined as follows:
| , , | (5)
where the original image size is N×N and the grayscale image is represented by using 8 bits.
IV. IMAGE RECONSTRUCTION VERSUS THE AVERAGE BIT
LENGTH OF HUFFMAN CODES
In order to measure a psychovisual error threshold, the DCT coefficients on the luminance are incrementing for each frequency order. The effect of incremented DCT
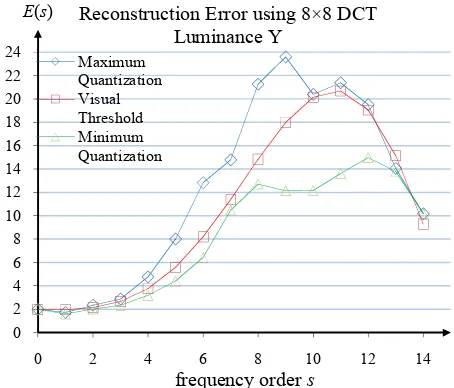
coefficient as the just noticeable difference of the compressed image from the original image is calculated by image reconstruction error. The average reconstruction error of an increment for each order shall produce a curve from order zero to fourteen. The average reconstruction error of incrementing DCT coefficients on 40 natural grayscale images is shown in Figure 4.
Figure 4. Average reconstruction error of an increment on DCT coefficient for 40 natural grayscale images.
The blue curve represents average image reconstruction error based on maximum quantization table and a green curve represents average image reconstruction error based on minimum quantization table value of each order. The average image reconstruction error scores for each frequency order from order zero until order fourteen shall produce a curve. In order to produce a psychovisual error threshold, the average reconstruction error is improved by smoothing the curve of image reconstruction errors. A red curve as shown in Figure 4 shows an ideal curve of the average reconstruction error from order zero until order fourteen. This curve can then be used to produce a new quantization table. The smooth curve of reconstruction error is interpolated by a polynomial that represents the psychovisual error threshold of the image. This model represents the visual sensitivity of DCT basis function. Refer to Figure 4, a psychovisual error threshold for DCT basis function can be defined as follows:
. . .
. . . (6)
for x = 0, 1, 2, ..., 14.
Figure3. JPEG Image Compression consists of 2-Dimensional DCT.
0 2 4 6 8 10 12 14 16 18 20 22 24
0 2 4 6 8 10 12 14
E(s)
frequency order s
Reconstruction Error using 8×8 DCT Luminance Y
Maximum Quantization Visual Threshold Minimum Quantization
Zigzag Scan
Huffman Tables Quantization
Tables Quantization
Process Entropy Coding
2D DCT
From the psychovisual error threshold of the image reconstruction error, the value of quantization table for each frequency order shall be generated. According to (6), this function can be used to generate the quantization matrices for luminance as given below:
= (7)
The average reconstruction error of an increment DCT coefficient for 40 natural and 40 graphical images based on the minimum and maximum values of JPEG quantization
Minimum Value Maximum Value Psychovisual Threshold
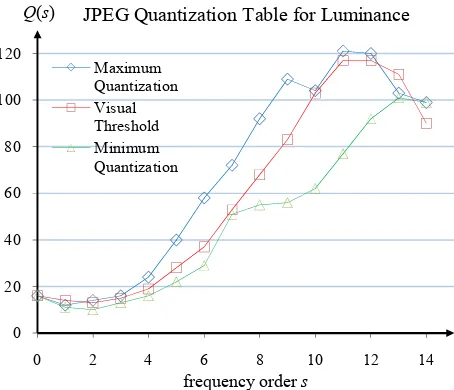
The two-dimensional visualization of JPEG quantization table and psychovisual error threshold for DCT basis function is depicted in Figure 5.
Figure 5. 2-Dimensional JPEG Quantization table for Luminance.
The green and blue curves represent the minimum and maximum values of JPEG quantization table respectively. The red curve marks the new quantization table generation based on psychovisual error threshold for DCT basis function. According to the principle of psychoacoustics, human receptor is more sensitive to changes in (low order frequency) sound such as a whisper. This psychovisual model takes into consideration of the human eyes which is more sensitive to low order frequency image than to constant image pattern. The sensitivity of the human eye is represented by a psychovisual error threshold at low order signals.
In order to prove the effectiveness of psychovisual threshold on DCT basis function, a new quantization table generation from psychovisual threshold is applied in image compression. The comparison results of average bit length of Huffman code based on JPEG default quantization table and new quantization tables from psychovisual error threshold are presented in Table II and Table III.
TABLE II
AVERAGE BIT LENGTH OF HUFFMAN CODE USING JPEG QUANTIZATION TABLES AND NEW QUANTIZATION TABLES BASED ON
PSYCHOVISUAL ERROR THRESHOLD FOR 40REAL IMAGES
Image
Measurement quantization table 8×8 JPEG 8×8 JPEG quantization table from psychovisual threshold DC luminance 5.7468 5.7468
AC luminance 2.8680 2.7966 TABLE III
AVERAGE BIT LENGTH OF HUFFMAN CODE USING JPEG
QUANTIZATION TABLES AND NEW QUANTIZATION TABLES BASED ON
PSYCHOVISUAL THRESHOLD FOR 40GRAPHICAL IMAGES
Image
Measurement quantization table 8×8 JPEG 8×8 JPEG quantization table from psychovisual threshold DC luminance 5.5236 5.5236
AC luminance 2.9992 2.9637
The quality image reconstruction using default JPEG quantization table and new quantization table from a ON PSYCHOVISUAL ERROR THRESHOLD FOR 40REAL IMAGES
Image
Measurement quantization tables 8×8 JPEG 8×8 JPEG quantization tables from psychovisual threshold Full Error 4.3724 4.3647
Measurement quantization tables 8×8 JPEG 8×8 JPEG quantization tables from psychovisual threshold Full Error 4.2145 4.1639
MSE 55.3687 53.4583 PSNR 32.4468 32.5719
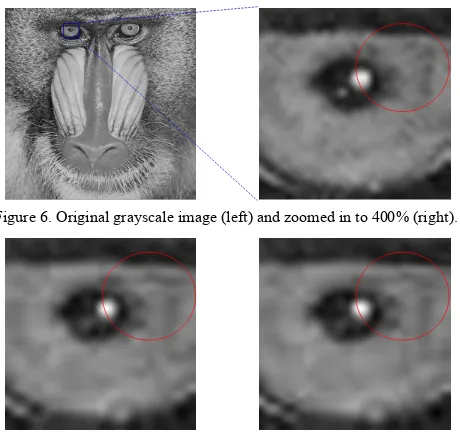
In order to inspect visually the effectiveness of a new quantization table, the image reconstruction is zoomed 400% as projected on the right of Figure 6. The experiment results
0
JPEG Quantization Table for Luminance
of image compression based on new quantization table in (7) are depicted on the right of Figure 7.
Figure6. Original grayscale image (left) and zoomed in to 400% (right).
Figure7. The comparison between JPEG quantization table (left) and quantization table using psychovisual error threshold (right) zoomed in to
400%.
In this experiment, the right eye of the grayscale baboon image is zoomed in 400% as presented on the right of Figure 6. Refer to the red circle on the left of Figure 7, image compression using JPEG default quantization table through DCT produces artifact image and it results in a blurred image output when the image data was zoomed in to 400%. A visual quality of image reconstruction using a new quantization table in (7) gives better visual quality image output than the standard JPEG baseline coding but the image output is a little blurred.
V. DISCUSSION
The quantitative experiment of psychovisual threshold on 40 natural and 40 graphical grayscale images have been done. A new quantization table for luminance is proposed as a psychovisual error threshold of the grayscale images. Psychovisual threshold is an ideal just noticeable difference of the compressed image from the original image. For each frequency order, the DCT coefficients are incremented up to a maximum of JPEG quantization table value. The DCT coefficients are incremented concurrently for each frequency order. The effect of an incrementing DCT coefficient is measured by calculating the average reconstruction error score for 40 natural images and 40 graphical images.
The experimental results show that a JPEG image compression using a new quantization table from a psychovisual error threshold provide better quality at lower average bit length of Huffman code than standard JPEG image compression. The effect of incrementing DCT coefficient has been explored from the experiment. The error reconstruction from incremented DCT coefficients are concentrated more in the middle frequency of the image signals. For the future research, a psychovisual error
threshold can be used to determine the output quality of image compression based on user preference.
VI. CONCLUSION
The JPEG quantization table has been a popular and heavily utilized as a default quantization in digital image compression over the last decades. JPEG quantization tables are produced from a series of psychovisual experiments to determine the visual sensitivity of the human eye. The effect of an increment DCT coefficient has been investigated to explore the human eye sensitivity to the image. A psychovisual error threshold a mean to generate the quantization table has been proposed for grayscale image compression. The experimental results show that a new quantization table from an ideal psychovisual error threshold produces better image quality and at the same time produce a lower average bit-length of Huffman codes on real and graphical images.
ACKNOWLEDGMENT
The authors would like to express a very special thanks to Ministry of Higher Education (MOHE), Malaysia for providing financial support for this research project by
Fundamental Research Grant Scheme
(FRGS/2012/FTMK/SG05/03/1/F00141).
REFERENCES
[1] J.D. Kornblum, "Using JPEG Quantization Tables to Identify Imagery Processed by Software," Digital Investigation, Elsevier, Vol. 5, Sep. 2008, pp. 021-025.
[2] A. Almohammad, G. Ghinea and R.M. Hierons, "JPEG Steganography: A Performance Evaluation of Quantization Tables," International Conference on Advanced Information Networking and Applications, May 2009, pp. 471-478.
[3] D.M. Monro and B.G. Sherlock, "Optimum DCT Quantization," Proceeding of Data Compression Conference (DCC), Mar. 1993, pp. 188-194.
[4] Y. Jiang and M.S. Pattichis, "JPEG Image Compression using Quantization Table Optimization based on Perceptual Image Quality Assessment," 45th Asilomar Conference on Signal, Systems and
Computers (ASILOMAR 2011), Nov. 2011, pp. 225-229.
[5] M. Crouse and K. Ramachandran, "JPEG Optimization using an Entropy Constrained Quantization Framework," Proceeding of Data Compression Conference, Mar. 1995, pp. 342-351.
[6] K. Guo and Lai-Man Po, "A New Partial Codeword Updating Scheme based on Rate Distortion Optimization for Adaptive Vector Quantization," International Conference on Multimedia and Expo, July 2007, pp. 751-754.
[7] W. Jiang, J. Sun and J. Wang, "Rate Distortion Optimization Trellis Coded Quantization," International Conference on Multimedia and Expo, July 2007, pp. 468-471.
[8] K. Ramchandran, and M. Vetterli, "Rate Distortion Optimal Fast Thresholding with complete JPEG/MPEG Decoder Compatibility," IEEE Transaction on Image Processing, Vol. 3, No. 5, Sep. 1994, pp. 700-704.
[9]
Al Bovik, "The Essential Guide to Image Processing," Elsevier Press, 2009, pp. 429-432.
[10] N. Ahmed, T. Natrajan and K. R. Rao. "Discrete Cosine Transform," IEEE transaction on Computers, Vol. 23, No. 1, Jan. 1979, pp. 90-93. [11] W.B. Pennebaker and J.L. Mitchel, "JPEG still image data
compression standard," Springer, New York, USA, 1992.
[12] H. Lohscheller, "A Subjectively Adapted Image Communication System," IEEE Transaction on Communications, Vol. 32, No. 12, Dec. 1984, pp. 1316-1322.