National Conference in Mechanical Engineering Research and Postgraduate Studies (2ndNCMER 2010) 3-4 December 2010, Faculty of Mechanical Engineering, UMP Pekan, Kuantan, Pahang, Malaysia; pp. 336-347 ISBN: 978-967-0120-04-1; Editors: M.M. Rahman, M.Y. Taib, A.R. Ismail, A.R. Yusoff, and M.A.M. Romlay ©Universiti Malaysia Pahang
336
A CASE STUDY OF OCCUPANT ENVIRONMENTAL COMFORT AT AUTOMOTIVE ASSEMBLY WORKSTATION
1A.R. Ismail,2N. Jusoh,3A.P. Puvanasvaran and1M.S. Reza
1
Faculty of Mechanical Engineering, Universiti Malaysia Pahang 26600 Pekan, Pahang, Malaysia
Phone: +609-4242268, Fax: +609-4242202 Email: [email protected], [email protected]
2
Department of Mechanical and Material Engineering
Faculty of Engineering and Build Environment, Universiti Kebangsaan Malaysia 43600 UKM Bangi, Selangor, Malaysia
3
Faculty of Manufacturing Engineering Universiti Teknikal Malaysia Melaka (UTeM)
Ayer Keroh, 75450 Melaka, Malaysia E-mail: [email protected]
ABSTRACT
The environmental factors assessment in the building has become a popular research area over the past decade. However, how the service life of a building affects the results of the environmental assessment of a building has not been emphasized previously. The aim of this study is to analyze how structural solutions and building design affect the results of the environmental assessment. Furthermore, how the environmental factors affects the productivity is analyzed. The environmental assessments in building were calculated for this study by Environment Factors Equipment. The current situation and the future of the environmental assessment of buildings are discussed. In addition, topics for further research are suggested which is the environmental impact of an occupant should be studied. The research concludes that comfort and productivity in the workplace is related more to design factors.
Keywords: Comfort, environmental affect, productivity
INTRODUCTION
When people discuss comfort relating to their daily life experiences, comfort normally implies something positive. Though, Branton (1969) did not fully agree with this, stating that comfort does not necessarily entail a positive effect. Corlett and Bishop (1976) defined industrial comfort as; “a threshold level below which the operator would not be distracted from his work”. They use pain synonymously with discomfort and suggested that contributing discomfort factors are posture and effort.
As we known, one of the most concerned issues in our modern society is the health condition and environment factors could make relatively great contribution to people’s health. We have created more comfortable and safe working and living conditions and facilities to protect the health of public, and we have produced more types of qualified goods for us to use but Fanger (1970) reminds us that the feeling of climate comfort is subjective and differs between individuals. So, unfortunately it is possible that different persons will have totally opposite opinions about the degree of comfort experienced. Furthermore, Reynolds (1993) stated the perception of comfort may also change over time. The goal and target of study is to test the influence of the differentiations in environment to workers perception.
METHODOLODY
One of the aspects of this field study is to study the environment factors in Hicom Yamaha Manufacturing Malaysia Sdn. Bhd. This environmental study is being done to study the effect of environmental factors in workers daily work. This study is important because by having environmental data, we may know that whether the workers’ productivity and efficiency are being affected by current environment at their workplace. We can also compare the data that we get from this study to analyze on workers health problem whether the current working environment has resulted on them being unhealthy.
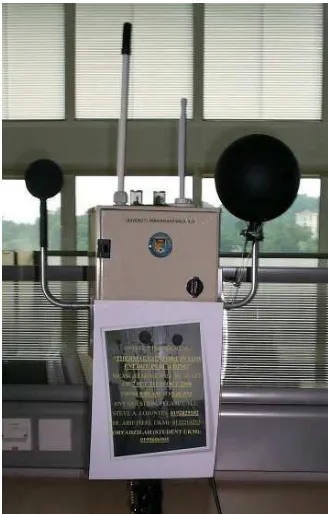
By using the Environment Factor Equipment designed by UKM as illustrate as Figure 1, we collect several environmental data for six hours at Final Inspection Workstation. Among the data that we collect using this equipment are carbon dioxide (CO2)
National Conference in Mechanical Engineering Research and Postgraduate Studies (2ndNCMER 2010)
3-4 December 2010, Faculty of Mechanical Engineering, UMP Pekan, Kuantan, Pahang, Malaysia ; pp. 336-347 ISBN: 978-967-0120-04-1; Editors: M.M. Rahman, M.Y. Taib, A.R. Ismail, A.R. Yusoff, and M.A.M. Romlay ©Universiti Malaysia Pahang
338 Time CO2 Pressure Humidity
Wind
speed Temperature Sound Lux
Globe Temperature
Production
Output (unit) Remark
10:40:58 775.313 103.327 74.3 0.092 32.141 63.09 89.3 30.053 0 rest
10:50:58 687.5 103.327 72.643 0.193 31.919 78.91 69.8 30.164 7
11:00:58 663.75 103.358 70.263 0.254 31.975 76.24 64.3 30.219 15
11:10:58 640.625 103.358 69.174 0.325 31.869 62.29 45.9 30.219 14
11:20:58 639.063 103.327 68.287 0.236 31.963 79.29 65 30.275 15
11:30:58 636.563 103.358 67.863 0.191 32.078 68.45 69.7 30.386 14
11:40:58 632.813 103.327 68.244 0.135 31.744 75.67 65.6 30.275 13
11:50:58 621.563 103.358 71.773 0.662 31.419 74.01 65.5 30.164 15
12:00:58 614.688 103.374 75.272 0.718 30.716 73.93 70.8 29.664 15
12:10:58 620.938 103.327 75.526 0.518 30.344 71.26 88.1 29.108 15
12:20:58 615.313 103.296 74.704 0.699 30.175 75.65 116.6 28.775 14
12:30:58 610.938 103.296 75.497 0.466 30.316 77.7 193.5 28.608 16
12:40:58 611.875 103.28 77.717 0.383 30.628 73.26 260.1 28.664 15
12:50:58 604.688 103.233 74.929 0.204 31.163 76.81 368.7 29.053 15
13:00:58 593.125 103.233 72.506 0.458 31.734 73.93 394.4 29.719 14
13:10:58 591.25 103.171 66.513 0.595 32.731 61.68 372.7 30.553 0 rest
13:21:05 591.25 103.171 66.513 0.595 32.731 61.68 372.7 30.553 0 rest
13:30:58 607.5 103.124 63.842 0.398 33.297 62.83 295.5 31.886 0 rest
13:40:58 590 103.124 63.144 0.649 33.287 61.93 148.8 32.164 0 rest
13:50:58 582.5 103.124 62.071 0.148 33.319 73.47 194.1 32.108 7
work start at 13.45
14:00:58 580 103.092 59.753 0.714 33.275 75.42 149 32.164 15
14:10:58 580.313 103.077 58.807 0.406 33.597 74.77 213.6 32.275 14
14:20:58 575.938 103.077 54.953 0.206 33.734 78.88 166.5 32.441 14
14:30:58 577.188 103.014 56.707 0.222 33.825 71.66 241.3 32.553 15
14:40:58 565.938 103.045 54.056 0.239 34.009 79.17 268.3 32.775 15
14:50:58 564.375 102.998 53.756 0.271 34.266 76.72 137.6 32.997 14
15:10:58 560.625 102.967 56.042 0.221 33.616 74.29 50.9 32.719 15
15:20:58 549.688 102.967 56.622 0.149 33.222 78.78 77.2 32.386 15
15:30:58 559.063 102.967 59.508 0.106 32.813 85.3 59.1 31.942 14
15:40:58 557.5 102.967 60.291 0.17 32.244 61.7 118 31.442 0 rest
15:50:58 554.688 102.967 62.919 0.245 32.503 74.65 134.3 31.164 12
16:00:58 561.875 102.967 61.494 0.275 32.731 71.9 158.4 31.219 15
16:10:58 565.625 102.967 59.186 0.101 33.016 73.1 157.6 31.497 15
16:20:58 557.188 102.998 58.742 0.288 32.859 72.1 135.2 31.664 16
16:30:58 555.313 102.951 58.034 0.245 32.759 71.77 134.7 31.608 15
16:40:58 560.313 102.967 59.117 0.413 32.756 72.51 124.5 31.553 15
National Conference in Mechanical Engineering Research and Postgraduate Studies (2ndNCMER 2010) 3-4 December 2010, Faculty of Mechanical Engineering, UMP Pekan, Kuantan, Pahang, Malaysia; pp. 336-347 ISBN: 978-967-0120-04-1; Editors: M.M. Rahman, M.Y. Taib, A.R. Ismail, A.R. Yusoff, and M.A.M. Romlay ©Universiti Malaysia Pahang
340
Figure 1: Environment Factors Equipment
RESULTS AND DISCUSSION
The table above shows the overall pattern of the result which in this case is an acceptable, normal and harmless condition of environment. However, upon analyzing and comparing with actual environmental standard, we found out several variables might ergonomically being close to exceed the standard. The detail of each situation is being explained by each graph below.
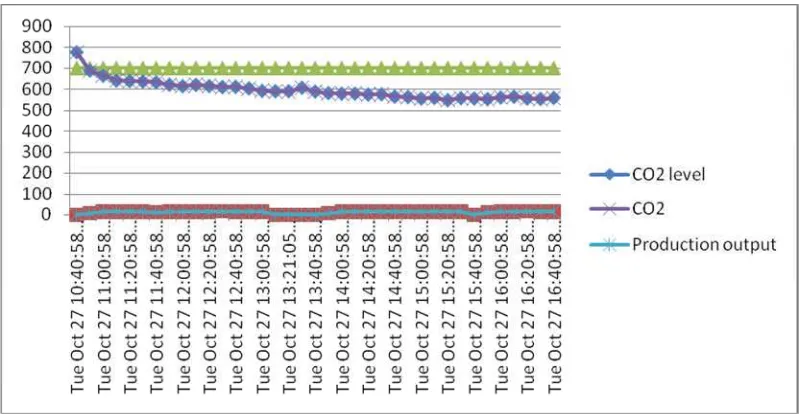
According to American Society of Heating, Refrigerating and Air Conditioning Engineers Inc (ASHRAE), the permissible CO2level for workplace should be below than
700ppm. As presents as Figure 2, we can compare to the data that we gathered, the highest reading was 775 ppm where the amount of CO2is above the permissible level. This is due
to the fact that during that time, the product tested was 2 stroke cylinder engines. As we know, 2 stroke cylinder engines produce more CO2 compared to 4 stroke cylinder engines.
That is because after the testing process for the 2 stroke cylinder engines completed at approximately 10.50 am, the level of CO2 begins to decrease. The reason is they were
Figure 2: Comparison production output and CO2assessment in Final Inspection
Workstation
Based on a report published by US Environmental Protection Agency and US Department of Health and Human Services on Building Air Quality, air pressure level is being described as the air quantity that is supplied to and removed from a room. If more air is supplied than exhausted, the excess air leaks out of the space and the room is to be under
positive pressure. Meanwhile, negative pressure indicates that less air is supplied than
exhausted; theair is pulled in to the room. The Figure 3 shows the air pressure throughout the six hours period is constant at 103 N/m2. Although this figure seems quite high, it does not affect workers productivity if we compare it to production output during that period of time.
342
Figure 3: Comparison production output and pressure assessment in Final Inspection Workstation
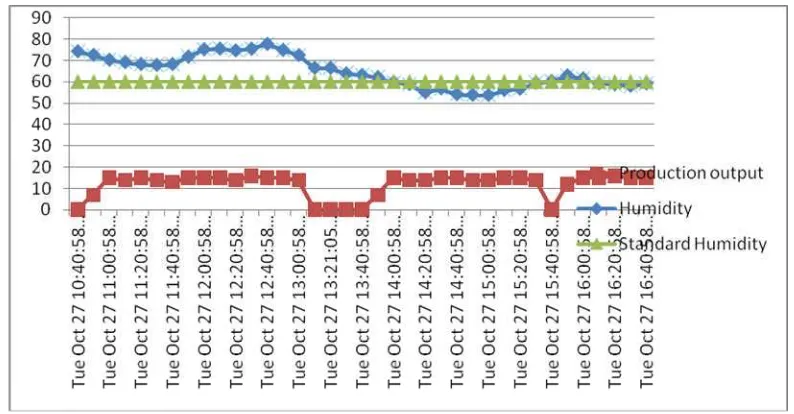
Figure 4: Comparison production output and humidity assessment in Final Inspection Workstation
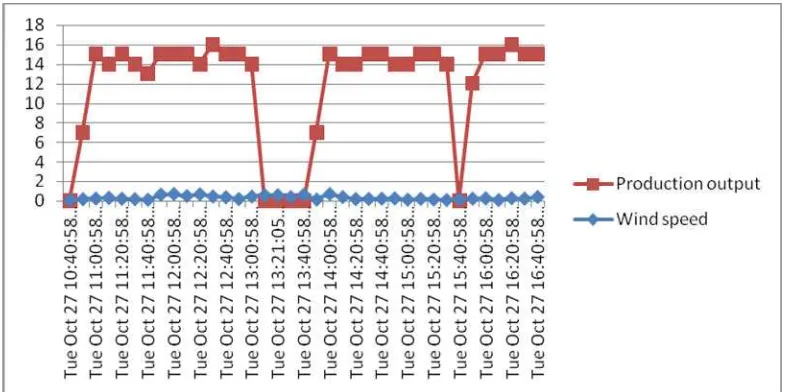
on our data represented by the Figure 5, the wind speed varied throughout the six hours period. This might be caused by the industrial fan located nearby the equipment and also due to the rain. However, in this case, wind speed did not affect the productivity of the workers since they were producing constant output throughout the six hours period of study.
Figure 5: Comparison production output and wind speed assessment in Final Inspection Workstation
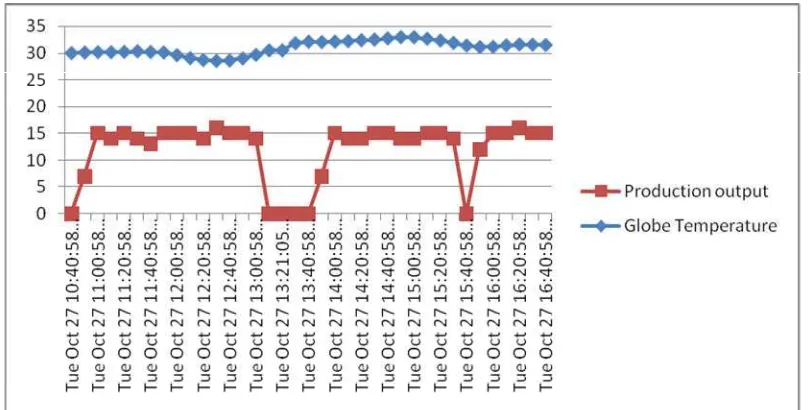
According to ASHRAE, the recommended room temperature should be from 19oC and 26 oC. However in our study, Figure 6 shows that the room temperature for Hicom Yamaha is in range of 30 oC to 33 oC. This data presents that the workers might experience unwanted heat due to the temperature of their working place. The effort of the management of Hicom Yamaha to provide industrial fan in the workplace might help in reducing humidity of the area but did not help in stabilizing the room temperature of that area.
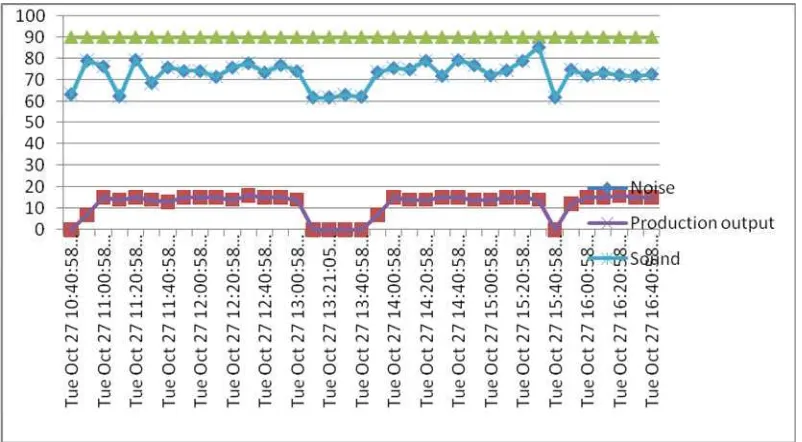
According to OSHA standard, the permissible exposure durations for various sound pressure levels are 8 hours for 90 db. Figure 7 provides the comparison production output and sound assessment in Final Inspection Workstation. Since Hicom Yamaha workers at Final Inspection area only exposed to average 80 db and their normal working hour is around 8.5 hours per day, therefore we can assume that the amount of sound being exposed to the workers is acceptable according to OSHA standard. However, we did feel for Quality Inspection workers who had to absorb consistent noise during the engine testing period although we did not manage to get the data for that working area. Therefore for future study we would like to measure the sound level in that area.
344
lamp placed at that area. Therefore we can conclude that the luminance provided for the workers to perform their function is not according to standard and the Hicom Yamaha management might need to improve their lighting system or luminance flow.
Figure 6: Comparison production output and temperature assessment in Final Inspection Workstation
Figure 8: Comparison production output and illuminantion assessment in Final Inspection Workstation
Globe temperature is different from room temperature because globe temperature reduces the risk of the heat strain. Normally, the reading should be 1 -2oC difference compared to room temperature. In this case, based on the Figure 9, we can see that globe temperature differ from room temperature by 1 -2oC.
346 CONCLUSION
The number of eight workers has been interviewed during the study. Range of the subjects working at the workstation is from 3 months to more than 5 years with age from 23 to 35 year old. All of subjects agreed with the statement that they are not having health affection while working at this workstation. They also rated that overall condition at working area is satisfactory.
From management side, ergonomics is part of their consideration when dealing with man, machine and methodology, material and working environment. Example of industrial ergonomics related activities currently being implemented are:
Continuous training to all workers on environmental, safety and health.
Health check to all workers at least once a year.
Conduct periodical 5S and Safety audit to ensure all working area are in good condition at all situation and to identify any improvement required.
Space of working areas for a subject decided based on recommendation by R&D Division at Head Quarter, Japan.
Employee Suggestion Scheme where employees are encouraged to give a suggestion to management for any improvement from quality, cost, delivery, safety and morale point of view. The practical suggestion will be implemented by management and reward will be given.
However, there are rooms for improvement can be implemented to improve industrial ergonomics at working area such as improvement of man-machine interaction which to provide more effective instruction to workers when dealing with machines. When industrial ergonomics were in place when necessary, it will helps organization obtained a benefits by:
Reduction of machine downtime due to proper man machine interaction.
Productivity improvement when workers comfortable with the working area.
Reduction of product rejection when workers able to give full concentration to their tasks.
REFERENCES
ASHRAE Standard 55-1992: Thermal environment conditions for human occupancy. ASHRAE, Atlanta.
Branton, P., 1969. Behavior, body mechanics, and discomfort. In: Grandjean, E. (Ed.), Sitting Posture. Taylor & Francis, London.
Corlett, E.N., Bishop, R.P., 1976. A technique for assessing postural discomfort. Ergonomics 19 (2): 175-182.
Fanger, P.O., 1970. Thermal comfort. Danish Technical Press, Copenhagen.
Hedberg, G., 1987. Epidemiological and ergonomical studies of professional drivers. Arbete och Halsa 9, Arbetarskyddsverket, Solna, Sweden.
Hertzberg, H.T.E., 1972. The human buttock in sitting: pressures, patterns and palliatives. American Automobile Transactions 72: 39-47.
OSHA Standard (Occupational Safety and Health Standards), United States Departments of Labor, http://www.osha.gov/index.html
Reynolds, H.M., 1993. Automotive seat design for sitting comfort. In: Peacock, B., Karwowski, W. (Eds), Automotive Ergonomics. Taylor & Francis, London.
Zhang, L., Helander, M., Drury, G., 1996. Identifying factors of comfort and discomfort in sitting. Human factors 38(3): 377-389.