Fluxes of carbon, water and energy over Brazilian cerrado: an
analysis using eddy covariance and stable isotopes
A. C. MIRANDA,' H. S. MIRANDA,' J. LLOYD,^ J. GRACE,' R. J. FRANCEY,'^ J. A. MCINTYRE,' P. MEIR,' P. RIGGAN,^ R. LOCKWOOD^ & J. BRASS^
'Departmento de Fcologia, Universidade de Brasilia, 70910-900 Brasilia DF, Brazil, 'Environmental Biology, Research School of Biological Sciences, Institute of Advanced Studies, Australian National University, Box 475, Canberra, ACT 2601, Australia, ^Institute of Ecology and Resource Management, University of Edinburgh, Mayfield Road, Edinburgh EH9 3JU, UK, CSIRO Division of Atmospheric Research, Frivate Bag 1, Mordialloc, Vic 3195, Australia, ^USDA Forest Service, Pacific South-west Research Station, 4955 Canyon Crescent Drive, Riverside, CA 92507, USA, '^Ecosystem Science & Technology Branch, NASA Ames Research Centre, Moffet Field, CA 94035, USA
ABSTRACT
We present the energy and mass balance of cerrado sensu stricto (a Brazilian form of savanna), in which a mixture of shrubs, trees and grasses forms a vegetation with a leaf area index of 1-0 in the wet season and 0-4 in the dry sea-son. In the wet season the available energy was equally dis-sipated between sensible heat and evaporation, but in the dry season at high irradiance the sensible heat greatly exceeded evaporation. Ecosystem surface conductance g^
in the wet season rose abruptly to 0-3 mol m"^ s"^ and fell gradually as the day progressed. Much of the total varia-tion in gs was associated with variavaria-tion in the leaf-to-air vapour pressure deficit of water and the solar irradiance. In the dry season the maximal g^ values were only 0-1 mol m"^ s~\ Maximal net ecosystem fluxes of CO2 in the wet and dry season were -10 and -15 /Jmol CO2 m'^ s~', respectively (sign convention: negative denotes fluxes from atmosphere to vegetation). The canopy was well cou-pled to the atmosphere, and there was rarely a significant build-up of respiratory CO2 during the night. For obser-vations in the wet season, the vegetation was a carbon dioxide sink, of maximal strength 0*15 mol m"^ d~\ However, it was a source of carbon dioxide for a brief period at the height of the dry season. Leaf carbon isotopic composition showed all the grasses except for one species to be C4, and all the palms and woody plants to be C3. The CO2 coming from the soil had an isotopic composition that suggested 40% of it was of C4 origin.
Key-words: arid zone; Bowen ratio; carbon sequestration; savanna; soil respiration.
INTRODUCTION
Savannas are a major component of the worid's vegetation, covering a land surface of 15 x lO'^ m^ and accounting for
Correspondence: J. Grace, Institute of Ecology and Resource Management, University of Edinburgh, Mayfield Road, Edinburgh EH9 3JU, UK.
about 30% of terrestrial primary production (IPCC 1990). The savanna formation of South America covers 2-5 X 10'' m^ of which 2 0 x lO'^ m^ constitutes the Brazilian cerrado. In Brazil it is the second most important land cover, being exceeded only by the rain forest which is 3-5 X 10'^ m^ (Ratter 1992).
Cerrado has many physiognomic forms, ranging from the tall cerraddo (trees to a height of 20 m, resembling the woodland savanna of other continents), through the more common cerrado sensu stricto (a species-rich dense scrub of shrubs and trees, 8-10 m high, with a grass understory), to the grassland campo forms. The cerrado vegetation is markedly seasonal in phenology and is often burned, either naturally or as part of a management cycle (Coutinho 1990). Descriptions of cerrado vegetation can be found in Eiten (1972, 1992) and Bullock, Mooney & Medina (1995).
As a result of the large areas occupied by the savannas, and the cerrado in particular, they have the potential to influence the regional and possibly global energy, water and carbon balances. Cerrado has been somewhat neglected in this regard, although the Brazilian rain forest has been extensively studied (Shuttleworth et al. 1984; Shuttleworth 1988a,b; Grace et al. 1995a,b). There have been few micrometeorological studies of the energy and water balance of cerrado (Maitelli & Miranda 1991; Miranda & Miranda 1992), and no reports of their carbon balance. Yet the cerrado is under great economic pressure (Skole et al. 1994): it provides charcoal for smelting and much of the land area is likely to be converted to agricul-ture and pasagricul-ture in the fuagricul-ture.
316
A. C.Mirandaeial.
attributed to variations in light, vapour pressure deficit and stomatal behaviour of the canopy. The second objective was to examine the seasonal changes in the carbon balance of the ecosystem by making repeated measurements over the annual cycle imposed by the rainfall distribution. Such data provide the first step towards understanding the car-bon economy of this widespread vegetation type, and the contribution it makes to the carbon balance of the region as a whole.
MATERIALS AND i\/IETHODS
Site
The site is at the Reserva Ecologica de Aguas Emendadas (15°33' S, 47°36' W, 1000 m above sea-level) about 50 km from Brasilia, DF. The average annual rainfall is 1500 mm and the mean annual temperature is 22 °C (Table 1). Leaf area indices are from 0-4 in the dry season to 1 0 in the wet season (Table 2). The tree layer is about 10 m tall with Schlerolobium paniculatum being the dominant species. There is a seasonal grass layer dominated by Aristida riparia, Echinolaena inflexa and Paspalum estellatum. The vegetation at the site is an example of cerrado sensu stricto which has been protected from fire. Although fires
periodically occur in some areas near the borders of the Reserve, usually originating at neighbouring farms and roads, the area of the experiment is well protected by a vereda (a permanent grassy marsh with buriti palms, Mauritia vinifera) on the valley floor of the Reserve, about 2-3 km south-east of the study area. Despite protection, a rapid surface fire reached the experimental site in 1987, burning grasses and small shrubs but only scorching the leaves of the trees. The soil is a dystrophic, deep and well-drained red-yellow oxisol with a pH of < 5 (EMBRAPA 1987). The terrain has an inclination of less than 4°. A 12 m scaffolding tower was utilized to mount the instru-ments for the eddy covariance study.
Sensors for eddy covariance
The eddy covariance sensors for the measurement of verti-cal fluxes of CO2, H2O and momentum were mounted at 15 m above the ground on a mast at the top of the tower. In this position, it is estimated that the sensing system mea-sures fluxes over a fetch of about 500 m (Schuepp et al. 1990). The same vegetation type stretches for 3 km (from south-west) to a maximum of 6 km (north-east). The pre-vailing winds come from the north and north-east.
Month January Febuary March April May June July August September October November December Tree canopy (leaves only) Grass layer (including litter) Dicotyledons (including litter) Mean (°C) 21-4 2L0 21-4 20-7 19-4 18-4 18-3 20-4 2]-6 2 1 6
211 211 temperature 1 ( 1 1 LAI
live mass (g m"^) live LAI
dead mass (g m"') dead LAI
live mass (g m~^)
live LAI
dead mass (g m"^) dead LAI Viean kPa) •93 •98 [•94 •89 •70 •42 •22 •63 •76 •78 •97
^oo
vapour pressure Wet season (April)1 00 ±0^06 74 ±25 0 4 101 ±51 0 5 49 ±61 0 1 279 ±162 0 7 Average monthly precipitation (mm) 250 240 179 126 38 8 9 6 49 166 242 243 Dry season (September)
0^42 ±0^ 15
38 ±20
0 2
102 ± 36
0^5
30 ±24
0 1
304 ±128
[image:2.716.21.463.502.735.2]0 7
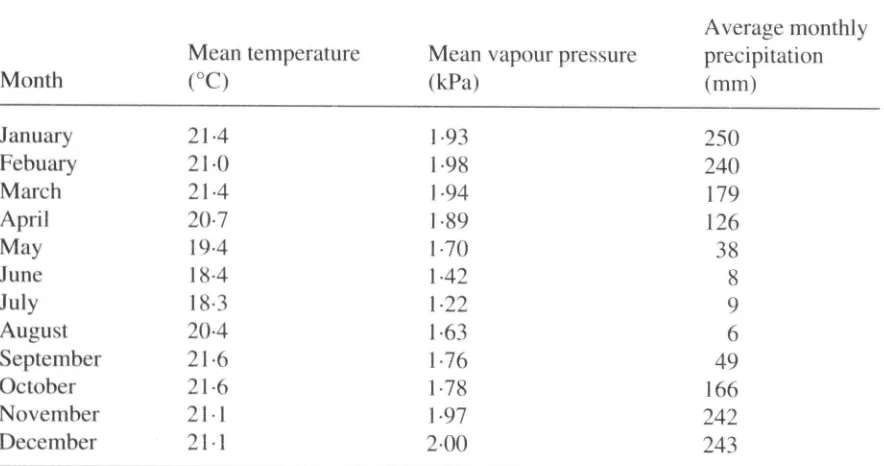
Table 1. Meteorogical conditions at Brasilia, about 50 km from the study site
Table 2. Biomass and leaf area indices (LAI) of the site (H.S. Mirand, personal communication). Biomass of grass and dicotyledonous layers was obtained from 12 samples of 0 5 m^; values given are
means ± standard deviation. Leaf area indices of grass and dicotyledonous layers were found from the biomass data; leaf area indices of the canopy were obtained from hemispherical photographs
[image:2.716.21.471.784.993.2]The eddy covariance system consisted of a fast-respond-ing closed-path infrared gas analyser to measure CO, and H2O (Li 6262, Li-Cor, Lincoln, NE, USA); a three-dimen-sional sonic anemometer to measure wind velocity and air temperature (A1002R, Solent, Lymington, UK); a pump-ing unit to draw air through 6 m of 5-5-mm-diameter tub-ing (Dekabon 1300, Deane & Co., Glasgow, UK), and a 386 laptop computer with the software EDISOL to enable the flux calculations to be made as half-hour averages in real time (Moncrieff et ai. 1997). Air was drawn by a diaphragm pump at 4 dm^^ min~' from a point 50 mm below the sonic path, passed to the sample cell of the gas analyser and vented to the atmosphere. Readings of the wind speeds and gas concentrations were made at 21 Hz, and used to compute the CO2 and H2O fluxes. Processing of the data to include the standard corrections for the eddy covariance system followed methods described elsewhere (Grace et al. 1995a; Moncrieff era/. 1997).
Meteorological instruments
Radiation sensors were installed on the top of the tower at a height of 13-5 m at the end of a 5 m sidewards extended arm. Measurements were made concomitantly with eddy flux data between 26 March and 2 May (wet season) and between 5 and 18 September (dry season) 1994. Shortwave (or solar) radiation, S, was measured with a Moll-Gorzynski solarimeter (Kipp & Zonen CM3, Delft, The Netherlands) and two pyranometers (Li 200B, Licor, NE, USA). One pyranometer was positioned facing skyward, and the other faced groundward to enable measurement of incoming and reflected solar radiation, respectively. All-wave radiation balance, net radiation (/?„), was measured with a Eunk Type radiometer (Swissteco, Melbourne, Australia). The Kipp & Zonen solarimeter was used as a secondary standard and the radiation sensors were cross-calibrated against it in the field. Soil heat flux (G) was measured as the average value from four soil heat flux discs (Solar Radiation Instruments, Melbourne, Australia) placed about 0-03 m below the soil surface. Data were collected by two data loggers (2IX, Campbell Scientific Inc., Logan, USA) every minute, and half-hourly interval averages were stored in solid memory modules (SM 192, Campbell Scientific Inc., USA).
Derived quantities
The surface roughness parameter for momentum transfer, ZoM^ was estimated according to
\n[(z - (1)
where z is the measurement height, d is the zero plane dis-placement, ii is the von Karman's constant (0 41), u is the windspeed, u* is the friction velocity and fjvj is the inte-grated momentum profile function, calculated as outlined in Grace et al. (1995a). Taking near-neutral conditions ( 'PM close to 0) and therefore assuming a logarithmic wind profile, d was first estimated by comparing the relationship
between u and u* from concurrent measurements by sonic anemometers at heights of 15 and 20 m (Lloyd, Gash & Sivakumar 1992). This yielded an estimate for d of 6-3 m and an estimate for ZOM of 1 -2 m. Taking our estimated average vegetation height /J of 9 m. this corresponds to d = 0-70 /j and Z^M = 0-13 ii. These relationships with ii are similar to those applying to other vegetation types (Monteith & Unsworth 1990).
The aerodynamic resistances for water vapour (r^y) and heat (/"JJH) transfer were calculated according to
u
^aV = (2)
where Z^H is the surface roughness parameter for heat (and water vapour) transfer and "PH is the integrated heat profile function. Based on the work of Garratt & Hicks (1973) in a similar vegetation type (woody savanna) we took ln(Zj,M/ZoH) as 2 0. "FM and "^H were calculated as outlined in the Appendix of Grace et al. (1995a). The aerodynamic conductances for heat and water vapour (g,,H and g,,v) were calculated as the reciprocals of r^n and r.,v, respectively, and are expressed here on a molar flux basis.
Ecosystem surface conductance {g^) was estimated by inversion of the Penman-Monteith equation using measure-ments of transpiration rate and vapour pressure deficit as measured by the tower instruments. Canopy surface tem-perature was calculated from the net radiation, g^ and J^^H using eqn 9 5 of Jones (1992). Canopy-to-air vapour pres-sure deficit was then estimated as the difference between the saturation vapour pressure at the estimated canopy tem-perature and the vapour pressure at the canopy surface.
Changes of CO2 concentration in the air
Vertical profiles of CO2 concentration and subsequent changes in the quantity of CO2 within the airspace between the soil surface and the measurement point on the tower were made over two 24 h periods in early May (at the start of the dry season) and in November (when the dry season had recently finished). An automatic profile sampling sys-tem as described in Grace et al. (1995a) was employed in May, sampling air through tubing every 25 min at heights of 1, 2, 4, 8 and 12 m and passing it to an infrared gas anal-yser (Leybold-Binos I; Germany). This system was not available in the dry season and five tubes of equal length and diameter were used to estimate the changes in the CO2 concentration in the air space. A pump was used to draw air at 1 dm min^ through the tubes into a 2 dm glass mixing tank and then measured by an infrared gas analyser (Li-6262, Li-Cor, Lincoln, NE, USA). Data were taken every minute and half-hour averages were stored by using a data logger (2IX; Campbell Scientific Inc., USA).
Carbon isotopic composition of cerrado CO2
318
A. C.Mirandaeial
(1-2 May 1993 and 1-2 November 1993). Whole air
sam-ples, pre-dried by passage through anhydrous magnesium
perchlorate, were collected at each height for each time, in
0-5 dm-^ Pyrex glass cylindrical flasks with Teflon O-dng
valves at each end (Glass Expansion P/1, Melbourne,
Australia).
The flask and accompanying Flask Pump Unit (FPU)
were developed at CSIRO Division of Atmospheric
Research's GASLAB (Global Atmospheric Sampling
Laboratory) as part of a global sampling network for trace
gas isotopes and composition (Francey
et al.
1990). Recent
developments, employed in the Brazilian operation,
included careful selection and a rigorous pre-treatment
pro-tocol for all surfaces in contact with sample air, permanent
exclusion of water vapour from flasks and restricted
expo-sure of samples to sunlight. Samples were collected by
flushing for 10 min at 4 dm"^ min"', then pressurizing flasks
to 100 kPa above ambient pressure. On return to GASLAB,
samples were routinely analysed by gas chromatography
for the concentrations of CO2, CH4, CO, H2 and N2O, and
by ratio isotope mass spectrometry of extracted CO2 for the
isotope ratios 5'^C and 5'^O. Only CO2 concentration and
CO2 isotopic data are reported in this paper.
In the analysis, CO2 in about 10 cm^ of air is converted
to CH4 and measured on a modified CARLE (S Series) gas
chromatograph with flame ionization detector. CO2
con-centrations are linked to the WMO international
calibra-tion scale via CMDL/NOAA Laboratories (Boulder, CO).
Measurement precision over the concentration range
250-400 ppmv is < 0-1%. Isotopic analysis involves a
Finningan MAT252 ratio isotope mass spectrometer with
modified MT Box-C trapping accessory for the cryogenic
extraction and injection of CO2 to the mass spectrometer.
About 30 cm"* of air is required for one
d^^C
determination.
A description of the facility is given by Allison
et al.
(1994a,b). The external precision for the ^'-^C
determina-tion from the GASLAB/FPU flask samples is estimated to
be 0-02%.
The interpretation of the isotopic results depends on the
fact that the product of isotopic ratio (8) and concentration
(C) is an additive quantity (Tans 1980). Assuming a
uni-form source (or sink) of CO2 of isotopic composition ^
with a infinite background atmospheric reservoir, a simple
mixing process gives:
= 4 + --
(3)where
M
is a constant (related to the difference between
atmospheric and source air isotopic composition), fi, is the
isotopic composition of canopy air and C^ is the associated
CO2 partial pressure.
Plant dry matter analyses
In May 1993, leaves of 50 species of plants growing
around the tower were sampled for stable carbon isotopic
composition and leaf nitrogen concentrations. Samples
were taken from as many plants of each species as possible
and pooled for analysis. The leaves were oven-dried at
80 °C until constant mass and then ground; dry samples
usually exceeded 5 g.
Plant dry matter carbon isotope composition was
determined on finely ground samples of 0-6 ± 0 2 mg.
Samples were combusted in an elemental analyser (Carlo
Erba 1108, Italy) to separate chromatographically CO2
which was then analysed by continuous flow isotope
spectrometry using a VG Isomass Spectrometer. Total
leaf nitrogen content was also determined using the
ele-mental analyser.
RESULTS
The results depended markedly on the seasonality of the
environment. The weather conditions for the nearby
mete-orological station of Brasilia are shown in Table 1.
Ninety-flve per cent of the 1500 mm annual rain normally falls in
the wet season, between 1 October and April.
Energy balance
The relationship between solar radiation and net radiation
(Fig. 1) is approximately linear, the slope being marginally
higher in the dry season (0-88) than in the wet season
(0-80). Solar radiation was, overall, somewhat lower in the
dry season, due to natural and anthropogenic fire in the
region.
It is useful to compare the net radiation with the sum of
sensible and latent heat, to assess the 'closure' of the
energy balance, namely:
Rn-'^E-H-G-dW/dt = O
(4)
In the present study, the flux to the soil G and to the
biomass store
dW/dt
was negligibly small (10% of any
hourly value), and somewhat variable from place to place.
Ignoring these terms, closure of the energy balance (the
condition when
R^ = XE -\- H)
was tested by plotting net
radiation against the sum of sensible and latent heat flux.
This relationship was linear and data points fell around the
1:1 line, consistent with 'closure' (not shown).
The partitioning of radiation between sensible heat
H
and evaporation
XE
was different between the seasons. In
the wet season,
H
and
XE
were roughly equal and linear
with solar radiation
S
(Fig. 2). In the dry season, however,
XE
was linear with
S
only
io S =
200 W m"^. Thereafter,
HIXE
(the Bowen ratio) declined as the response of AE to 5
diminished (Fig. 2).
Mass fluxes and associated conductances
The fluxes of water and carbon were closely related to
each other, and to the diurnal cycle of solar radiation. We
concentrate first on the wet season, using 17/18 April as
an example (Fig. 3). On this sunny day, incoming
radia-tion rose sigmoidally to a peak of about 1000 W m~^, and
the air temperature rose from a pre-dawn value of 20 °C
to 28 °C at noon. At this time, canopy temperature was
Chuva Seca
CD
800
600
400
200
--200
800
600
400
-200
-200
0 200 400 600 800 1000 0 200 400 600 800 1000
[image:5.711.121.596.78.341.2]Incoming solar radiation (W m "^)
Figure 1. The relationship between solar and net radiation in the chuva (wet season) and seca (dry season). Data points are half-hour averages. The equations fitted to the data are: R^ = 0-80 S - 44-6 ( r = 0-98) and R^ - 0-88 5 - 61 -6 ( r = 0-95), respectively.
Chuva Seca
~\ r
200 400 600 800 1000
7 I
200 400 600 800 1000
Incoming solar radiation (W m")
Figure 2. The relationship between incoming solar radiation and the main components of the energy balance, the sensible heat ( • ) and the latent heat (V or A) in the chuva (wet season) and seca (dry season).
6 °C above air temperature, and canopy-to-air vapour pressure difference had increased from 0 at pre-dawn to 30 mmol moP' in the early afternoon. As for fluxes of carbon and water, the sign convention used here is that negative fluxes denote a downward flux from atmosphere to canopy. The carbon dioxide efflux from the canopy at night averaged about 5 /imol m"^ s~', and exhibited little variability at night (between 2200 and 0400 h. Fig. 3^ By day, the fluxes into the canopy were -15 //mol m"^" s" , reaching their maximum near the middle of the day and closely following radiation. The corresponding ecosys-tem surface conductance, derived from the
Penman-Monteith equation, was close to zero by night, rising to 0 2-0-4 mol m"^ s^' by day, in parallel with radiation and vapour pressure deficit.
[image:5.711.121.597.443.706.2]320 A. C. Miranda et al.
1000
1400 0000
Time of day
[image:6.716.25.340.64.526.2]2000
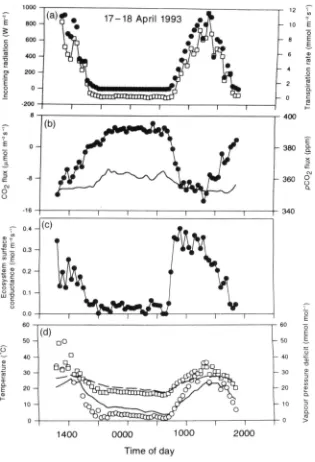
Figure 3. Water vapour and carbon dioxide fluxes in the wet season, 17-18 April. Symbols: • is incoming solar radiation in (a), COT flux in (b) and ecosystem surface conductance in (c); D is transpiration rate in (a) and canopy-to-air vapour pressure deficit in (d); O is canopy temperature; is partial pressure of CO2 (PCO2) at the top of the tower in (b) and air temperature in (d); is the saturation humidity deficit.
Conductances
(g^
and
g^)
and coupling to the
atmosphere
Irrespective of the time of the year, ecosystem surface conductance g^ increased with incoming solar radiation and decreased "wilVv caT\op^/-\.o-a\r vapour pressure
differ-ence (Fig. 5). Comparison of wet and dry season data shows that one of the marked differences between the seasons was that leaves within the cerrado canopy were exposed to different 'environmental spaces'. During the dry season canopy-to-air vapour pressure differences were much higher, but incoming radiation was lower than in the wet season. The lack of substantial overlap in 'environmental space' makes it difficult to determine whether there was any systematic difference in stomatai response to the environment. Nevertheless, there is no indication that the ecosystem surface conductances were reduced in the dry season below levels which would be expected on the basis of higher canopy-to-air vapour pressure differences.
The aerodynamic conductances were an order of magni-tude larger than the ecosystem surface conductances, with lower values at night caused by lower wind speed and sta-ble meteorological conditions (Fig. 6).
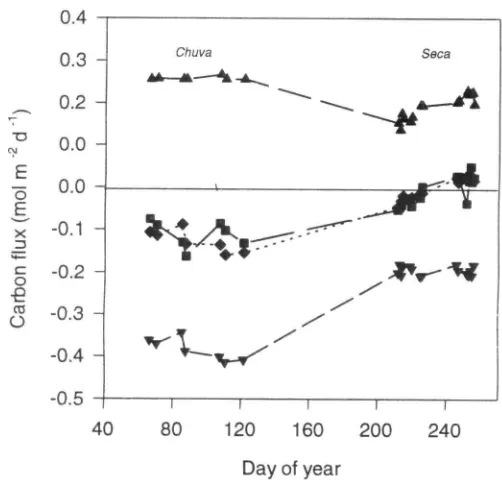
Carbon fluxes
Inspection of the data set from which these examples are drawn, and integration of the areas under the curves from data like those presented above, allow seasonal trends in photosynthesis, respiration and net ecosystem flux of cer-rado to be examined. To estimate respiration from soil and non-photosynthesizing plant tissue during the day, we first examined the relationship between night time carbon efflux (mostly originating in the soil, Meir et al. 1996) and air temperature (Fig. 7). Respiration is higher in the wet season. This illustrates a clear temperature dependence of CO2 efflux for the dry season, though data obtained during the wet season were less definitive in this respect. To allow for higher respiration rates during the day, as a
conse-12
f-2-3 September 1993
I 1 1 1 1
1400 0000 1000
[image:6.716.378.692.429.885.2]Time of day
Figure 4. Water vapour and carbon dioxide fluxes in the dr>' season, 2-3 September. Symbols: • is incoming solar radiation in (a), CO2 flux in (b) and ecosystem surface conductance in (c); D is
transpiration rate in (a) and canopy-to-air vapour pressure deficit in (d); O is canopy temperature; is partial pressure of CO2 (PCO2)
at the top of the tower in (b) and air temperature in (d); is the saturation humidity deficit.
Chuva
[image:7.711.95.644.79.446.2]Seca
Figure 5. Ecosystem surface conductance plotted against solar iiTadiance and canopy-to-air vapour pressure deficit in the chuva (wet season) and seca (dry season in September).
Chuva
Seca
o
o c ra o
T3
c
o o o
E CO
Windspeed (m s"')
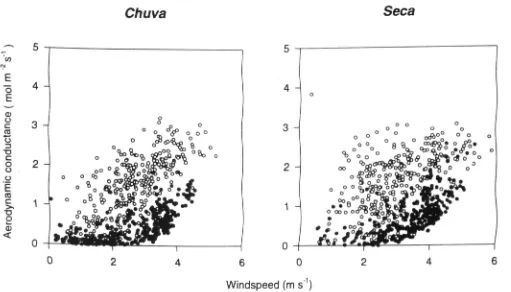
Figure 6. Aerodynamic conductance plotted against wind speed. Solid points denote nocturnal conditions in the chuva (wet season) and seca
(dry season).
quence of higher temperatures, we fitted the relationship obtained by Lloyd & Taylor (1994) to the data. This rela-tionship approximates to a straight line over such a restricted range of temperatures. This gave estimates of respiration rates at 15 °C of 1-6 and 2-3 ^mol m"^ s""' for dry and wet seasons, respectively. Using the derived dependence of respiration on air temperature, we then approximated half-hourly canopy photosynthetic rates by
subtracting the estimated respiration value from the net ecosystem flux. The derived seasonal patterns in daily totals of photosynthesis, respiration and net ecosystem flux are shown in Fig. 8. On most measurement days during the dry season the cerrado was a weak source of CO2, whilst during the wet season it was a substantial sink.
[image:7.711.105.616.511.803.2]322 A. C. Miranda et al.
14 22 24
[image:8.716.64.298.59.297.2]Air temperature (°C)
Figure 7. Nocturnal respiration as a function of temperature. The curves are the model of Lloyd & Taylor (1994) fitted to the data from the wet season (A) and dry season ( • ) .
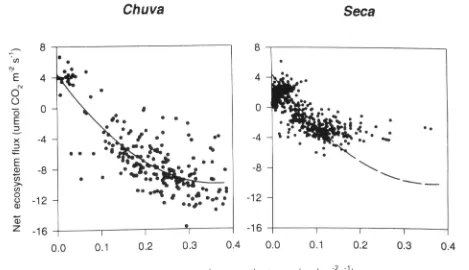
curves are usually showti for a leaf (Fig. 9). The curves illustrate a difference between the wet and dry periods, both in initial slopes and the point at which light saturation occurs. From fitted hyperbolic equations we obtained val-ues for Frcsp (the average rate of ecosystem respiration in the dark) of 2-8 ;Umol m"^ s"' for the wet season and 2-1 /jmol m"^ s"' for the dry season. More marked was the variation between seasons in the maximal rate of net ecosystem photosynthesis: it declined from about -12 /^mol m^^ s ' during the wet season to - 4 ^mol m~- s"' during the dry season. There was, however, only a small effect of season of measurement on the ecosystem light compensation point (the value of solar radiation at which Fne, = 0), this being 87 W m"^ during the wet season and 99 W m "^ during the dry season. Similarly, the effect of season on the initial slope of the light response curve (a, the apparent quantum efficiency) was also markedly less than for the light-saturated rate, being estimated as 68 mol photon mol"' CO2 during the wet season and 77 mol pho-ton mol ' CO2 during the dry season. Examination of the relationship between ecosystem surface conductance and net ecosystem carbon flux (Fig. 10) showed there to be lit-tle difference between seasons in the relationship at low g^. When the curve fitted to the wet season data is superim-posed upon the dry season data it fits moderately well. This suggests that at least part of the lower daytime net ecosys-tem fluxes during the dry season were attributable to lower ecosystem surface conductances.
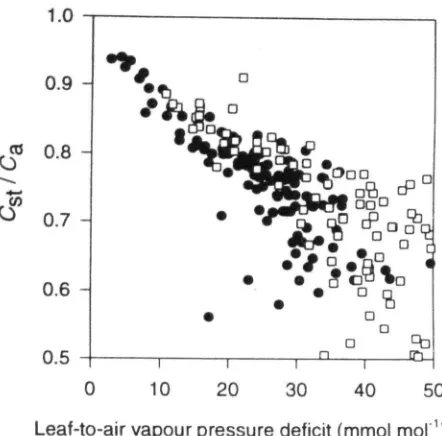
In order to examine further the interactions between the concurrent changes in ecosystem surface conductance and net ecosystem fluxes, we estimated bulk canopy values of the ratio of CO2 partial pressure in the sub-stomatal cavity to that in the ambient air ( Q ) according to = 1 - 1 - 6 /\/(Ca g^, where A was calculated estimat-ing the daytime respiration as described above. This showed that there was only a small effect of season on the relationship between CJC^ and canopy-to-air vapour pres-sure difference (Fig. 11). If anything, at a given
canopy-to-air vapour pressure difference values of Q / Q were higher during the dry season than in the wet season.
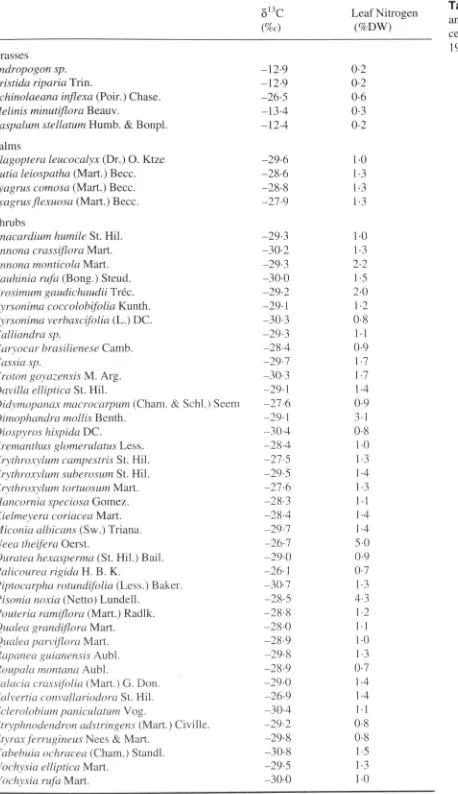
Isotopic signals
The foliar carbon isotopic composition and nitrogen con-tent of grasses and shrubs are given in Table 3. This shows that all grasses except Echinolaena inflexa had the C4 path-way and all shrubs the C3 photosynthetic mode. For C3 shrubs the average foliar carbon isotopic composition was -28-1% and for the C4 grasses it was -13-0%. There was a substantial difference between shrubs and grasses in the nitrogen content (dry weight basis) of foliage, with the C4 grasses being especially low (0-2-0-4% DW).
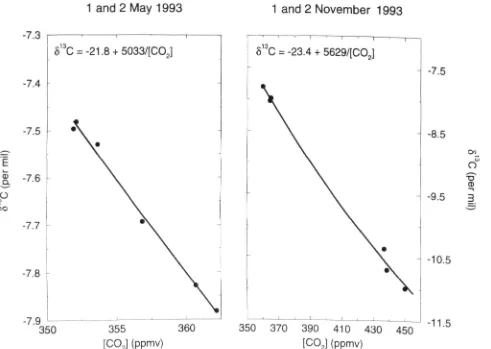
The relationship between the partial pressure of atmo-spheric CO2 (PCO2) and its carbon isotopic composition ( 6 j is shown in Fig. 12. On the second sampling occasion (1-2 November 1993), night-time build-up of CO2 was far more substantial than on the first (1-2 May 1993). Following Keeling (1958), plotting 5 against l/(pCO2) gives an estimate of the isotopic composition of the source CO2 (6^; assuming that the source is of uniform isotopic composition) of-21-8%o for 1-2 May and -23-7%o for 1-2 November. From mass balance considerations, the propor-tion of carbon originating from C4 plant material (p^) can be calculated (e.g. Lajtha & Michener 1994):
PA - cl3 ol3 '
0 4 - ^ 3 (5)
where ^3'"^ is the average carbon isotopic composition of C3 shrubs and d^ is the average carbon isotopic
composi--0.5
40 120 160 200
Day of year
240
Figure 8. Daily totals of carbon flux in the chtiva (wet season) and
seca (dry season).The upper line denotes respiration, and it has been assumed that the respiration in the light is equal to that measured noctumally, but adjusted for the effect of the difference in temperature. The lower data points represent the gross
photosynthetic flux estimated as the net observed flux minus the respiration. The central points are the net carbon balance, as measured ( • ) or as estimated ( • ) from the modelled respiratory and photosynthetic components.
[image:8.716.405.656.623.863.2]Chuva
Seca
(A
c\i
E "o
X
B
CO
o
8
-1 1 r
200 400 600 800 1000
1 \
200 400 600 800 1000
[image:9.711.104.615.67.380.2]Incoming solar radiation (W m ^)
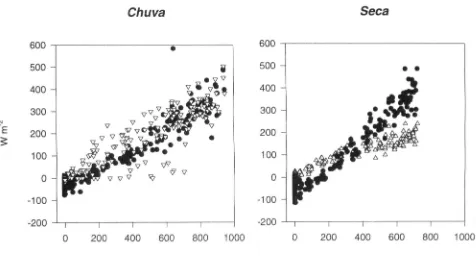
Figure 9. Net ecosystem fluxes of CO2 as influenced by solar irradiance in the chuva (wet season) and seca (dry season).
Chuva
Seca
0.0
-16
0.1 0.2 0.3 0.4 0.0 0.1 0.2 Ecosystem surface conductance (mol m s )
0.3 0.4
Figure 10. The relationship between ecosystem surface conductance and net ecosystem CO2 flux in the chuva (wet season) and seca (dry season). For ease of comparison, the regression curve for wet season data is superimposed on the data illustrating the relationship in the dry season.
tion of C4 grasses. This calculation gives P4 = 0-42 for 1-2 March and/?4 = 0-30 for 1-2 November.
DISCUSSION
Cerrado compared with other ecosystems
The cerrado is a typical savanna ecosystem, showing sea-sonal fluctuations in leaf area index, and a seasea-sonally vary-ing physiology with a much-reduced surface conductance in the dry season. It is not yet clear whether the extremely low nitrogen concentrations are typical of all savannas. The lower values for the nitrogen concentration observed
for the cerrado species (Table 3) may not only be a conse-quence of the seasonal variation (Batmanian & Haridasan 1985) but also an effect of dilution, since several species of cerrado grasses accumulate silica (Silva & Laboriau 1970). The values presented here are in agreement with the N con-centration determined by Medina (1982) for tropical savanna, Foulds (1993) for species of Southwest Australia, and Borgatto (1994) for 32 species of shrubs and trees of cerrado.
[image:9.711.125.594.446.716.2]324 A. C. Miranda et al.
10 20 30 40 50
[image:10.716.77.298.64.282.2]Leaf-to-air vapour pressure deficit (mmol
Figure 11. The relationship between estimated ecosystem values of the ratio of CO2 partial pressure in the substomatal cavity to that in the ambient air (CJCJ for both the wet ( • ) and dry (D) seasons. Data are for cases where solar radiation exceeds 100 W m"^.
photon for wet and dry seasons, respectively. Re-expressed as a quantum requirement, this is 68 and 77 photons per CO2 molecule fixed, although the difference practically disappears when these figures are re-expressed as absorbed photons, by taking into account the higher short-wave reflectance of the dry season vegetation. Corresponding apparent quantum requirements from comparable studies on 'wild' woody vegetation are: 26 photons CO2"' for the mixed deciduous Harvard Forest in the USA (Wofsy et al. 1993), 20-40 photons CO2 ' in our own work on rain for-est in Rondonia, Brazil (Grace et al. 1995a,b), and 45 pho-tons C02^' in the Notiiofagus forest of New Zealand (Hollinger e/ al. 1994). The high quantum requirement in the present study is presumably partly the result of a sparser canopy, but might also be the result of the widespread sclerophylly. The cerrado has some similarity to the evergreen Mediterranean maciiia, described by Valentini et al. (1991). The CO2 flux over the machia was found to be a linear function of irradiance, and the value of 63 photons per CO2 molecule fixed by machia (implied by fig. 4 of Valentini et al. 1991) is close to the quantum requirement of the cerrado vegetation.
Net ecosystem 'dark' respiration rates from these studies may be compared, at the corresponding environmental temperatures. The rates were high in the tropical rain forests of Brazil and in the New Zealand Notiiofagus (5-7 //mol m~^ s^'), and rather less in the Harvard forest (2-3 ;Umol m"- s"'; Wofsy et al. 1993). The rates observed for the cerrado were seen to fluctuate seasonally between 1-6 and 2 3 ^umol m"" s"', presumably in response to the changes in soil water content.
Maximum net carbon assimilation may also be com-s"' in pared: -25 //mol m ^ s at Harvard, -17 //mol m~-Rondonia, -18 //mol m~^ s"' in Manaus, -13 //mol m"^ s"' in New Zealand and -12 and - 5 //mol m~^ s~' in the wet and dry seasons in the present study. The reliability of such data has been discussed elsewhere (Grace et ai. 1996; Moncrieff et al. 1996). From the viewpoint of statistical
sampling, it seems that the amount of data presented in the present paper is sufficient to enable us to scale up to whole-year estimates (see Moncrieff et al. 1996). This can be achieved using process-based models of ecosystem carbon balance (e.g. Lloyd et al. 1995), with climatological and satellite data to estimate the intensity and extent of regional carbon sinks.
Coupling
In a similar study of tall rain forest (Grace et al. 1995a,b, 1996) it was found that the in-canopy CO2 concentration usually increased at night, as a result of a high rate of soil respiration combined with poor nocturnal ventilation of the canopy. Concentrations of in-canopy CO2 were as high as 500 ppmv, so that photosynthesis in the early morning took place at elevated CO2. In the cerrado the situation is differ-ent. The vegetation is shorter and sparser, and soil respira-tion is less (Meir et al. 1996). Wind speeds at night did, on average, decline to some extent, but rarely fell below 0-5 m s" . In the majority of cases examined here, there was little night-time build-up of CO2 and the storage term calculated from CO2 profiles was always less than 1 //mol m~^ s~', and often much less. By contrast, in the tall forest the stor-age flux can amount to over 10 //mol m"~ s~'.
Coupling between vegetation and atmosphere is mea-sured by Q (Jarvis & McNaughton 1986). The values of Q indicate that this physiognomic form of cerrado is closely coupled to the air stream above it: Q = 0-32 in the wet sea-son and jQ = 0-17 in the dry seasea-son. These values are simi-lar to those for heathland (Miranda, Jarvis & Grace 1984) and for coniferous forests (Jarvis & McNaughton 1986). The relatively sparse crowns of the trees make the cerrado vegetation a very aerodynamic ally rough surface and the eddies resulting from the transfer of momentum corrode the characteristic microclimate which could otherwise be built up around the leaves and, in this way, the regional vapour pressure deficit is largely imposed on the surface of the leaves. Near the ground, however, the leaves are less susceptible to this effect of the large mixing eddies, and local leaf surface adjustments may occur.
In the dry season, the amount of transpiring leaves is much-reduced, and the sub-canopy of grasses is especially reduced (Table 2). The ecosystem surface conductance declines correspondingly, and the cerrado becomes even more closely coupled to the atmosphere, presumably because the air movement around the remaining leaves is enhanced.
Inferences from isotope data
From comparison of the near-surface dC values of air with the known isotopic composition of C3 and C4 plants (Eqn 5), it appears that about 40% of the CO2 respired at night must have been of C4 origin. If the system were in a steady state with respect to fluxes and the above- and below-ground carbon pools, this would also reflect the relative contributions of C3 and C4 plants to annual
Leaf Nitrogen (%DW)
Grasses
Andropogon sp. Aristida riparia Trin.
Echinolaeana inflexa (Poir.) Chase.
Melinis minutiflora Beauv.
Paspalum stellatum Humb. & Bonpl. Palms
Alagoptera leucocalyx (Dr.) O. Ktze
Butia leiospatha (Mart.) Becc.
Syagrus comosa (Mart.) Becc.
Syagrus flexuosa (Mart.) Becc. Shrubs
Anacardium humile St. Hil.
Annona crassiflora Mart.
Annona monticola Mart.
Bauhinia rufa (Bong.) Sleud.
Brosimum gaudichaudii Tree.
Byrsonima coccolobifolia Kunth.
Byrsonima verbascifolia (L.) DC.
Calliandra sp.
Caryocar brasilienese Camb.
Cassia sp.
Croton goyazensis M. Arg.
Davilla elliptica St. Hil.
Didymopanax macrocarpum (Cham. & Schl.) Seem
Dimophandra mollis Benth.
Diospyros hispida DC.
Eremanthus glomerulatus Less.
Erythroxylum campestris St. Hil.
Erythroxylum suberosum St. Hil.
Erythroxylum tortuosum Mart.
Hancornia speciosa Gomez.
Kielmeyera coriacea Mart.
Miconia albicans (Sw.) Triana.
Neea theifera Oerst.
Ouratea hexasperma (St. Hil.) Bail.
Palicourea rigida H. B. K.
Piptocarpha rotundifolia (Less.) Baker.
Pisonia noxia (Netto) Lundell,
Pouteria ramiflora (Mart.) Radlk.
Qualea grandiflora Mart.
Qualea par\'iflora Mart.
Rapanea guianensis Aubl.
Roupala montana Aubl.
Salacia crassifolia (Mart.) G. Don.
Salvertia convallariodora St, Hil.
Sclerolobium paniculatum Vog.
Stryphnodendron adstringens (Mart.) Civille.
Styrax ferrugineus Nees & Mart.
Tabebuia ochracea (Cham.) Standl.
Vochysia elliptica Mart.
[image:11.711.42.500.75.869.2]Vochysia rufa Mart.
Table 3. Leaf carbon isotopic composition and nitrogen contents (dry weight basis) of cerrado grasses and shrubs sampled in May
1993 -12-9 -129 -26-5 -13-4 -12-4 -29-6 -28-6 -28-8 -27-9
- 2 9 3 -30-2
-29-3 -30-0 - 2 9 2 -29-1 -30-3 -29-3 -28-4 -29-7 -30-3 -29-1 -27-6 -29-1 -30-4 -28-4 -27-5 -29-5 -27-6 -28-3 -28-4 -29-7 -26-7 -29-0 -26-1 -30-7 -28-5 -28-8 -28-0 -28-9 -29-8 -28-9 -29-0 - 2 6 9 -30-4 -29-2 -29-8 -30-8 -29-5 -30-0 02 02 0-6 03 02 10 13 13 13 10 1-3 2-2 1-5 2-0 1-2 0-8 11 09 1-7 1-7 1-4 09 31 0-8 10 13 14 1-3 11 1-4 1-4 5-0 09 0-7 1-3 4-3 1-2 l-l 1-0 13 0-7 1-4 1-4 1] 0-8 0-8 1-5 1-3 10
synthetic productivity. However, like most cerrados, this was a stand regrowing after fire. A considerable proportion of the new C3 biomass fixed during the 8 year regrowth period would thus have been stored as recalcitrant struc-tural carbon in woody trunks and stems. This carbon would have negligible respiration rates and hence would not be
326 A. C. Miranda et al.
1 and 2 May 1993 1 and 2 November 1993
-7.3
5 C = -23.4 + 5629/[CO
355 360 [CO,] (ppmv)
350 370 390 410 430 450 (ppmv)
[image:12.720.120.611.69.418.2]-11.5
Figure 12. The relationship between the '^C composition (5.) and the partial pressure of CO2 above or within the canopy. For May, the range of partial pressure is so small that the relationship is indistinguishable from linear.
ecosystem as a whole. There are also uncertainties in the calculation due to differences between leaf carbon isotopic composition and other plant organs, and on the basis of what would be expected from on-line carbon isotope dis-criminatioti measurements (Henderson, Caemmerer & Farquhar 1992). Based on these considerations an estimate of somewhere between 30 and 35% of the annual sum of photosynthesis by C4 grasses seems reasonable for this ecosystem.
At least two-thirds of the C4 photosynthesis would have been occurring in the wet season, as the LAI of live grass foliage was half the wet season value in the dry season (Table 2). Due to physiological differences, the ratio of photosynthesis to stomatai conductance for C4 plants is usually about twice that of C3 plants (Farquhar & Sharkey 1982). On that basis, we can assign about 20% of the ecosystem surface conductances (averaged over a year) to C4 grasses and about 80% to C3 shrubs. Under the same environmental conditions, stomatai conductances of C4 grasses are generally similar to those of C3 grasses (Morison & Gifford 1983) with maximum stomatai con-ductances (leaf area basis) for C4 grasses being of the order of 1-0 mol m~^ s"' (Morison & Gifford 1983; Kim & Verma 1991). By contrast, even in the wet season, maxi-mum stomatai conductances (leaf area basis) of cerrado tree species are lower (0-2-04 mol m"^ s"'; Medina 1982; H.S. Miranda, unpublished results).
It should be bome in mind that the floristic composition of cerrado depends upon the season. Even in the absence of
changes in environmental conditions from the wet to the dry season, the reductions in LAI for both C4 grasses and C3 shrubs in the dry season would be expected to cause a change in net ecosystem gas exchange characteristics. We would expect, in the absence of other changes, a reduction of about 35% in ecosystem photosynthetic rates solely by virtue of lower LAI in the dry season. The actual decrease observed was around 50%, confirming that death of grasses and abscission of leaves from some shrub species was the major cause of the lower ecosystem photosynthetic rate. Indeed, taking reduced LAI into account when ecosystem surface conductances are examined as a func-tion of solar radiafunc-tion and leaf-to-air vapour difference (Fig. 5), there is little indication of much additional reduc-tion in ecosystem surface conductances in the dry season beyond that expected on the basis of higher leaf-to-air vapour pressure differences and lower incoming solar irra-diances. This suggests that there was not a large direct effect of soil water deficit on ecosystem surface conduc-tances during the dry season. In fact, the woody-layer plants have deep roots (some may extend up to 20 m deep) that reach perpetually humid layers in the soil (Eiten 1992). For both C3 and C4 plants there is usually little variation in Q/Cg with changes in irradiance, provided that leaf-to-air vapour pressure difference is held constant (Wong, Cowan & Farquhar 1985). Nevertheless, CJC^ is usually lower for C4 plants and, as a consequence of stomatai clo-sure, both plant types show a reduction in CJC.^ with increasing leaf-to-air vapour pressure difference (Morison
& Gifford 1983). A different contribution of C3 versus C4 photosynthesis to total ecosystem productivity can thus also be seen in the changing pattern of the relationship between
CJC.^ and leaf-to-air vapour pressure difference (Fig. 11). At a given leaf-to-air vapour pressure deficit, CJC.^ was higher in the dry season, indicating a smaller proportion of total ecosystem gas exchange being attributable to C4 pho-tosynthesis at this time. There was not a large difference between seasons in the proportions of live dicotyledonous (C3) versus grasses (C4) biomass (Table 2). This indicates that the grasses may have had reduced gas exchange rates per unit area of soil as a direct response to soil drying. The difference of 2%o in the isotopic composition of (soil -1-plant) respired CO2 also suggests some change in the rela-tive activities of C3 shrubs versus C4 grasses, despite little change in the relative proportions of ecosystem leaf area attributable to the two photosynthetic types.
The seasonality in the physiology and morphology of the ecosystem was also reflected in changes in surface energy balance. Of the energy absorbed, a smaller fraction was partitioned to latent heat in the dry season at high solar irra-diances (Fig. 2). This saturating response of latent heat flux to incoming solar radiation is consistent with stomatal clo-sure by surviving foliage in response to the high vapour pressure deficits prevailing in the dry season.
ACKNOWLEDGMENTS
We thank W. Coupland, P. Groeneveld, P.G. Jarvis, M.M. Bustamante, P. McCracken, J. Massheder, J. Moncrieff, S.C. Wong, M.P. Rocha and Pedro Olavo for discussion and practical help. We thank those organizations in Brazil that facilitated the field work: Universidade de Brasilia (UnB), SEMATEC and the staff of the Esta9ao Ecologica de Aguas Emendadas, and the Instituto Brasiliero do Meio Ambiente e dos Recursos Naturais Renovaveis (IBAMA). We acknowledge the financial support provided by the Natural Environmental Research Council through its TIGER (Terrestrial Initiative in Global Environmental Research) programme, award number GST/02/605. J.L.'s travel was assisted by the Australia/New Zealand/UK Tripartite agreement on Climate Change and the Royal Society of London/Australian Academy of Science Exchange programme. The GASLAB measurements were made with the assistance of E. Welch, C. Allison, R. Langenfelds and L.P. Steele.
REFERENCES
Allison C.E., Franeey R.J., Langenfelds R.L. & Welch E.D. (1994a) High preeision comparison of Cape Grim CO2 stable isotope measurements using two mass spectrometers. In Baseline Atmosphere Program (Australia) 1991 (eds C. Dick & J. L. Gras). Department of Administrative Services and CSIRO. Allison C.E.. Franeey R.J. & Meijer H.A.J. (1994b)
Recommendations for the reporting of stable isotope measure-ments of carbon and oxygen in CO, gas. Report of I.A.E.A. Consultants' Meeting on Stable Isotope Standards and Intercalibration, Vienna, Austria 1-3 December 1993.
Batmanian G.J. & Haridasan M. (1985) Primary production and accumulation of nutrients by the ground layer community of cer-rado vegetation of Central Brazil. Plant and Soil 88, 437-440. Borgatto D.F. (1994) Estado nutricional da regeneragdo de
espe-cies arboreas de um cerrado submetido a corte e queima. MSc Dissertation, Universidade de Brasilia, Brasilia, Brazil.
Bullock S.H., Mooney H.A. & Medina E. (1995) Seasonally Dry Tropical Eorests. Cambridge University Press, Cambridge. Eiten G. (1972) The eerrado vegetation of Brazil. The Botanical
Review 2>%,2Q\-2>A\.
Eiten G. (1992) Natural brazilian vegetation types and their causes.
Anais da Academia Brasileira de Ciencias 64 (Suppl. 1), 35-65. EMBRAPA (1987) Levantamento E Reconhecimento Dos Solos Do
Distrito Eedera. Boletim Tecnieo 53, EMBRAPA-SNLCS. Coutinho L.M. (1990) Eeologieal effects of fire in Brazilian
Cerrado. In Eire in the Tropical Biota (ed. J. G. Goldammer). pp. 82-105. Springer-Verlag, Beriin.
Farquhar G.D. & Sharkey T.D. (1982) Stomatal conductance and photosynthesis. Annual Review of Plant Physiology 33, 317-345. Franeey R.J., Robbins F.J., Allison CE. & Richards N.G. (1990) The CSIRO global COT isotope survey. In Baseline Atmospheric Program (Australia) 1988 (eds S. R Wilson & G. P. Ayers), pp.
16-27. Department of Administrative Services/Bureau of Meteorology and CSIRO Division of Atmospheric Research. Foulds W. (1993) Nutrient concentration of foliage and soil from
South-Western Australia. New Phytologist 125, 529-546.
Garratt J.R. & Hicks B.B. (1973) Momentum, heat and water vapour transfer to and from natural and artificial surfaces.
Quarterly Journal of the Royal Meteorological Society 99, 680-687.
Graee J., Lloyd J., Melntyre J., Miranda A.C., Miranda H.S., Wright I. & Gash J. (1995a) Fluxes of water vapour and carbon dioxide over an undisturbed tropical forest in south-west Amazonia. Global Change Biology 1, 1-12.
Grace J., Lloyd J., Melntyre J., Miranda A.C., Meir P., Miranda H., Nobre C , Moncrieff J.B., Massheder J., Malhi Y., Wright I.R. & Gash J. (1995b) Carbon dioxide uptake by an undisturbed tropi-eal rain forest in South-West Amazonia 1992-93. Science 270, 778-780.
Grace J., Malhi Y., Lloyd J., Melntyre J., Miranda A.C., Meir P., Miranda H.S (1996) The use of addy covariance to infer the net carbon uptake of Brazilian rain forest. Global Change Biology 2,
209-218.
Henderson S.A., Caemmerer, S.von & Farquhar G.D. (1992) Short tenn measurements of carbon isotope disrimination in several C4 species. Australian Journal of Plant Physiology 19, 263-285. Hollinger D.Y., Kelliher F.M., Byers J.N., Hunt J.E., McSeveny
T.M. & Weir P.L. (1994) Carbon dioxide exchange between an undisturbed old-growth temperate forest and the atmosphere.
Ecology 75, 134-150.
IPCC (1990) Climate Change: the IPCC Scientific Assessment.
Cambridge.
Jarvis P.G. & MeNaughton K.G. (1986) Stomatal control of tran-spiration: sealing up from leaf to region. Advances in Ecological Research 15, 1-49.
Jones H.G. (1992) Plants and Microclimate. Cambridge University Press, Cambridge.
Kaimal J.C, Wyngaard J.C, Izumi Y. & Cote O.R. (1972) Spectral charaeteristies of surfaee-layer turbulence. Quarterly Journal of the Royal Meteorological Society 98, 563-589.
Keeling C D . (1958) The concentrations and isotopic abundances of atmopsheric earbon dioxide in rural and marine air. Geochimica Cosmochimlca Actal 13, 332-334.
328 A. C. Miranda et al.
Lajtha K. & Michener R.H. (1994) Stable Isotopes in Ecology and Environmental Science. Blackwell Scientific Publications Oxford.
Lloyd C.R., Gash J.H.C. & Sivakumar M.V.K. (1992) Derivaton of the aerodynamic roughness parameters for a Sahelian savannah site using the eddy correlation technique. Boundary-Layer Meteorology 58, 261-271.
Lloyd J., Grace J., Miranda A.C., Meir P., Wong S.C, Miranda H., Wright I., Gash J.H.C. & Mclntyre J. (1995) A simple calibrated model of Amazon rainforest productivity based on leaf biochem-ical properties. Plant, Cell and Environment 18, 1129-1145. Lloyd J. & Taylor J.A. (1994) On the temperature dependence of
soil respiration. Eunctional Ecology 8, 315-323.
Lloyd J & Farquhar G.D. (1996) The COj dependence of photosyn-thesis and plant growth in response to elevated atmospheric CO2 concentration and their interrelationshipwith soil nutrient status
1. General principles. Eunctional Ecology 10, 4-32.
Leuning R. & Moncrieff J. (1990) Eddy CO2 covariance measure-ments using open and closed path analysers: corrections for anal-yser water vapour sensitivity and dampening of fluctuations in air sampling tubes. Boundary Layer Meteorology 53, 63-67. Maitelli G.D. & Miranda A.C. (1991) Evapotranspira9aoo e fluxos
de energia no cerrado - esta9ao chuvosa. Anais da Acadamia Brasiliera de Ciencias 63, 265-272.
Medina E. (1982) Physiological attrributes of neotropical savanna plants. In Ecology of Tropical Savannas (eds B. J. Huntley & B. H. Walker), pp. 308-335. Springer-Verlag, Berlin.
Meir P., Grace J., Lloyd J & Miranda A.C. (1996) Soil respiration in a rain forest in Amazonia, and in cerrado in Central Brazil. In
Amazonian Deforestation and Climate (eds J. H. C. Gash, C. A. Nobre, J. M. Roberts & R. L. Victoria), pp. 307-318. Wiley, Chichester.
Miranda A.C, Jarvis P.G. & Grace J. (1984) Transpiration and evaporation from heather moorland. Boundary Layer Meteorology 28. 227-243.
Miranda A.C & Miranda H.S. (1992) Estresse Hidrico. In
Alternativas de Desenvolvimento dos Cerrados: Manejo e con-servagdo dos recursos naturais renovdveis (ed. B. F. S. Dias), pp. 30-34. IBAMA, Brasilia.
Moncrieff J.B., Malhi Y. & Leuning R. (1996) The propagation of errors in long-term measurements of land atmosphere fluxes of carbon and water. Global Change Biology 2, 231-240.
Moncrieff J.B., Massheder J.M., De Bruin H., Elbers J., Friborg T., Heusinkveld B., Kabat P., Scott S., Soegaard H. & Verhoef A. (1997) A system to measure surface fluxes of momentum, sensi-ble heat, water vapour and carbon dioxide. Journal of Hydrology,
in press.
Monteith J.L. & Unsworth M.H. (1990) Principles of Environmental Physics. Arnold, London.
Moore CJ. (1986) Frequency response corrections for eddy corre-lation systems. Boundary Layer Meteorology 37, 17-35.
Morison, J.I.L & Gifford R.M. (1983) Stomatai sensitivity to car-bon dioxide and humidity. A comparison of two C3 and two C4 grass species. Plant Physiology 71, 789-796.
Raich J.W. & Schlesinger W.H. (1992) The global carbon dioxide flux in soil respiration and its relationship to vegetation and cli-mate. Tellus 44B, 81-99.
Ratter J.A. (1992) Transitions between cerrado and forest vegeta-tion in Brazil. In Nature and Dynamics of Eorest-Savanna Boundaries (eds P. A. Furley, J. Proctor & J. A. Ratter), pp. 417-^29. Chapman & Hall, London.
Schuepp P.H., Leclaerc M.Y., McPherson J.I. & Desjardin R.L. (1990) Footprint prediction of scalar fluxes from analytical solu-tion of the diffusion equasolu-tions. Boundary Layer Meteorology 50 355-373.
Shuttleworth W.J. (1988a) Evaporation from Amazonian rainforest
Proceedings of the Royal Society of London B 233, 321-346. Shuttleworth W.J. (1988b) Micrometeorology of temperate and
tropical forest. Proceedings of the Royal Society of London B
324, 299-334.
Shuttleworth W.J., Gash J.H.C, Lloyd C.R., Moore CJ., Roberts J., Marques A. de O., Fisch G., Silva Filho V. de P.S., Ribiero M de N.G., Molion L.CB., de Sa L.D.A., Nobre J.C, Cabral O.M.R., Patel S.R. & de Moraes J.C (1984) Eddy correlation measure-ments of energy partition for Amazonian forest Quarterly Joumal of the Royal Meteorological Society 110, 1143-1162. Silva S.T. & Labouriau L.G. (1970) Corpos silicosos em gramineas
dos Cerrados III. Pesquisa Agropecudria Brasileira 5, 167-182. Skole D.L., Chomentowiski W.H., Salas W.A. & Nobre A.D.
(1994) Physical and human dimensions of deforestation in Amazonia. Bioscience 44, 314-322.
Tans P.P. (1980) On calculating the transfer of carbon-13 in reser-voir models of the carbon cycle. Tellus 32, 454-^69.
Valentini R., Scarascia Mugnozza G.E., de Angelis P. & Bimbi R. (1991) An experimental test of the eddy correlation technique over Mediterranean machia canopy. Plant, Cell and Environment 14, 987-994.
Webb E., Pearman G.I. & Leuning R. (1980) Correction of flux measurements for density effects due to heat and water vapour transfer. Quarterly Joumal of the Royal Meteorological Society
106,85-100.
Wofsy S.C, Goulden M.L., Munger J.W. Fan S-M., Bakwin P.S., Daube B.C., Bassow S.L. & Bazzaz F.A. (1993) Net exchange of CO2 in a mid-latitude forest Science 260, 1314-1317.
Wong S.C, Cowan I.R. & Farquhar G.D. (1985) Leaf conductance in relation to rate of CO2 assimilation 1. Influence of nitrogen nutrition, phosphorous nutrition, photon flux density and ambi-ent partial pressure of CO2 during ontogeny. Plant Physiology
78,821-825.
Received 5 June 1996: received in revised form 12 September 1996; accepted for publication 18 October 1996