Developing Lean – EMS Integration Database for
Sustaining ISO 14000 Certification
P. Puvanasvaran
*, V. A. Alagendran, N. Norazlin
Faculty of Manufacturing Engineering, Universiti Teknikal Malaysia Melaka Hang Tuah Jaya, 76100 Durian Tunggal,Melaka, Malaysia *Corresponding Author: [email protected]
Copyright © 2014 Horizon Research Publishing All rights reserved.
Abstract
This paper highlights a methodology to implement Lean-EMS integration system in the case study company. Lean manufacturing is a concept widely applied in industries to eliminate wastes and achieve high business efficiency. The concept implemented through five principles which is called a self-sustaining cycle. EMS on the other side is an international standard for environmental management. It guides organizations through compliance requirements to reduce environmental impacts from business activities and boost up operating efficiency. Researches on EMS implementation have revealed that the system has similarity with Lean Principles. Hence, researchers had integrated both systems to attain both lean and EMS goals. This integration required a management system for continuous improvement. This paper focuses on design, and development of database system to manage the integration of Lean Principles and Environmental Management System (EMS) to aid employees in problem solving through visual indicators for continuous improvement and sustain the certification. The methodology adapted for the study is using the database development steps with Microsoft Access 2010 software. The database which is comprised of five performance measures (each reflects a lean principle and selected EMS clause) from integration framework specially designed and developed for the case study company. The results of the study validated the use of developed database system for continuous improvement. The study is indeed very useful to the company because the developed system is a comprehensive tool, where it can visualize problems in operations that might affect the production flow and EMS compliance. As the problem visualized, immediate problem solving can be done to continuously improve the conditions and sustain EMS certification.Keywords
Lean-EMS Integration, Database, Visual Indicator, Continuous Improvement, Sustain1. Introduction
Globally, most organizations start to understand their role
in preserving the environment. To survive in the global economy, organizations are needed to be socially responsible. Environmental Management System (EMS) can help the company in fulfilling their responsibilities towards protecting the world environment [1]. However, ISO 14001 certification for EMS mainly focuses on the management process and does not prescribe any standards regarding the performance. This is one of the major drawbacks of EMS because the organization cannot see any tangible value of the standard.
Besides, ISO 14001 certification for EMS lacks an operational definition of what continual improvement is and how it should be assessed [2]. Even though ISO 14001 establishes a set of requirements for an environmental management system but does not describe how these requirements are to be implemented. Without continuous improvement it is difficult for an organization to sustain the certification.
That is where Lean plays a role since it is a powerful force for continuous improvement. It works best and generates the most value, when it is linked to programs that create a demand for continual improvement. Lean is a systematic approach for continuous improvement through the identification and elimination of wastes which result in perfection. United States Environment Protection Agency (EPA) stated that lean pushes for continuous improvement and empowers companies to better their environmental performance.
Puvanasvaran [2] had conducted study on the integration of Lean Principles and EMS clauses. The finding of the study highlighted that the principles and approach of Lean and EMS do match each other. The proposed integration framework requires the organizations to identify the various parameters that have a direct or indirect impact on the environmental aspects [2]. These parameters also known as performance measures are the keys for continuous improvement.
from top to bottom to refer the data anytime. The data is important information for continuous improvement. Database system is the most appropriate for this purpose.
Continuous improvement will involve a lot of problem solving that arise throughout EMS implementation in order to sustain the certification. In the context of EMS, problem can be defined as anything that cause deviation on expectation of EMS which is to reduce environmental impacts and increase operating efficiency. Problem identification can be tough without a proper tool because most of the time problems are hidden. Lean visual indicators had been used for performance measures visualization which will lead to identification of problems.
2. Literature Review
2.1. Environmental Management System (EMS)
Environmental Management System (EMS) plays an important role in protecting the Mother Nature from being harmed by human activities. Organizations conduct various types of business activities such as manufacturing to achieve their corporate objectives. These processes cause lots negative impacts to the environment. EMS is the medium for companies to achieve their corporate objectives with minimum impact to the environment. Environment Management System (EMS) can help the company in fulfilling their responsibilities towards protecting the world environment [1]. Besides, an effective EMS contributes to cost savings and reduces the environmental liabilities [3].
Implementation of Environmental Management System (EMS) has no boundaries. It is applicable for all types of industries disregard its size, nature of business, and also scale. However, only large organizations choose to certify ISO 14001. Most small and medium industries refuse to certify the standard due to various reasons. One of the reasons might be ISO 14001 is voluntary and no legal requirements to certify on this standard.
Even so, many organizations decided to certify the standard to gain advantages over their competitors. For instance business gain external recognition and different market benefits [18]. Other than that, quality systems in connection and combination with ISO 14001 have improved [4]. Communication channels, skills, knowledge as well as attitude can also be enhanced inside the organization upon the implementation of ISO 14001 [5]. EMS adoption provides path for new interactions and relationship between the employees and the management which can help in order to offer some intangible advantages, which include enhanced morale [2]. There are also organizations adopt EMS to gain better image. The firm exceeds the expectations of the stakeholders and their satisfaction, which consequently help to enhance reputation and gain and maintain competitive advantage, hence can help to secure higher financial returns that its competitors [6].
There are also other reasons of adopting EMS besides
gaining business advantages. The technological development offers organizations different challenges and threats, mainly related to the environmental issues. Private and governmental sectors or even individuals are pushed to apply procedures and processes, with the assistance of standards such as EMS that will help them in order to minimize the different environmental damages.
2.2. Lean Manufacturing
Lean is a tool for process improvement that aims at maximizing customer value and minimizing waste [7]. From that it is clear that the main principle of lean is to eliminate any activities that do not add value to the products or customers. Five key principles to achieve lean goal are – identify value; map the value stream; create flow; establish pull; and seek perfection. An organization implementing lean, it is enough to just adopt a few principles only for certain processes however this will not have an impact on the performance of the company [2]. The reason is lean does not focus individually on systems, tools, technologies, assets, and functions instead it works at optimizing process flow across assets, systems, technologies, and functions to deliver the best value to customers (Lean Enterprise Institute). Therefore, to reap the full benefits of lean, the company must adopt it as part of their business strategy [8].
Continuous improvement is also known as Kaizen in Japanese word. Liker [9] said “We are never satisfied with where we are and always improve our business by putting forth our best ideas and efforts” [9]. Kaizen is a process of seeking for perfection by improvement and it is never-ending. The Kaizen event is a quick and full-immersion event for solving a problem or reducing waste; it takes from two to five days and it is carried out by personnel at all levels [19]. The tools and principles used for continuous improvement are – visual control and management, Takt-time, 5S, one-piece-flow, SMED, Jidoka, Kanban, TPM, and Asaichi morning market.
Asaichi morning market is the Japanese market where fish, fruits, and vegetables are prepared and sold in the early morning when they are fresh. In the same way, every morning a team controls and reviews the “fresh” problems of the last day using a quick problem-solving method registered and displayed in an A3 report [10]. A3 simply refers to the size of the report document to aid key point communication to overseas visitors or support personnel, attempting to breakdown communication barriers. There are four kinds of A3s – Hoshin planning A3, problem solving A3, Proposal A3, and Current status A3 [11]. The idea is that A3 simplifies the process of information retrieval, consequently quicken the decision making.
on work, and what job is next to go at work [13]. This is because visual indicators in Lean focuses on the process and visualize the production status clearly. Production status or results compare the actual performances with expected results. The improvement takes place whenever the process does not meet the anticipated outputs. A few examples of visual indicators are shown in Table 1.
Table 1. Examples of visual indicators [12].
Visual Indicators Description
Overall Equipment Efficiency
Placed next to machines or at team meeting areas. One graph for overall OEE and one each for the
three elements of OEE. Changeover
Times
Should be graphed routinely, to prevent slippages.
Line Rebalancing Charts showing takt time, and magnetic strip for
each work element, kept in the team area.
Methods Keep standards and methods at workplace.
Maintenance A maintenance “red tag” board, showing all
outstanding concerns.
The crucial part of visual management is the leaders’ responsibility to follow up with the visual indicators from time to time. Else, visual display is just meant for decoration on the production floor, machine cabinets, and notice boards. One limitation of visual management is that Lean people need to go to the shop floor every time wants to check or update the production reports. Nevertheless, with the more systematic IT system, the data or information on the shop floor can be accessed in shorter time [11]. IT tools such as database system can be used to overcome this drawback.
Table 2. Details of database design steps
Step Details
Requirement Analysis
To understand what data is to be stored in the database, what applications must be built on top of it, and what operations are most frequent and subject to
performance requirements.
Conceptual Database
Design
Information gathered in the requirements analysis step is used to develop a high-level description of the data to be stored in the database, along with the constraints
that are known to hold over this data. Logical
Database Design
Implement database design, and convert the conceptual database design into a database schema in
the data model of the chosen DBMS. Schema
Refinement
Collection of relations in relational database schema to identify potential problems, and to refine it.
Physical Database Design
Involve building indexes on some tables and clustering some tables, or involve a substantial redesign of parts of database schema obtained from
the earlier design steps.
Security Design
Identify different groups of user and different roles played by various users. For each role and user group, identify the parts of the database that they must be able to access and the parts of the database that they should not be allowed to access, and take steps to ensure that
they can access only the necessary parts.
2.3. Database Management System
Database has been incorporated in many applications such as inventory management, human resource planning,
financial analysis, enterprise resource planning, material resource planning and etcetera. Lately, many lean practitioners focusing on development software for lean tools and techniques instead of solving problems and eliminating wastes. Therefore, there are some suggestion that lean software development must integrate and synchronize with all business processes, management systems, and Kaizen activity, supporting the lean transformation of the overall enterprise [14].
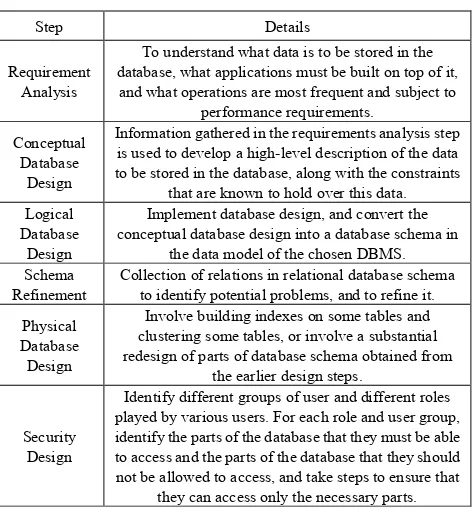
The database design process consists of six steps. The first three steps are relevant to entity-relationship model namely requirement analysis, conceptual database design, and logical database design. The remaining three steps are beyond entity-relationship model that is schema refinement, physical database design, and security design [15]. The table 2 describes the details of each step.
3. Methodology
3.1. Database Model Conceptualisation
Database conceptual modelling is all about organizing abstract ideas into concrete description [16]. It describes the database system will be built. Conceptual modelling has several advantages such as understanding the system better, detect errors in the early stages, ensure the quality of the system built, and so on so forth. Database model conceptualisation determines inputs and outputs of database system in order to design it correctly at the first time to avoid changing after data relationship. In this project, set of performance measures data used as input of the database system and generated outputs visualized the performance measures. This output interpreted for continuous improvement which leads to EMS certification sustainability.
Figure 1. Conceptual Model of Lean-EMS Integration Database
3.2. LEMIS Performance Measures Selection and Data Collection
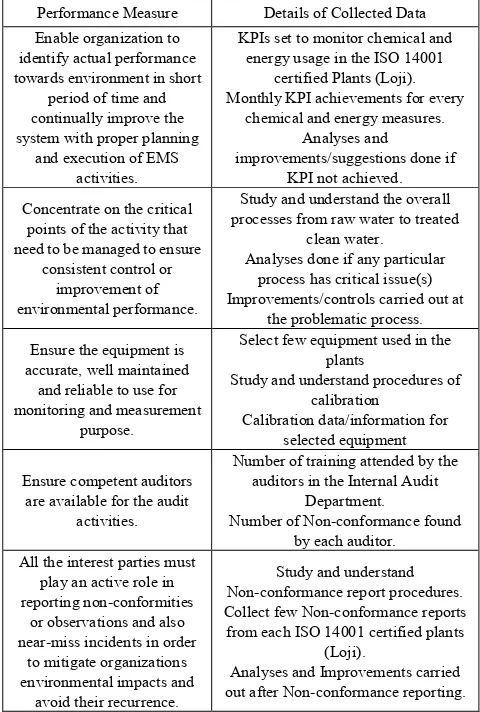
Performance measures indicate the level of achievement. Performance measures of Lean-EMS Integration selected from the integration framework which consists of hundreds of them arranged in the matrix form. As an example, take EMS clause 4.3: Planning. The clause has many sub-clauses under it. Take sub-clause 4.3.3: Objectives, Targets, and Programs. In the framework this sub-clause has performance measure for each lean principle. Each lean principle then divided into two measures. Hence, there are ten performance measures for this sub-clause alone. Five performance measures which suit the case study company were selected in a cascaded manner – each reflecting every lean principle and related EMS clause. The selection made once the framework understood fully and gained inputs from the case study company. The case study company finds that these performance measures are best suits them. Table 3 shows all five performance measures and its details.
Table 3. Performance measures and details of data collected
Performance Measure Details of Collected Data
Enable organization to identify actual performance towards environment in short
period of time and continually improve the system with proper planning
and execution of EMS activities.
KPIs set to monitor chemical and energy usage in the ISO 14001
certified Plants (Loji). Monthly KPI achievements for every
chemical and energy measures. Analyses and
improvements/suggestions done if KPI not achieved.
Concentrate on the critical points of the activity that need to be managed to ensure
consistent control or improvement of environmental performance.
Study and understand the overall processes from raw water to treated
clean water. Analyses done if any particular
process has critical issue(s) Improvements/controls carried out at
the problematic process.
Ensure the equipment is accurate, well maintained
and reliable to use for monitoring and measurement
purpose.
Select few equipment used in the plants
Study and understand procedures of calibration
Calibration data/information for selected equipment
Ensure competent auditors are available for the audit
activities.
Number of training attended by the auditors in the Internal Audit
Department.
Number of Non-conformance found by each auditor. All the interest parties must
play an active role in reporting non-conformities
or observations and also near-miss incidents in order
to mitigate organizations environmental impacts and
avoid their recurrence.
Study and understand Non-conformance report procedures. Collect few Non-conformance reports from each ISO 14001 certified plants
(Loji).
Analyses and Improvements carried out after Non-conformance reporting.
Data for selected performance measures were collected from the historical data (for year 2012) of the case study company. The data have been reviewed with the employees several times to ensure it is useful data for database design.
Table 3 shows the performance measures and details of data collected for each of them. The collected data were used for logical database design in the next step.
3.3. LEMIS Database Development
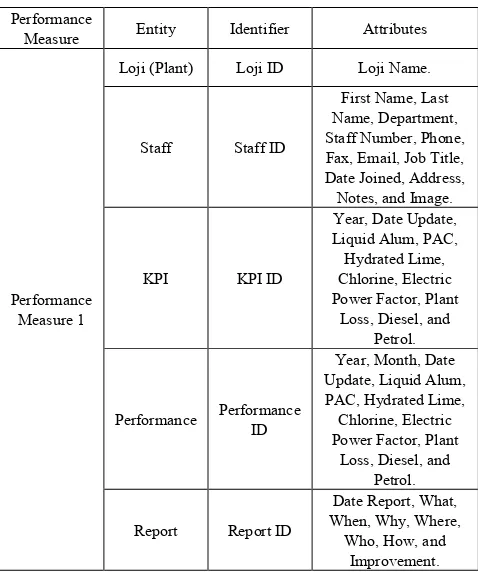
The logical database identifies the entities, identifiers, and attributes. The entity is something user wants to track and identified in the users’ work environment. The identifier is a special identification of an entity and attributes refers to the characteristics of the entities. The logical definition of an entity and its attributes is called the database schema. The entities, identifiers, and attributes for performance measurement 1(as an example) are shown in Table 4. The relationship models between entities for each performance measure 1(as an example) are shown in Figure 2.
Figure 2. Entities-relationship models for performance.
The database schema which is a logical definition of an entity and its attributes refined to eliminate potential problems that might arise. The potential problem found is that Loji and Staff entities used for all first three performance measures. Creating Loji and Staff tables for three performance measures seemed unnecessary. Therefore, only one table designed for each Loji and Staff entities. These tables designed separately from performance measures. This means, the data from the table can be called by using query and identifier whenever it’s needed by performance measures’ entities. The second and last potential problem may arise is with NCR entity. The table will be referred to call data from other related tables. Hence, one NCR table is appropriate because it was related with other seven tables by one-to-one relationship.
a Creating LEMIS Database Tables – Tables are created to store data of entities. The stored data used by the end users to perform their tasks.
b Creating Tables Relationship – Relationship defined
as two or more entities are interconnected with each other.
c Designing Forms – Forms are the main part of the
database design because it creates user interface of the tables. Data and information about the performance measures are recorded in the form which will be stored in the tables. This storing process takes place behind the scene of user interface. Few types of forms can be created using Microsoft Access 2010 namely Navigation Form, Modal Dialog, Datasheet, PivotTable and etcetera.
d Transforming Data With Queries – In the context of
database design, queries are used to select records as well as add, update, and delete records in the tables [18]. Nonetheless, most often queries used to select certain records that meet user criteria. The query results can be used to create Datasheet, PivotCharts, PivotTables, and etcetera.
e Creating Reports -The final product of most
database applications. It combines data from tables, queries, and forms to generate reports for printing and displaying whenever it is needed. The report function in Microsoft Access 2010 is versatile and major plus point due to its capability to produce reports easily and quickly [18].
Table 4. The entities-identifiers-attributes table for performance measure 1
Performance
Measure Entity Identifier Attributes
Performance Fax, Email, Job Title, Date Joined, Address,
4.1. LEMIS Performance Measures Data Outputs
Outputs generation is one of the main purposes of a database system besides storing valuable data. The outputs are the tool to communicate processed data and information from the database. The outputs presented in several ways – 1) Reports; 2) PivotTables; 3) PivotCharts; 4) Datasheets; and 5) Forms. These outputs are usually obtained using built-in queries (command button) by users in their interface. There are different types of outputs had been generated for the case study company for each performance measure of the LEMIS database system. The outputs are arranged appropriately so that it has the characteristics of visual indicators. Visual indicator is one of the keys for Lean success. This is because visual indicator is the quickest and easiest way of communicating information which leads to the immediate problem solving and continuous improvement.
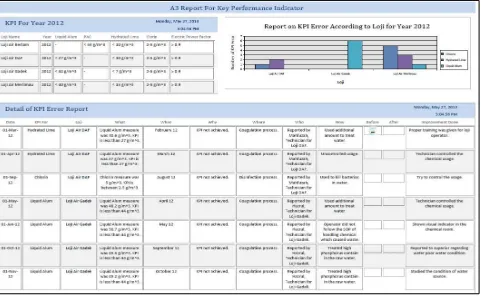
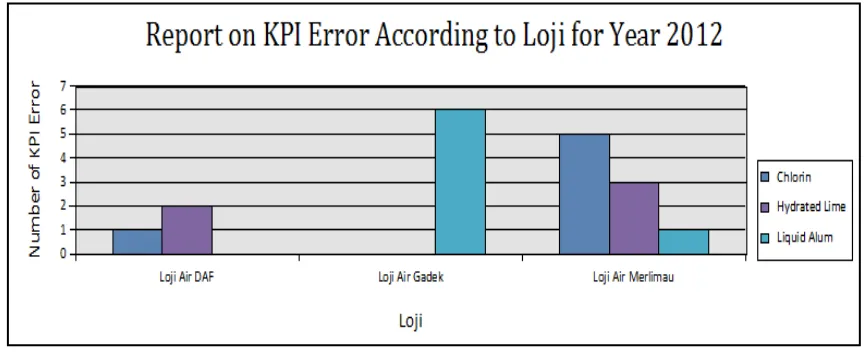
Performance measure 1 has six outputs which consist of four chemicals usage and an electric power factor status reports in the case study company and one current status A3 report. The five status reports are – Liquid Alum, PAC, Hydrated Lime, Chlorine, and Electric Power Factor. The five visual indicators show the monthly usage of chemicals at each plant together with targeted KPIs. The current status A3 report shows information and data in one page A3 size format. Those information and data are – yearly KPI errors for each five chemicals according to plants, targeted KPI values for the particular year, and details of the analyses done together with improvements if KPI not achieved. Figure 3 illustrates the current status A3 report of the Case Study Company for the year 2012.
Performance measure 2 has a monthly improvement A3 report as a visual indicator. This visual indicator consists of few outputs generated from tables of performance measure 2. The main output is the monthly improvements suggested or carried out on each EMS certified plant. This output further can be changed to yearly improvement plans for each plant by changing the query at the bottom of the output. Second output in the A3 report is monthly problems or complications encountered according to EMS clauses categorized by EMS certified plants. This output also can be changed into yearly view. The last output is the details of improvement plans. This output shows the details of plant that carrying out the improvement, priority, status, percentage complete, duration, and improvement type either preventative or corrective. The monthly improvement A3 report of the Case Study Company shown in Figure 4.
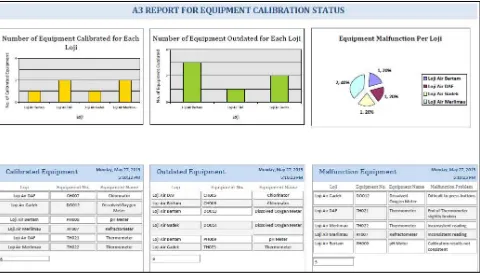
EMS certified plant with the details of equipment shown below it. A pie chart on the right side shows the number and percentage of malfunction equipment reported from each plant. The malfunction equipment details including the problem presented below it.
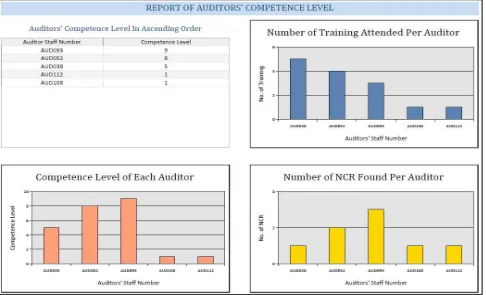
Outputs generated for performance measure 4 determines the competence level of auditors in the Case Study Company. The outputs were created using data from tables of performance measure 4 and NCR table from performance measure 5. The outputs were arranged to create an auditors’ competence level report. The report is as illustrated in Figure 6. The graph shows training attended by auditors arranged on the right side top while the number of non-conformance (NCR) found by each auditor shown on the right side bottom. The competence level graph is arranged on the left side bottom of the report. The competence level of auditor is determined by multiplying the number of training attended and number of NCR found by an auditor. The multiplication
operation done in query design before transforming into output.
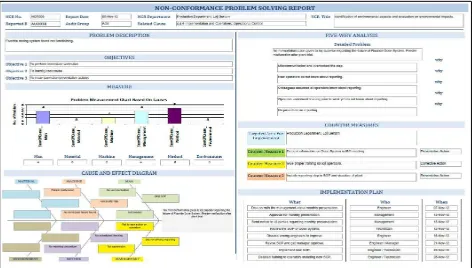
Performance measure 5 is the most critical in LEMIS database. The output is same with the update carried out. This output does not require the query because the form itself arranged as A3 report format. This input/output form named as Non-Conformance Problem Solving A3 Report. The input/output format is divided into eight sections. The top section is reporting of non-conformance which arranged such a way of report header. The following seven sections were arranged according to problem solving steps starts from problem description moving downwards to cause and effect diagram and continued with five-why analysis until the final section called implementation plan. Visual indicator for performance measure 5 is a comprehensive to solve problems because it contains detailed steps. An example of Non-conformance Problem Solving A3 report for the Case Study Company is shown in Figure 7.
Figure 4. Report of monthly improvement based on EMS certified plants and problem according to EMS clauses - Performance Measure 2
Figure 6. Figure 21: Auditors’ competence level report in the case study company for performance measure
5. Discussion
Sustainability means retain something over time continuously. The sustainability in the context of EMS certification is to retain the status of the certified company as environmentally friendly. The case study company achieved this through the LEMIS database system. This confirmation strengthened with a few key points.
First of all lean visual indicators emphasizes on display status or results of production so that everyone understands it a single glance. LEMIS database system had created these type visual indicators for the case study company. The problems or unusual conditions that might cause noncompliance to EMS requirements visualized through the outputs (visual indicators) of the database. As shown in Figure 8, the problems encountered at each EMS certified plants from October to December classified according to EMS clause. It is clearly shown that sub-clause 4.4.6: Operational Control has the severe problems. Hence, responsible parties can attack on these problems first because it might get serious if failed to solve and will cause noncompliance to EMS. As the most severe problems to solve had been identified, the preventive control measures taken to eliminate or mitigate the complications that caused disturbances. This control measures also carried out using a visual indicator called A3 problem solving report. As the problems solved, the situation back to normal condition where the company meets EMS requirements of controlling impacts to the environment consequently sustain the certification.
Visual indicators also quicken the problem solving. The reason is critical operation or situation already visualized and what employees need to do is just solve the problem. A3 problem solving report in the database had displayed the steps for employees to solve problems. As illustrated in Figure 7, there are seven steps of problem solving should be carried out to find corrective actions. Employees simply follow the steps of problem solving and implement improvement plans. This compact problem solving report expresses all the information in one single paper and can be grasped by anyone at first glance.
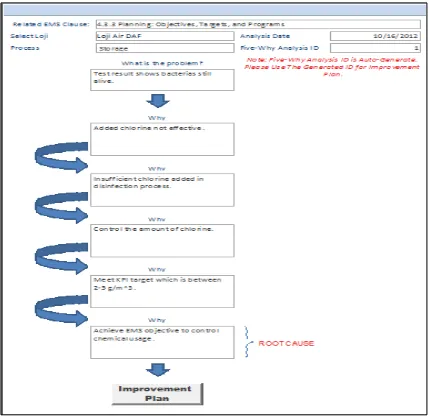
Besides, problem solving in the company changed from conventional method to the more systemic way. The employees carry out improvements with more reliable data available in the database system. They use the right data for the right purpose and avoid data redundancy. With LEMIS database system, employees identify the root cause of the problem prior to solution identification (Figure 9). This systematic problem solving method is one of the keys for continuous improvement.
communicates on behalf of field workers. Then, corporate people can make quick decisions whether to change the KPI or not. In this case, it is clear that KPI for Liquid Alum must be reviewed and changed. This improvised communication is another continuous improvement measure for the case study company.
Last but not least, LEMIS database visual indicators can be used as future reference without worrying about loss of data. In real life, hard-copy documents are difficult to keep. Employees might make redundant copies, tend to loss, and most importantly need sufficient space. With LEMIS database, employees can print documents only when necessary. Field workers also can refer to the visual indicators in the database whenever they face similar problems in the operations. This will lead towards continuous improvement because one can avoid the repetition of past problem just by noticing the symptoms and quickly refer to the database to check through and take preventive actions. This problem prevention is another measure of sustainability.
6. Conclusion
The principal goal of this study is to design, and develop a database system to manage the integration of Lean Principles and Environmental Management System (EMS) to aid employees in problem solving through visual indicators for continuous improvement and sustain the certification. This objective has been achieved by understanding the integration
framework and developing a database system to manage performance measures selected for the case study company. The findings show that LEMIS database application had benefited the company in several angles. Firstly, visual indicators helped to find the current status and problem at first glance. Secondly, A3 problem solving report guided the employees to use standard steps and format to correct problems and visualize them in one single piece of paper. Thirdly, the system had improvised the communication medium of the company through visual indicators. Fourthly, the well managed database helped the company to keep records of past improvements and achievements which can be used for future references. Finally, the LEMIS database system had insisted continuous improvement culture in the company so that they are able to sustain EMS certification. The novelty of this study is using information technology to manage the LEMIS integration system. The designed application is a new tool for both lean and Environmental Management System (EMS). In lean perspective, the application plays role as a medium of information flow throughout the organization to complete a self-sustaining cycle of lean principles. From EMS angle, the application is a versatile tool which integrated with lean tools and techniques for organizations to manage the Environmental Management System compliance. In the nutshell, this new database system tends to benefit organizations by increasing business efficiency and reducing impacts of business activities towards the environment. This achievement will give a positive impact on corporate image of organizations.
Figure 8. Monthly problems encountered at each plant classified according to EMS clauses
Figure 10. KPI error reports for each plant classified according to chemical substances
REFERENCES
[1] Gbedemah, F. S., 2004. “Environmental Management System (ISO 14001) Certification In Manufacturing Companies In Ghana: Prospects And Challenges” Thesis, LUND University, 2004
[2] Puvanasvaran, A. P., Tian, R. K. S., and Muhamad, M. R. Sustainability of International Standards Organisation 14001 Standards through Integration with Lean Principles.
American Journal of Applied Science, 8 (11), pp. 1182-1194, 2011
[3] Cheremisinoff, N.P., P. Rosenfeld and P.E. Rosenfeld. Handbook of Pollution Prevention and Cleaner Production Vol. 2: Best Practices in the Wood and Paper Industries. 1st Edn., William Andrew, Norwich, N.Y., ISBN: 008096446X, pp: 350, 2009.
[4] Lawrence, L., Andrews, D., Ralph, B., and France, C. Identifying and assessing environmental impacts: investigating ISO 14001 approaches. The TQM Magazine, 14 (1), pp. 43-50, 2002.
[5] Rondinelli, D., and Vastag, G., 2000. Panacea, common sense, or just a label?: The value of ISO 14001 environmental management systems. European Management Journal, 18 (5), pp. 499-510, 2000.
[6] Bansal, P., and Bogner, W. C. Deciding on ISO 14001: Economics, Institutions, and Context. Long Range Planning, 35 (3), pp. 269-290, 2002.
[7] Miller, G., Pawloski, J., and Standridge, C. A case of lean, sustainable manufacturing. Journal of Industrial Engineering and Management, 3 (1), pp. 11-32, 2010.
[8] Turbide, D.A. Five ways ERP can help you implement Lean. Asia Pacific Food Industry, 18: 68-74, 2005.
[9] Liker, J. K., and Hoseus, M. Toyota Culture: The Heart and Soul of The Toyota Way, United States of America: McGraw-Hill, 2008.
[10] Chiarini, A. 2011. Integrating lean thinking into ISO 9001: a first guideline. International Journal of Lean Six Sigma, 2 (2), pp. 96-117, 2011.
[11] Hui, Y. H., 2012. “Managing Waste Elimination Database In Lean Manufacturing: Improve Problem Solving Capability”
Unpublished Bachelor Thesis, Universiti Teknikal Malaysia Melaka.
[12] Bicheno, J. The New Lean Toolbox Towards Fast, Flexible Flow, Buckingham: PICSIE Books, 2004.
[13] Feld, W. M. Lean Manufacturing: Tools, Techniques, and How to Use Them, Florida: St. Lucie Press, 2000.
[14] Bell, S.C. and Orzen, M.A. Lean IT: Enabling and Sustaining Your Lean Transformation, New York: CRC Press, 2011.
[15] Ramkrishnan, R. and Gehrke, J. Database Management Systems, 3rd ed., New York: McGraw-Hill, 2003
[16] Embley, D. W. Object Database Development: Concepts and Principles, United States of America: Addison Wesley Longman, Inc, 1998.
[17] Andy, O. Database: A Beginner’s Guide. United States of America: McGraw-Hill Companies, 2009.
[18] Jennings, R. Microsoft Access 2010: In Depth, United States of America: Pearson Education, 2011.
