UNIVERSITI TEKNIKAL MALAYSIA MELAKA
DEVELOPMENT OF GRID FREQUENCY AND ANALYSE THE DATA IN REAL TIME
This report submitted in accordance with requirement of the Universiti Teknikal Malaysia Melaka (UTeM) for the Bachelor Degree of Electrical Engineering
Technology (Industrial Power) (Hons.)
by
MOHAMAD SAFWAN BIN MD SAZALI B071210080
910329-01-5105
UNIVERSITI TEKNIKAL MALAYSIA MELAKA
BORANG PENGESAHAN STATUS LAPORAN PROJEK SARJANA MUDA
TAJUK: DEVELOPMENT OF GRID FREQUENCY AND ANALYSE THE DATA IN REAL TIME
SESI PENGAJIAN: 2015/16 Semester 1
Saya MOHAMAD SAFWAN BIN MD SAZALI
mengaku membenarkan Laporan PSM ini disimpan di Perpustakaan Universiti Teknikal Malaysia Melaka (UTeM) dengan syarat-syarat kegunaan seperti berikut:
1. Laporan PSM adalah hak milik Universiti Teknikal Malaysia Melaka dan penulis. 2. Perpustakaan Universiti Teknikal Malaysia Melaka dibenarkan membuat salinan
untuk tujuan pengajian sahaja dengan izin penulis.
3. Perpustakaan dibenarkan membuat salinan laporan PSM ini sebagai bahan pertukaran antara institusi pengajian tinggi.
4. **Sila tandakan ( )
SULIT
TERHAD
TIDAK TERHAD
(Mengandungi maklumat yang berdarjah keselamatan atau kepentingan Malaysia sebagaimana yang termaktub dalam AKTA RAHSIA RASMI 1972)
(Mengandungi maklumat TERHAD yang telah ditentukan oleh organisasi/badan di mana penyelidikan dijalankan)
Alamat Tetap: NO. 118 Jalan parit HJ Johari, Kampong Telok Rimba, 84400 Sungai Mati Johor
Tarikh: ________________________
Disahkan oleh:
Cop Rasmi:
FAKULTI TEKNOLOGI KEJURUTERAAN
Tel : +606 234 6623 | Faks : +606 23406526
DECLARATION
I hereby, declared this report entitled “Development of Grid Frequency and Analyse the Data in Real Time” is the results of my own research except as cited in
references.
Signature :………..
v
APPROVAL
This report is submitted to the Faculty of Engineering Technology of UTeM as a partial fulfillment of the requirements for the degree of Bachelor of Electrical Engineering Technology (Industrial Power) (Hons.). The member of the supervisory is as follow.
………. (Mohd Firdaus Bin Mohd Ab Halim)
vi
ABSTRAK
vii
ABSTRACT
viii
DEDICATIONS
I dedicate my dissertation work to my family and all my friends. A special gratitude to my loving parents, Md Sazali and Pn. Zaidah whose give me endless love of encouragement and supports. To my sibling, Sofea and Saiful whose never always accompany me all time.
I also dedicate this dissertation to my special friends, the classmates of BETI, the 2nd Cohort FTK for helping me through the process of completing this project. I will always appreciate all the help, especially Fazrin Salleh for helping me develop my software and hardware skills, Ryzwan for the many words of support, and PSM BETI Gang for helping me to master Arduino.
ix
ACKNOWLEDGMENTS
Thank to Allah for giving me the oppotunity in completing this report”Projek Sarjana Muda I” with success after went through the obstacle patiently. I would like to thank to my supervisorMr Mohd Firdaus Bin Mohd Ab Halim, for guiding me in completing this project and report. Many thing he has taught while i was making mistake. Thank to all lecturer and technician that have giving me a guidance and share thier experiance througout this project.
To my mother, Zaidah bte Mohktar, a special thank to her for giving me the opportunity to study here.
x
LIST OF SYMBOLS AND ABBREVIATIONS ... xv
CHAPTER 1 ... 1
xi
2.4 Thesis about previous project ... 7
2.4.1 Design of Virtual Power Frequency Meter Based on IEC 61000-4-30 Power Quality Standard. ... 7
2.4.2 A New Method for Measuring Power System Frequency ... 10
2.5 The market price of frequency meter ... 12
CHAPTER 3 ... 15
3.0 Introduction ... 15
3.1 Develop frequency measurement devise. ... 15
3.2 Project design flow chart ... 16
3.3 Software development ... 18
3.3.1 Arduino ... 18
3.3.2 Atmega-168 microcontroller ... 18
3.3.3 Why Arduino ... 19
3.3.4 Overview of the arduino that use in this project ... 20
3.3.5 How the arduino is useful for this project. ... 21
3.3.6 Advance arduino ADC ... 21
3.4 Hardware development ... 24
3.5 Relate data with real time clock ... 26
CHAPTER 4 ... 27
4.0 Introduction ... 27
4.1 Choosing suitable voltage... 27
4.2 Choosing suitable iteration ... 29
xii
4.3.1 Algorithm ... 34
4.3.2 Arduino programing code ... 35
4.3.3 Troubleshooting ... 36
4.4 Relate Data with real time ... 37
CHAPTER 5 ... 41
5.0 Introduction ... 41
5.1 Summary project ... 41
5.2 Achievement of Research Objectives ... 42
5.3 Suggestion for Future work ... 42
APPENDIX A ... 44
APPENDIX B ... 45
xiii
LIST OF FIGURES
Figure 2.1: Waveform with frequency increasing from top to bottom. ... 5
Figure 2.2: Digital waveform. ... 5
Figure 2.3: Example sinusoidal wave with zero crossovers detected. ... 6
Figure 2.4:Proposed virtual frequency meter system overview. ... 7
Figure 2.5: zero crossing detection circuit. ... 8
Figure 2.6: LabVIEW block diagram virtual power frequency meter. ... 9
Figure 2.7: User interface of the proposed virtual power frequency meter. ... 9
Figure 2.8: Block diagram of the frequency measurement. ... 10
Figure 2.9: Frequency characteristic of band-pass filter. ... 11
Figure 2.10: frequency characteristic of the filter A and L. ... 11
Figure 2.11: Extech 380947, 400A True RMS AC/DC Mini Clamp Meter ... 13
Figure 2.12: Simpson Electric - F35-1-91-0 - Digital Panel Meter, Frequency ... 13
Figure 2.13: Fluke 434-II Series II Energy Analyzer. ... 14
Figure 3.1: Flow chart of project. ... 16
Figure 3.2: Arduino uno. ... 20
Figure 3.3: Sample programming. ... 22
Figure 3.4: Result from the previous coding. ... 23
Figure 3.5: output voltage from adapter. ... 24
Figure 3.6: Output voltage after voltage divider circuit ... 25
Figure 4.1: output voltage 4.2V ... 28
Figure 4.2 Iteration 100 sampling data delay 400ms ... 29
Figure 4.3 Iteration 200 sampling data delay 400ms ... 30
Figure 4.4 Iteration 300 sampling data delay 400ms ... 30
Figure 4.5 Iteration 400 sampling data delay 400ms. ... 31
Figure 4.6 Iteration 400 sampling data delay 500ms ... 31
Figure 4.7 Iteration 400 sampling data delay 600ms ... 32
Figure 4.8 Measuring frequency result ... 33
Figure 4.9 Algorithm for programming ... 34
Figure 4.10 Arduino sketch ... 35
xiv
xv
LIST OF SYMBOLS AND ABBREVIATIONS
TNB = Tenaga Nasional Berhad
Ω = ohm
1
CHAPTER 1
INTRODUCTION
1.0 Introduction
This chapter will cover the objective of this project, introduction and problem statement. From that, the conclusion will be determined based on the problem. Objectives and scope are very important towards this project because it will give guidance throughout whole the process.
1.1 Background
2 1.2 Problem statement
Usually meter that we use to measure frequency will bring the result in 1 decimal place usually we can get 50Hz. We don’t know if the value really accurate with the grid. Actually, frequencies that supply from utility have tolerance and it not accurate with 50Hz. Everyone know that meter that use to measure frequency very expensive in global market, not many people can buy it.
1.3 Objective
There are 4 main objectives for this project.
1. To develop frequency measurement device with high accuracy. 2. To collect and monitor the frequency data from power outlet. 3. To analyse the grid frequency stability.
3 1.4 Scope
The scope will focus on developing measurement frequency device. All data collected are from 13A socket outlet at home and shown in arduino IDE.
Equipment 1. Arduino.
2. Adaptor AC/AC, Laptop. Observation
1. Frequency.
4
CHAPTER 2
LITERATURE REVIEW2.0 Introduction
This chapter will discuss about information, principle, and theories about frequency. Other researchers also will discuss in this chapter.
2.1 Frequency analysis
5
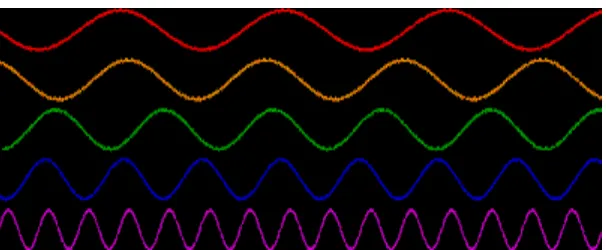
Figure 2.1 above show the top waveform having lowest frequency and the bottom waveform show the highest frequency. Periodic analog signal in real application are complex and can rarely represent by simple sinusoid. Fourier analysis is used to decompose any complex waveform into some of simple function, either sines and cosine or complex exponentials.
(Source: http://www.ni.com/tutorial/7111/en/ 15.5.2015).
2.2 Time period
Time period is the duration of one cycle of a repeating event. The SI unit is in second and the symbol used is T.
Figure 2.1: Waveform with frequency increasing from top to bottom.
6
Figure 2.2 above show simple digital signal, the period is simply the time between rising edges, or even falling edges. If the time between rising or falling edges fluctuating, we need more cycle or period to determine the real frequency.
2.3 Measuring frequency method
Some frequency measurement will use the zero crossing detectors. It happened when 2 consecutive zero crossovers were detected. The timer will start when it detect the first crossover. When the adjacent zero crossovers were reached, the timer will stop and the time will record. The time will repeat process. The time recorded can be sure to be the half the time period of the signal.
From figure 2.3 we can see a sinusoidal wave with zero crossovers detected just in half time period. Frequency can be determine when complete 1 cycle period but with the zero crossovers the frequency also can be calculate with multiply T with 2 and the formula for calculating the frequency will be,
7 2.4 Thesis about previous project
2.4.1 Design of Virtual Power Frequency Meter Based on IEC 61000-4-30 Power Quality Standard.
This thesis present the design of power frequency meter based on IEC 61000-4-30 standard using virtual instrument approach. The virtual power frequency meter hardware consists of a zero crossing detection circuitry and a low cost USB data acquisition card. The proposed virtual power frequency meter design utilizes the zero crossing detection circuitry and the counter unit of the data acquisition card to count the number of zero crosses produces by the power system sinusoidal waveform (Rodney H.G. Tan, S. K. Wong, T. C. Wong. 2013). This project using computer system clock to keep track the total number of zero crosses counted in every 10 second interval to computes the power frequency which can achieve up to 0.05Hz resolution. The system overview of the proposed virtual frequency meter is shown in figure 2.4.
Figure 2.4:Proposed virtual frequency meter system overview.
8 Zero crossing detector.
There is many zero crossing detection method for 50/60 Hz. The component of zero crossing circuit consist 5 diodes, 2 resisters, a capacitors and a transistor. For the circuit use in this project for zero crossing detection as shown in figure 2.5 consist of a step down transformer, a bridge rectifier, a blocking diode, a capacitor, two resistor and bipolar transistor.
Data Acquisition Card
The data acquisition card was selected by this project to interface with the zero crossing detectors to computer. The proposed frequency meter utilizes only the counter of the data acquisition card to keep track the number of zero crosses within a given time interval. ( Rodney H.G. Tan,2013)
Virtual instrument software development.
This project using LabView platform to developed the virtual power frequency platform. LabVIEW is a graphical programming platform and allows the measurement method to easily implemented by connecting functional block together as shown in figure above.
9
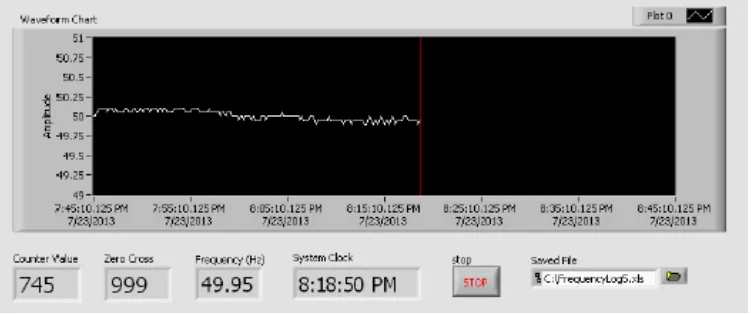
Figure 2.7 show the virtual power frequency meter. The virtual power frequency meter consists of a trend chart counter value, zero crossing, frequency, system clock indicators, stop button and text field for user to key in save filename. The trend chart plots the one hour measurement window.
Figure 2.6: LabVIEW block diagram virtual power frequency meter.
10
2.4.2 A New Method for Measuring Power System Frequency
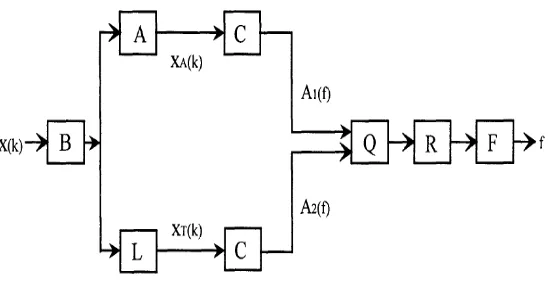
This thesis describes a new method of calculating frequency using sample data. The proposed algorithm has been implemented in many numerical relays to obtain the actual value of the line frequency during operation (Dr. Tevfik Sezi,1999). The new frequency calculation algorithm present by this thesis is precise and the simulation test and field experience have shown a high accuracy of approximately 10mHz.
Figure 2.8 shows the block diagram stages of the frequency measurement. The sampled data X(k) is first filters by a bandpass-filter. The bandpass filter is a two-cycle FIR fourier filter with triangle windowing. The other filters will connected to the output of bandpass filter. One of them is (A) is an all pass-filter, this filter will change the phase angle, but not amplitude of sinusoidal signal. The other filter (L) is a low pass filter. This filter will change the amplitude of the signal, while changing the phase angle of the signal in exactly same way as the A-filter.