Comparison of Open and Short-Circuit Switches Faults Voltage Source
Inverter (VSI) Analysis Using Time-Frequency Distributions
Mustafa Manap
1, a *, Nur Sumayyah Ahmad
1, b, Abdul Rahim Abdullah
1, cand Norhazilina Bahari
1, d1Universiti Teknikal Malaysia Melaka (UTeM), Faculty of Electrical Engineering, Universiti Teknikal
Malaysia Melaka, Hang Tuah Jaya, 76100 Durian Tunggal, Melaka, Malaysia.
a[email protected],b[email protected], c[email protected],
Keywords: Voltage source inverter, Short time fourier transform, Time-frequency distribution, Time-frequency representation, Root means square, Total harmonics distortion, Total waveform distortion
Abstract. Power electronics are highly expanded area in industrial process which offers reliability,
survivability and continuous operation. However, the emergence of switches fault has become a major concern in the development of advanced. Switches faults founded in VSI causing equipment failure and cost increased in manufacturing process. Therefore, the fault detection of voltage source inverter (VSI) is necessary to identify the VSI switches faults. This paper presents the analysis of VSI switches faults using TFDs which are short times fourier transform (STFT) and spectrogram. From time-frequency representation (TFR) obtained by using the TFDs, parameters of faults signal can be estimated such as instantaneous of average, RMS, Fundamental, Total Waveform Distortion (TWD), Total Harmonics Distortion (THD) and Total non-Harmonic Distortion (TnHD) of current signals. Based on the characteristics of the faults calculated from the signal parameters, VSI switches faults can be detected and identified. The performance of TFD for the faults analysis is also demonstrated to select the best TFD for switches faults detection and identification system.
Introduction
In modern electrical systems, voltages and especially currents have become irregular due to the large number of particularly power electronic devices such as adjustable speed drives, power supplies and inverters. In industrial, VSI is extensively used in wide range, including several critical applications where reliability cannot be compromise.
Semiconductors are one of the element that cause major faults in VSI. It is estimated that 38% of the faults traced in power conversion is due to faults in VSI such as open-switch faults, short-circuit faults and intermittent gate-misfiring faults [1, 2]. VSI switches faults increased the maintenance cost have led the research in fault detection in order to improve reliability [3]. The entailed VSI breakdown requires the repair of the VSI to continue the drive operation.
Different methods and analytical techniques are used to analyze the VSI switches fault. For example, Fast Fourier Transform (FFT) method is used to analyzed the current spectrum for characteristics of an open transistor detection [4]. Other researcher used wavelet transform for examined information about the fault signatures for fault detection and classification [5]. Nevertheless, Fourier analysis does not represent temporal information and the wavelets have high time resolution for high frequency component and high frequency resolution for low frequency component. However, most existing fault detection and identification methods have problem that the fault detecting time of one fundamental period between the fault occurrence and fault detection.To overcome this problem, STFT and spectrogram are used to analyze VSI switches faults.
In this research work, TFDs are employed to analyze VSI switches faults to detect open-circuit and short-circuit fault for upper and lower switches. From the TFR using STFT and spectrogram, the
Applied Mechanics and Materials Vols. 752-753 (2015) pp 1164-1169 Submitted: 13.10.2014
© (2015) Trans Tech Publications, Switzerland Revised: 14.12.2014
doi:10.4028/www.scientific.net/AMM.752-753.1164 Accepted: 22.12.2014
parameters of fault current are estimated such as average value, RMS value, total harmonic, total non-harmonic and total waveform distortion. The performances between both techniques in term of identifying best technique are not discussed very clearly in previous study. Therefore, this paper is proposed to compare the performance of STFT and spectrogram which is useful in process of selection the accuary technique for analyzing the VSI switches faults. The result shows, STFT is better tool to analyze the VSI switches faults.
Voltage Source Inverter Switches Faults
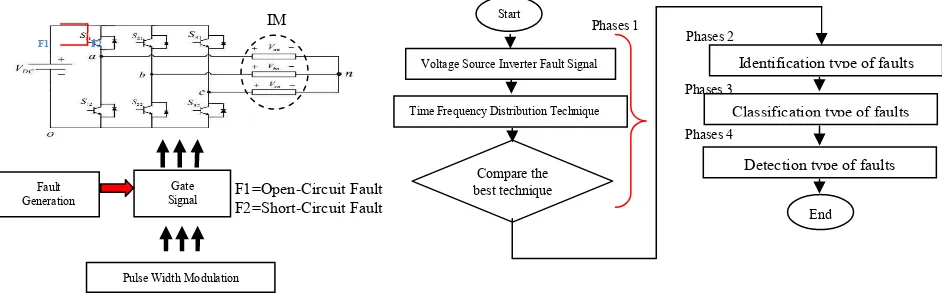
VSI switches faults is modeled using MATLAB as shown in Fig. 1. The model consists of 50V DC and RLC circuit as an arbitrary load. Based on Fig. 1 that shows three modules in the Simulink modeling of VSI consist of module fault generation, gate signal modules and pulse width modulation modules [6-9]. Figure below illustrated F1 indicate open-circuit fault and F2 is short-circuit faults. As mentioned M. A. Rodriguez et al. 2007, short-circuit faults are caused by bond wire rupture, impact ionization, gate circuit degradation and over-current.If short-circuit fault occurs in the VSI system, it will cause system shutdown. But, an open-switch fault does not cause a system shutdown but degrades the system performance.
Fig. 2 shown flow-chart of the analyses system which are consists of four phases. Phases 1is design VSI circuit using Matlab/Simulink then generate fault for open-circuit and short-circuit. Four types of signal current were collected with different condition. From the signal current, two techniques that used which are spectrogram and STFT for analysis signal and parameter was calculated. The phase 2 is VSI system has six switches and each of switches have different condition of signal. The open-circuit and short-circuit switches faults can be identify depends on different signal current pattern. Then phase 3 is parameters estimation such as average, RMS, fundamental and TWD was calculated and summarize the error of current using bar graph for classify type of faults. Lastly phase 4 is summarizing bar graph and table of characteristic that used as a rule detection type of faults.
Time Analysis Frequency Technique
Time-frequency Distributions (TFDs) are used to analyze or characterize signals whose energy distribution varies in time and frequency. TFDs such as STFT or spectrogram is popular and widely used in many applications such as speech, communications, acoustics and power electronic. This technique roughly reflects how frequency contents change over time. Smaller window size is used produce better time resolution but it also reduces frequency resolution. They map the one-dimensional time-domain signal into a two-dimensional function of time and frequency. A time-frequency representation describes the variation of spectral energy over time. Parameters of the faults signal are estimated from the TFR to identify the characteristics of the signal. These parameters are instantaneous of average current, RMS current, fundamental current, TWD, THD and total
Fig. 1 The model of voltage source inverter
Gate Signal
Pulse Width Modulation Fault
Generation
IM
F1=Open-Circuit Fault F2=Short-Circuit Fault
Fig. 2 Flow chart of this system
F2 F1
Start
Voltage Source Inverter Fault Signal
Time Frequency Distribution Technique
Compare the best technique
Identification type of faults
Classification type of faults
Detection type of faults
End Phases 1
Phases 2
Phases 3
Phases 4
2
interharmonics distortion (TnHD) [10]. This paper, STFT and spectrogram techniques are used to analyze VSI switches faults. The equation can be expressed as below.
A. Short Times Fourier Transform (STFT)
(1)
B. Spectrogram
Spectrogram is the squared magnitude of the Short Time Fourier Transform (STFT) where
) (τ
x is input signal and w(t) is window function
(2)
Results
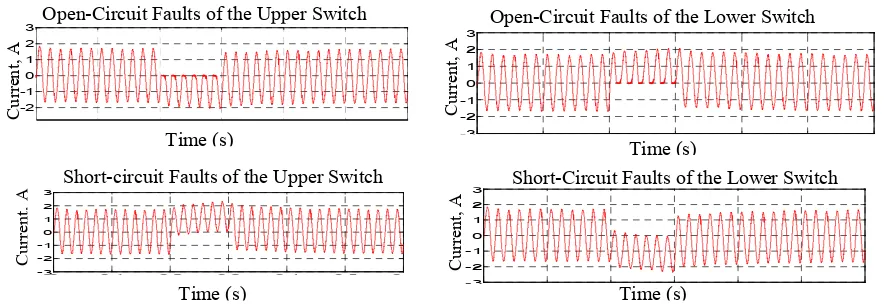
The analysis of results were obtained from the TFDs using STFT and spectrogram. The information in term of spectral and frequency are extracted from the time-frequency distributions. The parameters that are analyzed are average current, RMS, THD, TWD and TnHD values. Based on Fig. 3 show the signal of VSI switches fault consists of open-circuit and short-circuit. A faulty phase current can either be positive or negative depending on the damaged switch. During the current waveform collected, the evaluated of VSI switches faults conducted using both of techniques [6-9].
A. Open-Circuit Fault (Voltage Source Inverter Fault For Upper And Lower Switch)
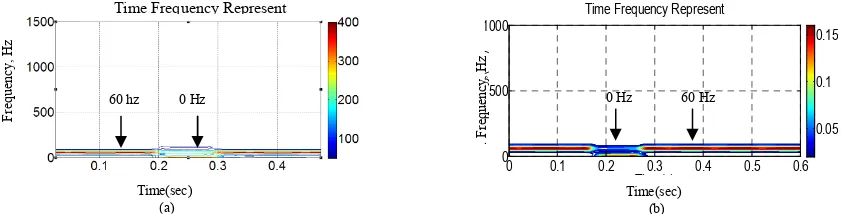
Based on Fig.4 show the comparison of characteristic using STFT and spectrogram then only TFRs as shown below but other parameters as previous paper [6-8].From TFR can be seen the highest power is represented in red color, while the lowest is represented by blue color. The result shows that the disturbance occurs during 0.2 to 0.3 second. Both of techniques represent the same characteristic but different characteristic in term of average current. The value of average current cannot be defined using spectrogram however STFT can be calculated from TFR. So, this is one of advantages STFT techniques.
Short-circuit Faults of the Upper Switch
0 0.1 0.2 0.3 0.4 0.5 0.6
Fig. 3 Open-circuit and short-circuit voltage source inverter switches fault signal
Short-Circuit Faults of the Lower Switch
0 0.1 0.2 0.3 0.4 0.5 0.6
Open-Circuit Faults of the Lower Switch
C
Open-Circuit Faults of the Upper Switch
Time (s)
0 0.1 0.2 0.3 0.4 0.5 0.6
The characteristics of average current when open-circuit fault lower is differents when using
spectrogram and STFT as shown Fig.5. The more detail about result of analysis that as previous paper [6, 7, 9]
B. Short-Circuit Fault (Voltage Source Inverter Fault For Upper And Lower Switch)
Fig. 6 shows the characteristic of parameter for short-circuit faults during upper switch signal. The both of techniques also calculated in term of average current, RMS current and total waveform distortion. Next parameter is RMS current as shows figure below.
During analysis of short-circuit fault lower, the result also shows the all parameter but this faults only represents TWD. The more details about this parameter as show as previous research [6-9]. From result, value of TWD using STFT is highest compare using spectrogram.
C
Instantaneous Average Current, Iave (t)
Phase A Phase C
Phase B
Instantaneous Average Current, Iave (t)
Time (sec)
(a) Time (sec) (b)
Phase A
Phase B& C
Fig. 5Parameter of average current for open-circuit fault lower switches (a) short timefourier transfrom (b) spectrogram
Fig. 4 Time fequency represention (a) short time fourier transfrom (b) spectrogram
Time(s)
Instantaneous RMS Current, Irms (t)
Time (sec) (b)
Phase A
Phase C Instantaneous RMS Current, Irms
Phase C Phase B
Fig. 6Parameter rstimation for RMS current for short-circuit fault upper switches (a) short timefourier transfrom (b) spectrogram
60 hz 0 Hz 0 Hz 60 Hz
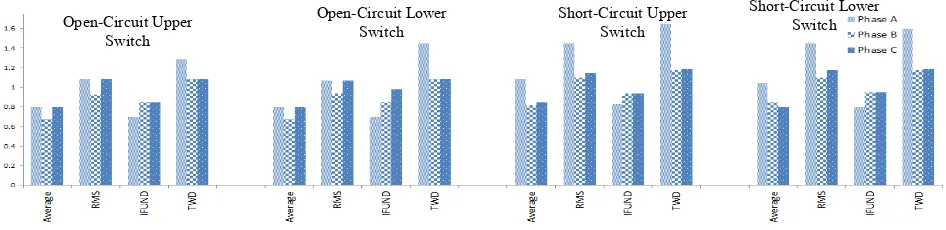
Based analyses using spectrogram, parameter result such as average current, RMS current, fundamental current and TWD was calculated [6, 7]. The Fig.8 illustrated the bar graph of parameter VSI switches faults using spectrogram. This VSI parameters are evaluated for phase A, phase B and phase C. The average current phase A for open-circuit fault upper switches and short-circuit fault lower switch is negative value whereas other fault is positive respectively. Open-circuit fault shows similar value for RMS current then short-circuit fault have different value for three phases. But others parameter of characteristics is similar.
Fig. 8 Signal parameters of switches faults estimated using spectrogram
The similar analyses are performed to obtain the characteristic of VSI switches faults using STFT. By referring Fig.9, the bar graph indicates signal parameter VSI switches faults. Based on bar graph, all of parameters give positive value compared spectrogram. This comparison of both technique are conducted for identify the best technique to analyses VSI switches faults. The STFT is best technique to identify VSI switches faults because gives more information [6-9]
Fig. 9 Signal parameters of switches faults estimated using short times fourier transform
The signal classification of VSI switches faults based on parameter estimation which are average current, RMS current and fundamental are conducted. Table 1 shows the rules based used to classify the type of VSI switches faults.
Open-Circuit Upper
Switch Open-Circuit Lower Switch Short-Circuit Upper Switch Short-Circuit Lower Switch
Open-Circuit Upper Switch
Open-Circuit Lower
Switch Short-Circuit Upper Switch
Short-Circuit Lower Switch
Fig. 7Parameter rstimation for total waveform fistortion (a) short timefourier transfrom (b) spectrogram
0 0.1 0.2 0.3 0.4 0.5 0.6
1 1.2 1.4 1.6 1.8
0 0.1 0.2 0.3 0.4 0.5 0.6 0
0.5 1 1.5
Time (sec)
(a) Time (sec) (b)
Phase A
Phase B & C
Phase A
Phase B & C
Instantaneous Total Waveform Distortion Instantaneous Total Waveform Distortion
Pe
rc
ent
age
, %
Pe
rc
ent
age
, %
Conclusion
The performance analysis presented in this paper provides the understanding comparison of STFT and spectrogram. The analysis of open and short-circuit faults in VSI system have been performed using both techniques. Based on result, the signal parameters are extracted from TFDs. Instead of using VSI switches faults current, rule base obtained from the best method that is STFT. Thus, the accuracy of performance required for determine better of technique and signal parameters that obtained use for classify the type of VSI switches faults.
Acknowledgment
The authors gratefully acknowledge the contributions of Ministry of Higher Education (MOHE) and Universiti Teknikal Malaysia Melaka (UTeM) for providing the research grant ERGS/2013/FKE/TK02/UTEM/03/02/E00025
References
[1] Z.Diqi and Y. Shenglin, Neural networks data fusion algorithm of electronic equipment fault diagnosis, in Intelligent Control and Automation, WCICA 2004. Fifth World Congress, (2004.) [2] L.Bin and S. Sharma, A Literature Review of IGBT Fault Diagnostic and Protection Methods for
Power Inverters, in Industry Applications Society Annual Meeting, 2008. IAS '08. IEEE, (2008). [3] F.W. Fuchs, Some diagnosis methods for voltage source inverters in variable speed drives with induction machines - a survey, in Industrial Electronics Society, 2003. IECON '03. The 29th Annual Conference of the IEEE, (2003).
[4] B. Raison, G. Rostaing and J.P. Rognon, Towards a Global Monitoring Scheme for Induction Motor Drives, Proc. Int. Power Electron. Conf. (2000) 1183-1188.
[5] F. Charfi, F. Sellami and K. Al-Haddad, Fault diagnosis in powersystem using wavelet transforms and neural networks, (2006).
[6] N.S. Ahmad, A.R. Abdullah and N.Bahari, Open and Short Circuit Switches Fault Detection of Voltage Source Inverter Using Spectrogram, J. Int. Conf. Electr. Mach. Syst. 3 (2014) 190-199. [7] A.R. Abdullah, N.S. Ahmad, N. Bahari, M. Manap, A. Jidin and M.N. Jopri, Short-circuit
switches fault analysis of voltage source inverter using spectrogram, in Electrical Machines and Systems (ICEMS), 2013 International Conference on. (2013).
[8] N.S. Ahmad, A.R. Abdullah, N. Bahari and M.A.A. Hassan, Switches Faults Analysis of Voltage Source Inverter (VSI) using Short Time Fourier Transform (STFT), International Review on Modeling and Simulation(I.R.EM.O.S), 7 (3) (2014) 409-415.
[9] N.S. Ahmad, A.R. Abdullah, N. Bahri, Open switch faults analysis in voltage source inverter using spectrogram, in Power Engineering and Optimization Conference (PEOCO), 2013 IEEE 7th International, (2013).
Parameter Type of Fault Observation
Average
Current Open-Circuit Upper Others (IIAA>(I=ICC)<I&IBB)
Short-Circuit Upper
Others IIAA>I>ICC>I>IBB
Short-Circuit Lower
Others IIAA>I>IBB>I>ICC
RMS
current Short-Circuit Upper& Short-Circuit Lower Others
IA>(IB>IC)
IA>(IB>IC)
Fundamental
Current Open-Circuit Lower Others IIAA<I<(IBB<I=ICC)
Table 1 Voltage Source Inverter Switches Faults Classification.