Sesslo, B : Lard, Water and Environnent (Ll /E)
SUPERVISORY CONTROL OF ENVIRONMENTAL PARAMETER
AMMONIA
(NH3)
OF CLOSED
HOUSE
SYSTEM MODEL
FOR
BROILERS
,
Alimuddinl''2, Kudang Boro
Semina13, I Dewa Made Subrata3, Sumiatia'Doctoral
student in Agricultural Engineering Department. Bogor Agricultural-
University 0pB)and 2Department of Electrical Engineering,
Univercity
of Sultan Ageng Tirtayasa,_
Banteng lndonesia3
Lecturer in Agricultural Engineering bepartment, Bogor Agricultural Universjty
alecturer
in Nutrition"no
r"ua
University r"JrliSr)ogv Departemen, (tpB) Bogor Agricutturat ABSTRACT-
The research objectives namely; evatuatingthe
elfectsof
vaious
influencingfaclorc
on
ammonia
emissions
cnvironmentalfrcm
broiler
li
et.and supeviso;/
control amount of ammonia
in
clased hausefor
brcilers. Stalistic a;pproach modelinaof
linear regression using.A
dynamic flow-through chamber systemwas
designeidfor
this
ammonia
emissions
model
development stucly
to
evaluate
modetcomponents
individually
or
in
designed
combinations. SupeNisory
cantrcl af
ammoniais
t$ted
with
toals controlled air impinger and temperature,'humidity use Kestrel 3000. Conclusion of supen/isory control Environmental parameter Ammonia(NH3)
of
Closed
House
System ModetFor
Broilers
hasbeen
tested
with
toats controlled air impinger. Result of ammonia control resultsfor
0.013.25
ppn.
Result of ammonia supeNisory control rcsultsfor
O.OS-j.25 ppm at temperctutu;e 2S_32C0,humidity 73-77.5 %, and
Ait
Velacity 1.7-27mr/h. The amountof
NH3is
influenced by temperaturc, humidity and air vetocity.INTRODUCTION
Ammonia (NH3)
is
a
commonsubstance ptaying
an
importani
role jn
the nitrogen cycle. Sincethe
1980s, agricultural NH3 emission has 6ecome on,^ of themajor worldwide
air
pollution problems and has attracted moreand
more attention from ihe public and government regulatorc.(Ji-ein
Ni,at al,200j)
Ammonia
js
considered
the most
harmful
gas
in
broiler chjcken
housing(Cadile, 1984).
The
importance
of
ammonia emissions
from
animal
feedin!
operations (AFOS)
has
been
well
recognized(Van
der
Hoek,
1991;Zhao
et
al_1994; Sutton
et al.,
1995;Aneja et
at., 2OOO;Arogo
et
al.,
2OO1; Hutchingset
al.,2001;
Leeand
Park,2002;
Battyeet
at., 2003; Hydeet
at., 2003; Xinet
a]., 2003;Wheeler
et al., 2003i
Liang
et al.,
2003;
and
Gaies
et al.,
2004).
However, thecontributions
of
ammonia
emjssjonfrom
large poultry
operationsto the
nationalemission inventory have
noi
been
properly documented.Accurate
estimationof
ammonia emission rate from individual operations or sources is important and yet a
challenging
task
for
both
regulatoryagencies
and
animal producers.
Numerous studies have been reported throughout the world on ammonia emissions from broilerhouses,
and wide
variations have been found among diflerent
studies.
Thedifferences
in
ammonia emission fluxes
from
broiler houses under
diflerentconditions have been reported as high as 55 fold (Redwine
et
al., 2OO2). VariationsI ntern atio n al S ymp a si u
n
Ag icu ltu ra I En gi ne ei
ngSuistainable Agncullurc
n
As€. Bagar. lndonesia,Towards
Novenber 18-19, 20Ag
Sessio,r B r
Lar4
Water and Enviannent (LWE)in
ammonia emissions result
from the
dependence
of
ammonia emissions
on seasonal and regional conditions, house design, and management practices..
.
Broiler chickens are normally raised on litter madeu!
of wheat straw or woodshavings above
an
earthen
floor_The
litter serues
as
manure
"OsoiO"nce.
fne
mixtu.e
of
tter and
manure
representsthe
most
significantsource
of
ammoniaemissions.
The
mechanisms relatedto
ammonia emissionsfrom
manure
involvemany
processes
and
have been
summarized
by
Ni
(1999).
Theoretically, theprocesses
involved
in
ammonia
emissions
from litter
based manure
jncludeconvercion
of
uric acid
to
urea,
hydrolysis
of
urea,
enzymatic
and
microbialgeneration
of
ammonia,
partitioning betweenthe
adsorbed
and
dissolved
phaseammonia,
the
chemistry
of
ammonia
in
aqueous solution, partitioning
betweensolid/aqueous
phase and
gaseous phase ammonia,
and
the conveitivl
masstransfer of ammonia gas from the surface into the free air stream. Factors
ihat
mavinfluence ammonia emissions
from
broilerlitter includej atr and litter
tempeiaturi
ventiiation
rate,
air
velocity,
ljtter pH, liiter
nitrogen
conteni, and litter
moisiure content.Determining
ammonia emissions
is
both
expensive
and
difficult
usingcurrently available
technologies
for
measuring ammonia
concentrations
andventilation
airflow rates under
commercialbroiler house conditions.
ln
order io
jmprove
lhe
accuracy and simplicity of estimatjng ammonia emissions,development of emission models is desired. Emission models allow users io calculaie site_specific
emissions, using
the
local design and operating parameters. Emission modets canalso be used
to
quantify and evaluate the effectiveness of various emission controlstrategies- Evaluating eflects of these control strategies on emissions from livestock buildings
for
full-scale operations can be quite expensive and labor intensive using current measurement methodotogies (NRC, 2003).The
influences
of
managementfactors and litter
condiiions
on
ammonraemission have been
documented (Nicholsonet al.,
2004;
Redwineet
al.,2OO2,Reece
et
aL,
1985; Eltiot andCollins,
j982;
Elwinger and Svensson, 1996; Carr etal.
1990; Brewer
and
CosteJJo,1999),
but they
have
not
been
adequatelyincorporated into current emission models. L4uch work remains
to
be done becauseof the
number
of
variables
in
practice. Further evaluation
of these
variables
is neededfor
enhanced
understandingof the wjde
variation
in
ammonia emlsstonrates. The
Jesearch objectives
namely
:
1)
evaluating
the
effects
of
varjousinfluencing
factors
on
ammonia
emissions
environmentalfrom
broiler litter,
2)Controlling amount of ammonia in closed house for broilers. MATERIAL AND METHOD
Environment parameter
NH3for closed house system
for broilers
.
NH3is
uncoloredgas,
its heavyof
lighter is compared by ajr, water _soluble3111"i9,.b19
NH3, concentrationin
poutiry houseis
diversified-inter
15_
90
ppm. thrs gas is formed by wastedproduci
from biologic process of fesses composition, so that many problems on dirt condition are accumulated by litterAmmonia (NH3)
can be
deteciion
by
processingat
consentrationaloft
20ppm.
>
10
ppm
to
cause lung
surfacedamage.
>20
ppm
increase susceptibility iowarsbreathhg
disease. > 50 ppm to reducegroMh
rapid. lAlchalabi Dhia, Foultry lnternational, Sept 2001).High concentrations of NH3 insjde the animal houses also represent ootential
health hazards to humans and animals (Reece et
al.,
j98O; Carr et al.,t99b:
Crook--Inlernaltonal Synposiun AgricutttJrat Engneeting
Towads
-
Sessio, B - Land, Watet and Environnent (LWE)
et al., 199'1; V\heeler et al.,2000a). Chronic respiratory djseases of swine production facility workers have been attributed to dust and NH3 (Donham et
al.,
199!). Animatrespiratory diseases,
such as
sneezing, coughing,or
pneumonia, increased when NH3-concentrations
were 20-40
ppm
as
compared
with
S-15
ppm
(Busse,1993).Tendon
acid
is famed
N
most many
in
poultry
manure,
and
it
wi
beconversion
by
form
alantoin
by
urease microbe
and
alantoin
is
processing by consistently become ammonia of below figure evident.A
potential existsfor
large
house NH3 emissionseven with low house
NH3 concentration, because large volumes of ventilation air used for thermal comfort andenvironment control. Ventilaiion is closely coupled with weather events and size of birds (i.e. interior heat and moisture loads on the thermal environment). A typical (as
defined
wiih
dimensions
above) .lbroiler'
house ventilation system
dejign
usessidewall
fans
(92 cm, 36 in.) and static pressure controJledeave
inletsfor;ld
and mild weather envjronmental control, and end-to-end airflow with large inlets and fans(122cm,48in.) for
"tunnel" ventilation. Duringthe
hottestweath;r,
the
ventilationsystem switches
from
using sidewall inlets and fans tothe
tunnel ventilation mode,wiih _a volumetric capacity
of at
least
0.8-1 .2 m3 h-rkg-1 market weighi
(1_1.5cfmlb
).
A
typicat
U.S.
{broiter
ho^use_will
have
a
total
of
1l_j5
fa;s,
w1hdesign
fan
capaciiy
of
aboui
270,000mi
h-1 (.j60,000cfm).
Suppternentatheat
isprovided
by
gas-fired furnaces,
brooders,
or
radiant heaters. Some
form
ofevaporative cooling
is
prevalentin
southern producing regions, using eitheropen-cell
evaporativecooljng pads
at the air
inlets and/or fogginq
or
mistino
nozzles drstributed rnside the house(cates
R.S.et al. 2007).Supervisory
Control
for
Poultry
House.
ln
a treatise on
poultryhouse climateand its
control,the
poultry represents,but
also
the
most complex element
of the
pouliryhouse production.'Due
to
this complexity a supervisory control system is desjgned to provide option control modesand
parameters.
The system
is
also
equipped
with
an
optimal pouliry
grow,thselection
to
determine control valuesof
all controlled variablesfor
variousiyies
ofbroilers.
The
system should take care
of
defining
adequate regulatory
andsupervisory frameworks
to
controla
poultryhouse, equipped witha hejting
sysiem,an automatic waterjng system and external and internal independent varia-ble; such
as
temperature,
humidily,
ammonia
and
magnitude,
and
rain drop level
aremonitored
to
support
the
poultryhouse operation.Sensors
and
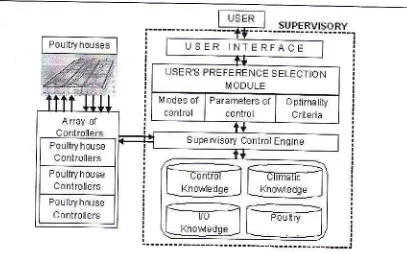
actuators IN/OUT signals must be of analog and digital standard systems.The architeciure of the proposed supervisory poultryhouse control is shown tn
Figure
1
a
user
interacis
with the
supervisory system
to
perform selectjon
or determinationof control
modes, controlled parameters,and
optimality criteriafor
acertain poultry cultivated in
a set
of poultryhouses. Afterwards,the
uier
preference specjfications are passed to the Supe,.vlso4l Control Engine(SCE)that
performs the m€in supervisory computation scenario by utilizing the knowledge_baseii.e.,
control,climatic, crops,
and
I/O
knowledge).
The
SCE
ihen
produces
sei
oi
controtinstructions
to
array
of
controlJersthat
direc
y
conttoi
and
monitor
a
set
of
poultryhouses.I nternational Sympasiun Agicultu rat Engineeting Tawards
Suistainable Agriculture in Asia, Bogor, tndonesia, Novembet lB-19, 2AOg
Sess/b, B r
Lar4
Water and Envionnent (LWE)Poultl'y'houses
USER
INTERFACE
USER'S PREFERENCE SELECTION
l\,IODULE
lvlodes of conirol
Farameters of conlr0l
0 ptimaliv
Cileia
Poultryhouse ContmllErs P0ultryh0use
Controllers Po!liryhouse
ControllEr!
Sup€tuisory Conirot Enqire
rl
Knoldedge knor,ledqe
[image:4.595.109.516.68.322.2]oultry knov edqe
Figure
L
The architecture of poultryhouse supervjsory control svstem(adopted irom Seminar et a/, 2006.)
.
The
Control
Knowledge-Baseis
a
knowledge reposjtoryof
various
control methodologies, constraints, tools, and requirementi.hi
Cti.itic Xni*iiiqi_aas"
)!l:.:_:Jl..i{orrn"Jion
about c!.natic
parametersand
characteristics.
rnJ
pouttry
f
llwt,edSe-.81s9is
a
knowledge repositoryof
pouttry requirements. pouttry typesand characteristics.
The
l/O Knowledge-Base stores all relevant chara;teristics andf
1q9-:"!yI"r9nl" "f
t/O devices (sensors, iransducers and actuators) that may betnvolved tn a certain control scenario
.
lmplementationof
taking amission amonia
by using
ln
spectrophotometermethod.
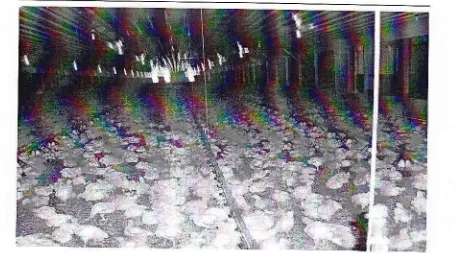
Closed house volume: 120m long,
t2 metirs wii'e
"nO Z.O
nieteis tigh,
number of
I
fan 50 inch fan size The number of 20,OOOone{ime
chicken production. l|.-r^d-Ttllilv- 1."-",.91 r,?lhat
98% mortatiiy2yo
First sampled usinga
9 p;ini
i;;"nsur
arr samptes taken three times rhe
volume
length of middle .12meter. right and left 3_
4.5
meters,the
next ammonia emissjons putlnto the
air box andthen"tesd
in the laboratory using a spectrophotometer.lntefidhonal Symposium 49ticuttutdt Engtneering Tawards
Sesslon B r Lan4 Water an.l Envircnnent (LWE)
dlcl/dt
= OCo,V + JA/^,/-
OCA,/ ln which,J = (Q/A) Cs, "r,",oer
ln which,
Cs.state. cha.bu,
[image:5.595.89.547.68.321.2]is the
ammonia conceniration inFigure
2.
Closed house system forbroilers
(University of farm lpB, Bogor,2008)The
ammonia
fluxes from
the
litter surface inside
the
chamber
can
be calculated using the following equation:...(1)
C : ammonia
rrass
concenrration in the chamber, mqfl
J: Q : flow rate of the caff.e. gas through the chamber, m3 h-r; Co: ammonia concentration in the calrjer gas stream, mg m-3;V : volume of the chamber, m3;
J : ammonia emission flux, mg m-' h 1; A: chamber bottom surface area, m2.
Since
background ammoniawas
removedfrom the
carrier gas,
Co=o.At
steady state,dlcydt=o.
Therefore,the
arnmonia emissionflux J
can -beobt;ined
from thefollowing equation:
...
...
.(2)the
chamberat
steady ..The
dynamic
flow{hrough
chamber
was bujlt
to
simulate
the
convectiveconditions in an actual brojler house. The ventilation rate and ajr velocity at the litter
surface
has
been
recogn;zed
as
two
important
faciors
that
affe6r
ammoniaemissions. Based
on the
ventitation
rates
reported
by
Lacey
et
al.
(2003)
andcuiziou
&
Betine (2005),the
air residence time has beenesti;ated
inttie
rangeot
59to
191 seconds for a tunnei-ventilated broiler house in Texas and in the rangeof
260
to
36000
secondsfor a
broiler housein
France.The
ventilationraies of
thechamber (air flow rates through the chamber) in this reported pretiminary iiuOv lvere
set from 10.0 to
74.0l/min,
which caused resrdence time of air rn the cnambei to Oe 40 t0,300 seconds. Although the ventilation rates can vary wjdely in practice, Brewer and Costello (1999) reported thatthe
mean airspeed
al-a 25 dm hdight ts O.r4 m/s with a standard deviation of 0.j4
m/s in a typical broiler house. ln a tu;nel_ventjtated-lnternational Synposium Agricultural Engineeing
Towads
-
sess/o, B r Latd, Water and Envircnnent (LWE)
broiler house,
air
velocity
at the
litter surface
is
believed
to
be
higher,
but
noreported
data has
beenfound.
ln
this
reportedstudy,
a
hotwire anemometer wasplaced at about 2.5 cm height above the litter surface in the chamber to measure air velocity proflle
in
the
chamber.lt
was found that,the
RPM of the
stirring impellerwas the only
significant factorthat
determinesthe
airvelocity
at the
litter surfacewhen the ventilation rate
(airflow rate) of
chamberwas less than or
equalto
74Umin. Therefore, in the chamber system, ventilation late and air velocity at the litter
surface can be
set
independently.At
110 RPIVI,the
air velocity atthe
litier surfacewas
measuredin the
rangefrom
0.10to
099
m/s
at
various
distancesfrom
the centerto the wall of the
chamber.
Understandingand
control
of
NH3
at
animalfacilities depend
on
sampling/measurement
techniques, including
devices, instruments,and
procedures. Accurate and reliable techniques provide high quality data that are essential to research as well as abatement of NH3 emissionsThe Placeof
experimentin
University Farm, Cikabayan FieldUnit,
IPB Bogor and Analisysof
ammonia
in
laboratory
of
Ergonomic
and
Electronic,
Agriculture
EngineeringScience, Bogor Agricultural
University.Control
of
ammonia
is
tested
with
tools conirolled air impinger and temperature, humidity use Kestrel 3000.Modeling Approach
with Statistic
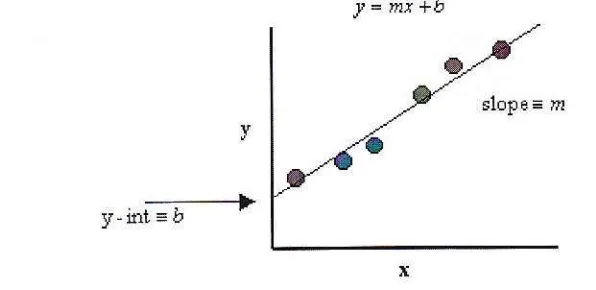
Say
we
have
a
set
of
data,
(Xi,Yi), shownat
the
left.
lf we
have reasonio
believe that there exists a linear relationship between the variablesx
and y, we canplot
the
data and draw
a
"besfiit"
sfraight/lte
throughthe
data
Of
cource, thisrelationship
is
governed bytlre
familiar equationy= mx
+b
.We
can then find theslope, m, and y-intercept, b, for the data, which are shown in the figure below.
t
.
-
.---F
y-flrt
=tr
Figure 3.Linear regression of relationship between the variables x and y
(Bloch
C S, 2005)Let's enter
the
above data into an Excel spread sheet, plot the data. create airend
line and dlsplav its slope, y-intercept and R-squared value. Recall thatthe
R-squared value is the square of the correlation coetficient. (Most statistical texts show the correlation coefficient as"/',
but Excel shows the coefficient as "R". Whether youwrite
is as r or
R,the
correlation coefficient givesus
a
measure ofthe
reliability ofthe
linear
retationship betweenthe
x
and
y
values.
Cy'aluesclose
to
1
indicate excellent linear reliabiliiy.))lf we expect a set of data
io
have a linear correlation, it is not necessary for usto
plot the data in orderto
determine the constants m (slope) andb
(y-intercept)of
lntenatianal Synposium Agticultu ral Engineeing Towatds
Suistainable Agriculturc in Asia, BogaL lndonesia, Novembet 18-19,2009
[image:6.595.142.440.392.537.2]Sesslo, B r Lard, Water and Envircnnent (LWE)
3)
the
equation. lnstead,
we
can
apply
a
siatistical treatment known
as
linear regression to the data and determine theseconstants
(Bloch .C.S 2005)Given a set of data with
l]
data points, the slope and y-intercept can be determined using the following:,rfllry)-f,rf r
---i--:i
__;----ii
,xl,'l
lz-l-
..
(b=
Er-.1"
..(4 )
(Note that
the
limits of the summation, which are Ito n,
andthe
summation indices on x and y have been omitted.) (Bloch .C.S 2005)It is
also
possibleto
determinethe
correlation coefficient, r, which gives us ameasure
of
the
reliabilityof
the
linear relationship betweenthe
x
andy values
A
value of
r
=
'1 indicates anexact
linear relationship betweenx
andy
Valuesof
r
closeto
1 indicate excellent linear reliability. lf the correlation coefficient is relatively far away from '1,the
predictions based on the linear relationship,y=mx+b, will be less reliable.Given a set of data (Xi,Yi) with n data points,
ihe
correlation coefficient, r, can be determined by-
_
,tr('r)-Z"Xr
RESULTS AND DISCUSSION
Examining of data taken from an experiment in which the circumferences and
radii of several circular objects were measured. The data is displayed in the screen
shot
to the
right. For more
information onforThe
R-squaredvalue is
actually ihesquare
of the
corelation
coefficient-The
correlation coefflcient,
R, gives us
ameasure
of
the
reliabilityof
ihe
linear relationship betweenthe
x
andy values
A
value
of R
=
I
indicates an exact linear relaiionship betweenx
andy
Valuesof
R closeto
1 indicate excelleni linear reliability. lf the correlation coefficient is relativelyfar away from 1,
the
predictions based onthe
linear relationship,y
= mx + b, will beless
reliablematting
the
data
and
displaying
the
text
see
the
previous tutorials.(Bloch. C. S., 2005).(5)
lnternational Sympasiun Agricultural Engineeting Towards
Suistainabte Agticulture in Asia, Bogor, lndanesia, Novenbet lS-19' 20ag
Sesslo, B r Land, Water and Envirannent (LWE)
Correlation of
Ammonia
with
Temperature
o
o)=
(!
o)
E
c,
F
30
25
zo
15
10
50
a,6
Ammonia (ppm)
Relation ammonia with
and 12 m coffelation
ceffficient R <1
Relaiion
ammoniawith
humiditycorelation
ceffficient R still is smalltemperature result
of
distance betweendot
percepiion 6mresult
of
distance between
dot
percepiion 6m but'12 m to approach R=1Correlation
of
Ammonia
with
Humidity
s
E
3
E
=
-79.0
78.0
77.O
76.O
7s.0
74.0
73.O
72.O
46
Ammonia (ppm)
! nter n ation al sym posi u
n
Ag ti cu lt u tu I E ng i n ee ri n gf
ow ardsSuistainable Agriculfure in Asia, Bogor, lndonesia, November 1B-19, 2009
Sess/o/'r B : Laral, Water and Environnent (LWE)
Correlation of Ammonia
with
Air
Velocity
o
(u
2.5
2
1.5
1,
0.5
0
46
Ammonia (ppm)
Relation ammonia
with air
velocity
resultof
distance betweendot
perception 6m correlation ceffficient R still is small but 12 m to approach R=1CONCULATION
Supervisory Control
of
Environmental ParameterAmmonia
(NH3)of
Closed House System Model For Broiiers has been tesied with tools contlolled air impengerand temperature, hurnidity use Kestrel 3000. Result
of
ammonia control is amount 0.05-3.25 is influence by temperature, humidity and air velocity.Resut
of
ammonia supervisory
control
results
for
0.6-9
lpm
attemperatuture
25-32C0.humidity 73-77.5
o/o.and
Air
Velocity
1.7-27m'lh. The
amount of NH3 is influenced by temperature, humidity and air velocityRECOMMENDATIONS
This
researchln
designinga
supervisory environmental parameter ammoniacontrol
of
closed
hoLrsesystem model
for
broilers
has been done and
testedammonia
with
statistic
analysisin
ihe
next
recommendaiionhave
to do
research control of environmental parameter ammonia with analysis adificial lntelegence.REFERENCES
Aneja,
V.P., 1976.
Dynamic studiesof
amrnonia uptakeby
selected plant speciesunder
flow
reactor conditions. Ph. D. Thesis, NC State University. Raleigh, NC,p.216.
Aneja,
V.P., J.P.
Chauhan and J.T. Walker. 2000. Characterizationof
atmosphericammonia ernissions
from swine waste storage and
treatment
lagoons. Journal of Geaphysical Research 105, 11535-11545.lnternatianal Symposi un1 Ag icultu
nl
Engineeing TowadsSuistainable Agticulturc ir) Asia, Bagat, Indanesia, November 18-19,2009
Sesslon 8 r lard. Water and Enaronnenl (LWE)
Arogo,
J.
P. W. Westeman, A. J. Heber,W
P. Robarge and J. J. Classen.2001. Ammonia in animal prodoction. Paper No. 014089, preseniat
the 200'1ASAE Annual lnternational Meeting in Sacramento, CA, St. Joseph, lvll. Bloch .C.S 2005,Exel for Engineers and Scientists, Second Edition, publisher by
John Wiley and Sons, lnc, New York
Battye,
W, V.
P. Aneja and P.A.
Roelle. 2003. Evaluation and imprcvement of ammonia emissions inventories.Atmospretc
Environment 37(27): 3873-3883.Busse,
F.-W
1993. Comparison measurementsof the
house climatein
swine stables with andwithout respiratory diseases
or
cannibalism-In
Lfuesfock Environment lntemational Synposiurr, eds, E. Collins and C. Boon. 904-90S Universityof Warwick,
Coventry, England, 6-9 July. Ame.ican Society of Ag.icultural Engineers, Michigan, USA,
Carlib, F. S. 1984. Ammonia in poultry houses: A lrteEture rcriew. Wodd's
PouW
ScrbnceJ
40: 99-113.Caff. L.E. F. W- Wheaton and L.
W
Douglas. '1990. Empirical models to detemine ammon'e concentrationsfrcm
broiler chickenlitter.
Transactionof
theASAE, V al. 33\4): 1 337 -1
U2
Crook, 8., J.F. Roberlson, Glass Sat, E.M. Botheroyd, J. Lacey, and N4.D Topping '1991. Airborne
dust,
ammonia, mic.oorganisms,and
antigensin
pig confinement houses and the respiratory healthof
exposed faam_workers.Aneican
lndustial Hygiene Association Joumal 52(7\:271'279Brewer, S-K. and T.A. Costello. 1999. ln situ measurement ofammonia volatilization from broiler litier using an enclosed air chambet. Transaction of ASAE, Vol.
42(5), 1415-1422.
Elliott, H.A. and N. E. Cotlins. 1982. Factors affecting ammonia release in broibr houses. Lans. ASAE 25(2).
413424
Elwinger K. and
L.
Svensson. 1996. Efiectof
dietary p.otein content, litte. andd
nker
types
on
ammonia emissionfrom
broi'ea house-Joumal of
Agicultural Engineeting Rosearch, 64, 197 -248Guiziou, F. and F. Beline. 2005. ln situ measurement of ammonia and g.een house gas emissions frcm broiler houses in France. B/b.esou/ce Technology, 96, 203-207.
Gates, R.S, et al; 2005, l\4ethod for Measuring Ammonia Emissions from Poultry Houses, Symposium Air Emissions and Poultry Production, pp 622-634. Hashimoto A G and D. C. Ludington- 1971. Ammonia desorption from concenkated
chicken manurc
sluries.
LivestockWaste
Managementand
Pollution Abatement, Proceedingsof
the
lnternational Symposiumon
Livestock Wastes. St. Joseph, Ml: ASAE, , 117-121.Hutchings, N. J., S. G. Sommer, J. M. Andersen and
W
A.
H. Asman.2001. Adetailed ammonia emission
inventory
for
Denmark.
AbnosphoicE
v/rormerl 35(1 1)i '1959-1968.Hyde, B. P., O. T. Carton, P. O'Toole and T. H. Misselbrook. 2003. A new inventory
of
ammonia emissionsfrcm lrish
agriculture. Atmosphetb Envircnment 37(1): 55-62.lnternational Synposiun Agricultunl Engineeing fow ards
suistainable Agnculturc in Asis 8ogor, lndon$ia, Novembet 1&19,2409
Seseor B . Lard wetet and Envircnnent (LWF)
Ji-Qin
Ni
and AlbertJ.
Heber,2001, Samplingand
Measurementof
Ammonia Concentrationat
Animal Facilities, ASAE Annual lnte.national Meeting, California, USAKamin, H., J.C. Barber, S.l. Brown, C.C. Detwiche, D. Grosjean, J.M. Hales, J.L.W Knapp, E.R. Lemon, C.S. lvlartens,
A.H.
Niden,; R-P. \Mlsonand
J.A. F.aziet- 1979. Ammonia. Baltimore: Univelsity Park PressLacey, R-E.,
J.S.
Redwineand
C.B. Parnell,Jr.
2003. Particulate matter and ammonia emission factors for tunnel_ventilated broiler production houses in the Souihern U.S. Transactbns of ASAE,Vol
46(4): 1203-1214.Lee, Y. H. and S. U. Park. 2002. Estimation of ammonia emission in South Korea. Watet Ajr and Soil Pollution 135114t:23-37.
Liang Y., H. Xin, A. Tanaka, S. H. Lee, H. Li, E. F. \'a,fteeler, R.
S
Gates,J
S. Zajaczkowski, P. Topper and K. D. Casey. 2003 Ammonia emissions from U.S. poultry housesr Partll -
Layer houses Pp, 147-158, Prcceedingsof
Thid lnternational Conference on Air Pallutian frcm Agricultural Operafions. Ralelgh, NC.
Liang,
Z.
S., P. W. Westman, J- Aro9o. 2002. Modeling ammonia emission from swin€ anaerobic lagoons. Transaction ot ASAE, Vol. 45(3), 787-7S8.National Research Council
(NRc).
2003.Air
emissions from Anlmal Feeding Operations: Cuffent Knowledge, Future Needs. Nalional Academies Press, Washington, DC.Ni, J. '1999. Mechanistic models of ammonia release from liquid manure: a review. J. Agtb. Engng Res. 72, 1 -17.
Nicholson. F.A., B- J. Chambe.s, A.
W-
Walkei2004
Amrhonia emissions f.om broiler ljtterand
laying hen manu.e management systems, Brbsysfems Engineeing, 89(2), 17 5-185 .Olesen J
E
and S.G. Sommer. 1993. ft4odeling effects of wind speed and surfacecover
on
ammonia volatilizationfrom
slored
pig
slurry.
Arnospherc Environment. Patl A. General Topics, 27(16), 2567-2574Redwine, J.S., R.E. Lac€y, S. Mukhtar, and J B. Carey
2002
Concentration and emissionsof
ammonia and particulate matter in tunnelventilated broiler houses under summer oonditionsin Te\as.
Ttansactionsof
ASAE, Voi. 45(4): 1101-1109.Reece, F.N., B.D. Lott, and
W
Deaion. 1980- Ammonia in the atmosphere during broodingaffects perfomance of broiler chickens- Poulf,? Scletce 59(3):486488 Reece, F.N., B. D. Lott and B. J- Bates. 1985. The peformance of a computerked
system for control of broileFhouse environment. Poultry. Sci. 64'.261'265 Seminar, K.8., suha.diyanto H., Hardioamidjojo,
s,
Tamrin 2006.A
supervisoryControl System
for
Greenhouse. Poceedingsof
Regional Computer Postgraduate Conference (ReCSPC'06), Malaysis, pp 30-34Sutton, M. A., c. J. Place, M. Eager, D. Fowler and R. l. Smith. 1995 Assessment of the magnitude of ammonia emissions in the United Kingdom. Atmospheic Envircnnent 29(12\: 1393-1411 .
Svensson,
L
and
l\,'1.Ferm.
1993.Mass
transfer coefficienland
equilibrium concenkationas
key
factorsin
a
new approachto
estimate ammoniaemission
from
livestock manure,Joumal
of
Agiculturcl
Engineedng Resoarch- 56, 1-11.Intenational Synpasiun Agdcultuftl Engineeing Tawards
Suislainable Agricultute in Aeia, Bagat, lndanesia, Navenbet 1&19, 2oA9
Session B : Land, Watet and Environment (LWE)
Van der Hoek, K.
W
1991. Emisgion facto.s for ammonia in The Netherlands. IIASA Workshopon
Ammonia Emissionsin
Europe: Emission Factors and Abatement Costs, Luxemburg, Austria.Welty J R., C. E. Wicks, R. E- Wilson. '1984. Fundamentals of Momentum, Heat, and Mass Transfer. 3 edn. New York: Wiley.
Wheeler, E.F., J.L. Smith, and R.lM. Hulei.2000a. Ammonia volatilization from litter during nine broiler flocks.