DOI: 10.12928/TELKOMNIKA.v14i1.2454 110
Underwater Channel Characterization to Design
Wireless Sensor Network by Bellhop
Nima Bahrami*, Nor Hisham Haji Khamis, Ameruddin Baharom,Azli Yahya
Department of Electrical Engineering, Universiti Teknologi Malaysia (UTM), Skudai, Malaysia *Corresponding author, e-mail: [email protected]
Abstract
Acoustic underwater link due to low attenuation is employed for underwater sensor network (UWSN). Due to water changing physical properties and different environmental conditions, the sound propagation for every underwater channel are different. So, the most important parameters to design reliable UWSN are: the shadow zone determination, optimum nodes placement, high signal to noise ratio and more power efficiency of nodes. This paper simulates underwater channel for 7 KHz carrier frequency, with measured physical water properties and remote sensing data. Based on defined scenario, the research determines optimum nodes placement and link budget analysis based on bottom to surface acoustic link. The paper utilizes Bellhop acoustic toolbox as a simulator, GeoMapApp program to collects bathymetry data and Aviso+ database to determine wind speed on sea surface. As a result the paper based on simulation of sound propagation in channel and transmission loss determination in depth and range, finds the optimum nodes positions and link budget calculation to prove the results.
Keywords: Underwater channel characterization, Underwater sound propagation, Underwater link budget, Underwater node placement, Bellhop
Copyright © 2016 Universitas Ahmad Dahlan. All rights reserved.
1. Introduction
Recently, many researches focus on underwater wireless sensor network (UWSN) due to wide employment in Military, Oil industry, Fishing, Biology and climate changes detection [1]. Due to poor performance of high frequency cause of high attenuation, the acoustic band is utilized for long-haul underwater communication. This band has many limitations such as: low speed signal travelling (1500 m/s) and limit bandwidth (KHz) [2]. Therefore, the implement of UWSN faces to many difficulties. On the other hand, the underwater nodes by reason of complexity and water resistant packaging in high pressure situation are expensive. It equals to low node density and longer range between nodes in UWSN. The node placement in long-haul communication is very complex, due to transmission loss, signal to noise ratio and multipath calculation. This paper focuses on underwater channel simulation to determine link budget between nodes.
1.1. Underwater Sound Propagation
Acoustic propagation in water is based on Snell-Descartes law. This law determines ray refraction behaviors according to many factors such as: incident and reflection angles and the speed profile for two media. The Figure 1 and Equation (1) illustrates Snell-Descartes law [2].
1 2
1 2
cos
β
cos
β
c
c
(1)Accuracy condition:
2
1
or
1
(
cos
β
β
c
1/
c
2 ) (2)media interface (critical angle), the Equation (3) represents the formula. Third, the ray comes back to its incident media again (total reflection), when this phenomenon occurs which transmitted ray angle is higher than critical angle. The Figure 1 shows the total reflection. A wave path between two points will be named an acoustic ray [2].
Figure 1. Reflection and refraction of plane wave
Figure 2. Refraction of a wave with a discontinuous and continuous
arccos
c
β
(c
1/
c
2) (3)When the media layer is more than two then the law becomes like as Equation (4):
1 1
i i i icos
β
cos
β
c
c
(4)The refraction relation along coordinate z can be generalized into:
C onstant cosβ ZC Z
(5)
The Figure 2 shows the refraction waves with discontinuous and continuous sound speed distribution with depth [2].
1.2. Signal Attenuation and Loss in Underwater
Signal attenuation is due to the viscous absorption phenomenon, it refers to fluid resistance against flow. The boric acid and magnesium sulfate salt are the two important seawater materials, which are causing this phenomenon. The signal attenuation is heavily dependent on employed frequency. If the carrier frequency is higher than hundred hertz, the attenuation can be described by Thorp equation [2, 3].
α= 2 2
0.1
1
f
f
+ 2 240
4100
f
f
+2.75 Χ4 2
10
f
+ 0.003 (6)The propagated signal is faced to surface agitation, this occurrence is reason of signal dispersion and energy loss. The surface loss is computable by many models such as: Eckhart, Schulkin-March is[2, 3].
The signal after hitting to seafloor deflected and loses its intensity as well. The bottom loss is dependent on seafloor coverage and topography, and based on utilized frequency is calculable by LFBL, HFBL and HFEVA model [3].
1.3. Underwater Noise
to 100 Hz. The most important noise that can cover acoustic band is surface wave noise, which is spread on 100 Hz until 50 KHz. The equation (7) described wave noise [3, 5].
10log
N
w
f
= 50 + 7.5w
1/ 2+20 log f - 40log (f + 0.4) (7)Where W is wind speed based on meter per second (m/s).
1.4. Underwater channel
The significant of underwater channel characteristic is time-varying behavior. Every phenomenon which is able to change medium such as surface agitation, seafloor undulation and physical properties of water, are the reasons of channel time-varying property [6]. Underwater channel is consist of many ducts that separated by different sound speed. This difference is the result of changes in physical water properties (temperature, salinity and depth) [2, 3]. To simulate accurate underwater channel model, the remote sensing information from network nodes positions and CTD (conductivity, temperature, depth) data are essential.
1.5. Sound speed
Sound velocity in water is function of pressure, temperature and salinity. It means the sound speed between surface and sea bottom has variation (depend on depth), and it will modify with climate changes and seasons as well. There are many models such as Mackenzie, UNESCO, Chen and Millero for SSP calculation, based on the water physical properties range. This paper selected Mackenzie formula regarding to case study CTD measurement. This equation is accurate for the temperature 0 to 35 °C, salinity 0 to 40 parts per thousand and depth 0 to 1000 m. The equation (8) shows the Mackenzie's equation [2, 3].
SS = 1449.2+4.6T−0.055
T
2+0.00029T
3+ (1.34−0.01T) (S − 35) + 0.016 D (8)Where T is temperature in degrees Celsius, S is salinity in parts per thousand and D is equal to depth in meters.
1.6. Underwater node
Nowadays, the researches focus on sensor nodes with smaller size, ultra power saving, more storage to buffering, high process capacity and more bandwidth efficiency. In fact, underwater nodes are modems which sensors are connected to them. The node task is information collection from sea and transmitted to other nodes, generally. This information may include data from Oxygen, sediment, CTD sensors or processed data such as positioning, detection and tracking, exploring procedures [7].
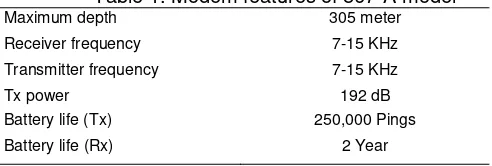
The node maintenance and installation process in seafloor due to nodes non-availability are expensive and costly. So, the battery replacement in short time is impossible. This problem will be solving with reliable design of communication link and best node placement. In this paper, all simulations are based on acoustic releases modem by 867-A model from Teledyne Benthos Company. The Table 1 shows features of this modem [8].
Table 1. Modem features of 867-A model Maximum depth 305 meter
Receiver frequency 7-15 KHz
Transmitter frequency 7-15 KHz
Tx power 192 dB
Battery life (Tx) 250,000 Pings
Battery life (Rx) 2 Year
1.7. BELLHOP
propagation in water columns with consideration of sound speed profile, top and bottom boundaries, reflections and Tx, Rx qualifications. For study on theoretical background refer to reference [9].
The Figure 3 depicts the input and output files for the toolbox. All information from channel quality, Tx and Rx characteristics, altimetry and bathymetry data are coded in environmental file as an input (file.env) [9-11].
Bellhop is able to analyze and calculate signal transmission loss in different ranges and depths, over the channel. The acoustic toolbox outputs are: sound speed profile, transmission loss, Impulse response, Eigen rays and time series in receiver based on simulated channel. This paper focuses on overall transmission loss achievement by underwater channel simulation through Bellhop toolbox [12].
Figure 3. Bellhop input and output structure
2. Research Method
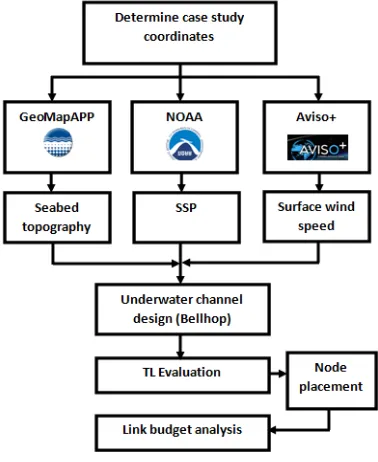
This paper simulates underwater channel for acoustic signal propagation based on Bellhop acoustic toolbox. The simulated channel covers all attenuations, surface and bottom backscattering based on real wave level and geographic seabed information, on November 2013 in Desaru beach on eastern shore of Johor in Malaysia. Because of all data is extracted from real databases from nodes positions, the simulated channel is very accurate and reliable. In this section, the paper explains all simulation procedures, the Figure 4 shows methodology chart. The simulation refers to Table 2 assumption has been done.
Table 2. Underwater channel properties
Range 28 Km
Frequency 7000 Hz
Seafloor coverage Rock Sea surface wind speed 4 (m/s) Source fan-beam 0.5° deg Communication type Simplex
After determination of the case study area, the GeoMapApp program is utilized to collect seafloor geographic data [13]. The research is employed Aviso+ online database, to obtain surface wind speed [14]. The salinity, temperature and depth of position are measured on November 2013 as an experimental measurement. The SSP is determined by Mackenzie model, and all these information are coded to bellhop toolbox as an environmental file, then the TL evaluation process runs to determine the best node placement. Finally, the link budget is calculated.
2.1. Environmental Data
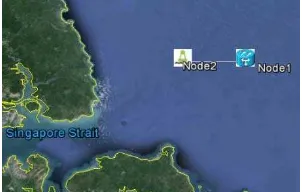
The environmental records are accessible from online databases such as: National Oceanic and Atmospheric Administration (NOAA) [15] or Woods Hole Oceanographic Institution (WHOI) [16], Bedford Institute of Oceanography (BIO) [17]. But, this paper, utilized self measurement of case study on November 2013 in Desaru beach on eastern shore of Johor in Malaysia, on the South China Sea. The link starts on (104.875° E, 1.625° N) until (104.625° E, 1.625° N). The distance between nodes is near to 0.25 degree longitude, around 28 Km. Figure 6 shows nodes location, Node1 duty is broadcast signal to Node2, by means of simplex communication link.
Figure 6. Nodes location
2.2 Altimetry and Bathymetry Data
To get altimetry data, the paper employed Aviso+ online database. This database collects surface agitation data from Aviso+ satellite that is based on radar technology [14]. Ocean bathymetry and topography obtained by GeoMapApp program [13].
3. Results and Discussion
In this section, the channel simulation with transmission loss determination in different ranges and depths are considered. All simulated results are based on real data that collected from mentioned sources. So, the results are very accurate and reliable.
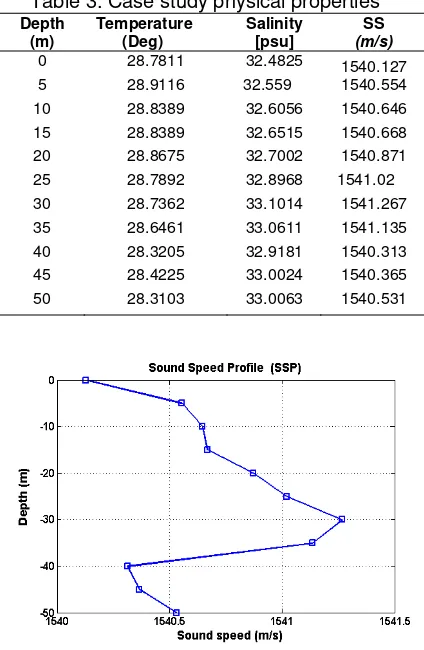
3.1. Sound Speed Profile
Table 3. Case study physical properties Depth
(m)
Temperature (Deg)
Salinity [psu]
SS (m/s) 0 28.7811 32.4825 1540.127 5 28.9116 32.559 1540.554
10 28.8389 32.6056 1540.646 15 28.8389 32.6515 1540.668 20 28.8675 32.7002 1540.871 25 28.7892 32.8968 1541.02
30 28.7362 33.1014 1541.267 35 28.6461 33.0611 1541.135 40 28.3205 32.9181 1540.313 45 28.4225 33.0024 1540.365 50 28.3103 33.0063 1540.531
Figure 7. Sound speed profile
3.2. Sound Propagation
According to our scenario the Tx is placed on seafloor on 50 meter depth. Based on Figure 8, signal travelling start from 50 meter and go directly until 15 Km and due to seabed gradient, the signal bent upward to surface in 22 Km approximately. After this point the signal travels path from bottom to surface, repeatedly. Based on acoustic propagation graph and network application, the decision to choose the best node position for network designer is possible. The aims of paper are node placement and link budget calculation. Then the graph shows 22 until 22.5 Km range is suitable for buoy position. With transmission loss determination the network designer is able to find out the best range and receiver depth to maximize signal to noise ration and more power efficiency.
3.3. Transmission Loss in Range
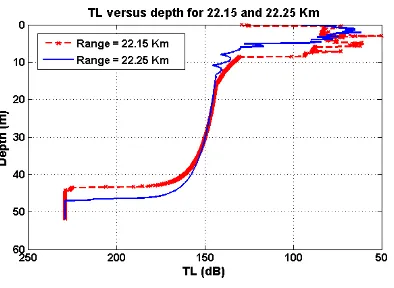
The Figure 9 represents distribution of acoustic signal transmission loss, while signal is travelling in channel. To focus on transmission loss on surface, the paper simulates TL with the receiver node placement on 2 and 5 meter below than surface, supposedly. According to Figure 10, the minimum TL for 2 and 5 meter depths are 22.15 and 22.25 Km range.
Figure 9. Signal TL in channel Figure 10. TL versus depth
3.4. Transmission Loss in Depth
After range determination, the paper should finds out the best depth position. So, the Figure 11 shows the TL for Two found ranges. Finally, excellent depth position for 22.15 Km is 2.92 meter with 50 dB TL and this value for 22.25 Km range is 2.1 m with 61.5 dB TL. So, the link budget calculation for designer is possible.
Figure 11. TL versus depth
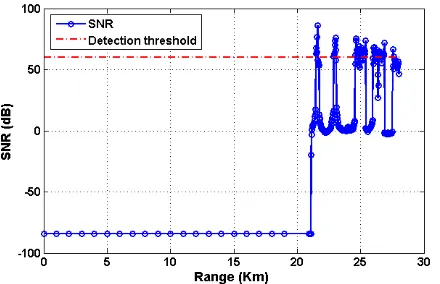
3.5. Link Budget
With calculated overall transmission loss which is included signal attenuation, surface and backscattering loss, the signal to noise ratio by Equation (9) is assessable [2-5].
SNR=SL-TL-NL+DI ≥ DT (9)
Figure 12. Link budget graph
According to Figure 12 the receiver node on surface, with the best mentioned position has 30 dB received power more than detection threshold.
The Figure 7 shows, the sound speed is increased until 30 meters, and between 30 to 40 m is decreasing. The Figure 8 demonstrates, if the velocity increases enough, an acoustic path inclined relative to the straight can undergo total reflection. On the other hand, a decrease in speed will increase the grazing angle of the signal. Based on Figure 10 around 22 Km the signal has two peaks near to surface, the stranger peak has TL values between 50 until 61.5 dB. The graph 11 determines the best node position in depth. As a result the best receiver node position as a buoy stands on 22.15 Km range and 2.92 meter depth with the minimum overall TL with 50 dB value. So, based on link budget calculation the received power has 30 dB power more than detection threshold in optimum point, but after that, receiver faced to many multipath signal which are upper than DT.
4. Conclusion
This paper focuses on underwater channel analysis for acoustic signal travelling by Bellhop acoustic toolbox. The outcomes results of this research are: The signal crossing between ducts is most depend on sound speed changing rate, acoustic signal after transmitting prefer to travels in low speed ducts unless the environmental condition is changed. Based on the TL simulation, the optimum receiver position on surface is determined. According to 867-A modem features; the link budget analysis demonstrates the node placement design has 30 dB safety margin. To have higher directivity index value to better signal to noise ratio, the designer should choose directional transmitter with narrow fan beam characteristic.
Acknowledgements
The authors would like to thank the Universiti Teknologi Malaysia (UTM) and Ministry of Education (MoE) Malaysia for financial support through Research University Grant (GUP 05H41).
References
[1] Heidemann J, Ye W, Wills J, Syed A, Li Y. Research challenges and applications for underwater sensor networking. In: Wireless Communications and Networking Conference, WCNC 2006. 2006; 1: 228–235.
[2] Lurton X. An introduction to underwater acoustics. Principles and applications. Springer.
[3] Hodges RP. Underwater acoustics: Analysis, design and performance of sonar. John Wiley & Sons. 2011.
[4] Bahrami N, Khamis NHH, Baharom A. Evaluation of underwater acoustical intermittent ambient noise. In: Signal Processing & Its Applications (CSPA), 2015 IEEE 11th International Colloquium on IEEE. 2015: 11-14.
Physical Communication. 2008; 1(3): 163-182.
[6] Garcia JE. Ad hoc positioning for sensors in underwater acoustic networks. In: OCEANS’04.
MTTS/IEEE TECHNO-OCEAN’04. 2004; 4: 2338-2340.
[7] Albaladejo C, Soto F, Torres R, S´anchez P, L´opez JA. A low-cost sensor buoy system for monitoring shallow marine environments. Sensors. 2012;1 2(7): 9613-9634.
[8] Benthos T. Teledyne benthos undersea systems and equipment. 2015.
[9] Porter MB. The BELLHOP manual and users guide: PRELIMINARY DRAFT. Heat, Light, and Sound
Research, Inc. La Jolla, CA, USA. 2011.
[10] Rodriguez OC. General description of the BELLHOP ray tracing program. 2008.
[11] Zeiger V, Badri-Hoeher S, Hoeher PA. Model-Based Positioning. Proc Oceanology International (OI12). London, UK. 2012.
[12] Bahrami N, Khamis NHH, Baharom A. Study of Underwater Channel Estimation Based on Different Node Placement in Shallow Water. Sensors Journal. 2015; (99): 1.
[13] Haxby W, Melkonian A, Coplan J, Chan S, Ryan W. GeoMapApp freeware software, v. 2.3. Lamont-Doherty Earth Observatory. Palisades. 2010.
[14] Aviso satellite altimetry data. http://www.aviso.altimetry.fr.
[15] National Oceanic and atmospheric administration. http://www.noaa.gov. [16] Woods hole oceanographic institution. http://www.whoi.edu.