ISSN: 1693-6930
accredited by DGHE (DIKTI), Decree No: 51/Dikti/Kep/2010 1
Congestion Relief of Contingent Power Network with
Evolutionary Optimization Algorithm
Sandip Chanda1, Abhinandan De2
1Department of Electrical Engineering Techno India, Salt Lake, India 2
Department of Electrical Engineering BESU Shibpur , India e-mail: [email protected], [email protected]
Abstrak
Makalah ini menyajikan teknik optimasi evolusi diferensial sebagai sebuah metode untuk menyelesaikan masalah optimalisasi biaya manajemen kongesti dalam kontigensi jaringan. Dalam sistem yang terderegulasi, kongesti jalur transmisi selain merupakan penyebab masalah ketidakstabilan listrik juga dapat menambah biaya kelistrikan. Mempertahankan ketersediaan aliran daya pada tingkat kongesti tertentu adalah cukup penting jika ditinjau dari sudut pandang stabilitas sistem kelistrikan maupun ekonomi. Dengan menerapkan indeks kepekaan kongesti yang diusulkan dalam tulisan ini, algoritma yang dirancang dapat digunakan untuk memilih jalur yang terkongesti dalam jaringan listrik, kemudian digunakan untuk mencari batas batas kongesti yang selanjutnya digunakan menjadwalkan ulang pembangkitan dengan biaya minimum dalam suatu pembiayaan manajemen kongesti tanpa adanya pemutusan beban maupun penambahan pemasangan peralatan jaringan listrik yang fleksible (FACTS). Pada makalah ini terlihat bahwa metode yang diterapkan dapat memberikan kondisi pengoperasian listrik yang lebih baik dengan memperbaiki tegangan bus dan rugi rugi jaringan. Efisiensi dari metode yang diusulkan telah diujicobakan pada sistem IEEE 30 bus dengan hasil yang baik.
Kata kunci: evolisi differensial, indeks kepekaan kongesti, kontingensi jaringan listrik, optimasi, penjadwalan ulang.
Abstract
This paper presents a differential evolution optimization technique based methodology for congestion management cost optimization of contingent power networks. In Deregulated systems, line congestion apart from causing stability problems can increase the cost of electricity. Restraining line flow to a particular level of congestion is quite imperative from stability as well as economy point of view. Employing ‘Congestion Sensitivity Index’ proposed in this paper, the algorithm proposed can be adopted for selecting the congested lines in a power networks and then to search for a congestion constrained optimal generation schedule at the cost of a minimum ‘congestion management charge’ without any load curtailment and installation of FACTS devices. It has been depicted that the methodology on application can provide better operating conditions in terms of improvement of bus voltage and loss profile of the system. The efficiency of the proposed methodology has been tested on an IEEE 30 bus benchmark system and the results look promising.
Keywords: congestion sensitivity index, contingent power networks, optimization, diffrential evolution, rescheduling
1. Introduction
Security constrained optimal power flow (SCOPFs) have been proposed in [8] and [9] where rescheduling cost have been minimized without ascertaining maximum allowable line flow or level of congestion. Moreover, the penalty method applied has to trace and calculate penalties for all the lines, therefore time complexity of the algorithms may be high with respect to the domain of application. [10] And [11] proposed voltage stability constrained Optimal Power Flow (OPF) to alleiavate congestion, but the proposed generation schedule could not maintain a particular level of congestion during contingencies. Apart from rescheduling of generation, the line congestion can also be managed by employing FACTs devices and HVDC as cited in [12] - [13]. But the excess cost associated with these devices may prohibit their use in many existing systems. In [14]- [16] load curtailment based congestion management has been proposed, but the value of lost load (VOLL) may restrict its practical implementation Dynamic control of congestion as reported in [17] may be too expensive and also require precise monitoring.
In view of all these works, this paper presents an OPF solution, which attempts to reschedule the generators in such a way that the individual line flows are brought down to a desired level, not exceeding their loadability limits. The effectiveness of the proposed algorithm has been demonstrated on the modified IEEE 30 bus system under contingencies. The results indicate that the method proposed in this paper is efficient inlimiting line congestion without any load curtailment and installation of FACTS devices. The proposed method also provides better management of operating conditions of the system.
2. Theory
To establish the applicability of the proposed algorithm in the present power market scenario, two more conventional optimization methods namely Cost Optimization and Loss Optimization have been considered.
2.1. Problem Statement
Objective function for conventional cost optimization:
1
minimize F=
Ng
T n
C
=∑
$/Hr (1)2
T gi gi
C
=
AP
+
BP
+
C
(2)Where, N g =Number of generators;
A
,B
,C
= Cost Co-efficients of generators;P
gi= generationof
i
th generator in MWObjective function for loss Optimisation method:
Minimize
1
(
n
i j ij ij ij ij
j
F
V
V G Cos
θ
B Sin
θ
==
∑
+
(3)Where,
V
i- voltage magnitude of the busi
,V
j= voltage magnitude of the busj
,G
ij-Conductance of transmission line from bus
i
toj
;B
ij- Susceptance of transmission line frombus
i
toj
;n
- no of busesObjective function for the proposed penalty based congestion management cost optimization:
Minimize max
1 1
(
.
)
Ng Ng
T p l T
n n
F
C
C
P
C
= =
=
∑
+
∆
−
∑
(4)Here,
C
T=generation cost with congestion management;C
p=penalty for congestion limitThe constraints are common for all the above objective functions and are as follows: 1. Equality or power balance constraints:
1
(
)
0
n
Gi Di i j ij ij ij ij
j
P
P
V
V G Cos
θ
B Sin
θ
=−
−
∑
+
=
(5)1
(
sin
cos ) 0
n
Gi Di i i j ij ij ij ij
Q
Q
V
V G
θ
B
θ
=
− −
∑
−
=
(6)
Gi
P
- Active power injected in busi
;P
Di - Active power demand on busi
;Q
Gi- Reactivepower injected in bus
i
;Q
Di - Reactive power demand on busi
2. Inequality or generator output constraints:min max
Gi Gi Gi
P
≤
P
≤
P
(7)
min max
Gi Gi Gi
Q
≤
Q
≤
Q
(8)
min
Gi
P
,Q
Gimin - Lower limit of active and reactive power of generatori
respectively ;max
Gi
P
,max
Gi
Q
- upper limit of active and reactive power of the generators 3. Voltage constraint:min max
i i i
V
≤ ≤
V
V
(9)
min
i
V
,V
imax are lower and upper limit ofV
i 4. Transmission constraint:min max
ij ij ij
P
≤
P
≤
P
(10)
min
ij
P
,P
ijmaxare the minimum and maximum line flow limits ofP
ij2.2. The Congestion Sensitivity Index
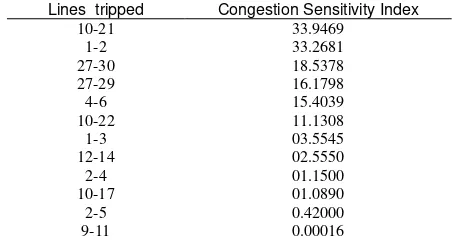
For the selection of proper congestion zone, a line flow sensitivity index has been proposed in this paper and the Congestion Sensitivity index has been formulated as below
Sensitivity index =
∆
p
i j− /∆
p
i (11)
(where
∆
p
i j− represents the difference in line flow in MW of the line between bus ‘i
’ and bus ‘j
’ before and after tripping another line connected to bus ‘i
’ and ∆pi represents the differencein power between total power injected to bus ‘
i
’ and the power flow in line ‘i
-j
’ after tripping another line connected to bus ‘i
’.) . The values of sensitivity indices are arranged in descending order for the most congested lines of IEEE 30 bus system as shown Table 1.2.3. Overview of Diffrential Evolution
As the Objective function with the constraints is highly nonlinear as described in section 2.1, it utilizes Differential evolution (DE) for its stochastic, nonderrivative based search method to obtain a global solution without premature convergence [18]. DE solves real valued problems based on the principles of natural evolution using a population
P
ofN
pfloating point-encodedindividuals that evolve over
G
generations to reach an optimal solution.1
[ G . . . G ] N p
P = Y Y (12)
(13)
1 2
[ , , . . . , ]
G G G G
i i i D i
where
Table 1. Ranking of lines in terms of congestion sensitivity indices
Lines tripped Congestion Sensitivity Index
10-21 33.9469
1-2 33.2681
27-30 18.5378
27-29 16.1798
4-6 15.4039
10-22 11.1308
1-3 03.5545
12-14 02.5550
2-4 01.1500
10-17 01.0890
2-5 0.42000
9-11 0.00016
2.3.1. Initialization
The first step in the DE optimization process is to create an initial population of candidate solutions by assigning random values to each decision parameter of each individual of the population. Such values must lie inside the feasible bounds of the decision variable and can be generated by Eq. (2).
(14)
where, i=1, 2,..,Np and j=1, 2,....,D
And, and are respectively, the lower and upper bound of the th
j decision
parameter and
n
j is a uniformly distributed random number within [0, 1] generated anew foreach value of
j
.2.3.2. Mutation
The mutation operator creates mutant vectors by perturbing a randomly selected vector
a
Y with the difference of two other randomly selected vectors Yb and c
Y
according Eq. (15).(15)
where, i=1, 2 , ..,N pwhere,
Y
a,
Y
b,
Y
c are randomly chosen vectors ∈{
1, 2 , . . . . ,Np}
anda ≠ ≠ ≠b c iis the scaling constant. For certain problems, it is considered
a
=
i
.2.3.3. Crossover
The crossover operator creates the trial vectors, which are used in the selection process. The crossover operation maintains diversity in the population, preventing local minima convergence. The crossover constant ( )
r
C must be in the range of [0, 1].
" '
, ,
G G
i j i j
X = X if '
j Cr
η ≤ or (16)
Otherwise (17)
where
and
j
=
1,2,....,
D
q is a randomly chosen index ∈
{
1, 2, ...D}
that guarantees that the trial vector gets at least oneparameter from the mutant vector. '
j
η is a uniformly distributed random number within [0, 1] generated a new for each value of
j
. Here G,i j
X is the parent (target) vector, ',
G i j
X is the mutant
vector and '' ,
G i j
X is the trial vector.
1, 2 , .... ... p
i = N
0 m i n m a x m i n
, η j ( )
i j j j j
Y = Y + Y − Y
m i n
j
Y Yjm a x
'
( )
G G G G
i a b c
Y = Y + S Y − Y
j= q
,
G i j
X =
1 , 2 , . . . . , P
2.3.4. Selection
The selection operator chooses the vectors that are going to compose the population in the next generation. This operator compares the fitness of the trial vector and fitness of the corresponding target vector, and selects the one that performs better as mentioned in Eq. (5).
1 " "
( ) ( )
G G G G
i i i i
Y + =Y ifƒ Y ≤ ƒ Y (18)
= G i
Y otherwise (19)
The selection process is repeated for each pair of target/ trail vector until the population for the next generation is complete.
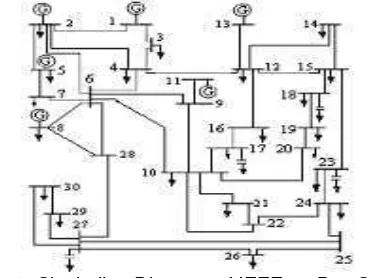
3. Simulation and Results
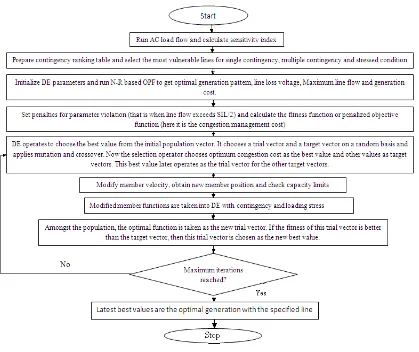
The feasibility and effectiveness of the proposed algorithm has been demonstrated in the modified IEEE 30 bus system shown in Figure 1 summerised description of the adopted system is given in Table 2 and 3a. The proposed optimization algorithm (formulated in equation number 4 has been adopted for the developed methodogy implementation in differential evolution environment (the parameter setting is given in Table 3b). The flow chart of the developed methodology has been depicted in Figure 2.
Table 2. Description of IEEE 30 bus system
Variables Adopted system
Branches 41
Generators 6
Total Demand(MW) 283.6
Figure 1. Single line Diagram of IEEE 30 Bus System
Table 3a. Cost co-efficients of generators
Bus no
Real Power output limit in MW Cost Co-efficient
Max Min A
(US$/MW2
)
B (US$/MW)
C (US$)
1 50 200 0.00375 2.00 5000 2 20 80 0.01750 1.75 1000 5 15 50 0.06250 1.00 600 8 10 35 0.00834 3.25 300 11 10 30 0.02500 3.00 350 13 12 40 0.02500 3.00 400
Table 3b. Parameter setting of differential evolution
Optimisation Parameter Adopted setting
Value to Reach (VTR) 10-6
Number Of Population (NP) 20
Maximum Number Of Iterations (Itermax) 500
DE Stepsize, Crossover Probability Constant 0.8
3.1. Determination of line flow limit
Figure 2. Flow chart of the proposed methodology
Though the proposed algorithm is capable of limiting the line flow at any arbitrary value, in the present work, the line flow limitr has been assumed to be 50% of the SIL. Table 4, 5 and 6 presents the contribution of generators with the two conventional and the proposed congestion management cost optimization technique during contingency. The contingent state have however been selected from the contingency ranking Table 4.
Table 4. Contribution of generators during contingency with conventional cost optimisation
Lines tripped Contribution of the generators
P1(MW/hr) P2(MW/hr) P3(MW/hr) P4(MW/hr) P5(MW/hr P6(MW/hr
10-21 16.61 28.30 98.51 37.89 68.69 35.71
1-2 7.06 37.16 98.38 36.35 72.09 34.08
27-30 16.62 28.24 98.47 37.34 71.24 33.89
10-21 and 1-2 7.15 37.46 98.49 37.55 69.21 35.64
4-6 and 27-30 15.56 26.44 99.30 38.82 67.91 37.66
4-6 and 10-22 15.46 26.28 99.25 38.46 67.47 38.39
Table 5. Contribution of generators during contingency with conventional power loss optimisation method
Lines tripped Contribution of the generators
P1(MW/hr) P2(MW/hr) P3(MW/hr) P4(MW/hr) P5(MW/hr P6(MW/hr
Table 6. Individual contribution of generators during contingency with proposed method
Lines tripped Contribution of the generators
P1(MW/hr) P2(MW/hr) P3(MW/hr) P4(MW/hr) P5(MW/hr P6(MW/hr
10-21 112.59 68.27 26.01 44.82 19.88 18.06 1-2 71.71 74.07 28.06 63.34 26.23 25.90 27-30 112.65 68.53 26.00 44.52 19.96 18.11 10-21 and 1-2 71.72 73.54 28.39 64.21 26.22 25.59 4-6 and 27-30 101.94 68.12 26.08 54.80 21.96 16.76 4-6 and 10-22 101.61 67.08 26.48 54.87 20.76 18.41
Figure 3. Generation cost maximum line flow with conventional and proposed method
Figure 4. Bus voltage profile and congestion management cost
3.2. Operational Issues
Apart from congestion management, for the effective implementation of the proposed algorithm, some operational issues are needed to be considered.
3.2.1. Reduction in total generation cost and line congestion with the proposed algorithm The proposed algorithm aims to minimize congestion management cost hence the total generation cost may get higher than the conventional cost optimization technique. But the most promising part of this algorithm is that it can offer lower generation cost with respect to loss optimization technique as shown in Figure 3. In addition, as shown in the same figure the algorithm is capable of limiting line congestion. It can be noted that the loss optimization method offers lesser line flow or congestion but considering the total generation cost the proposed method must be preferred ahead of this method for congestion management.
comparison between loss optimization technique and the proposed algorithm in respect of congestion management charge.
4. Conclusion
A DE based methodology has been proposed in this paper for congestion management in a contingent state of the system at an optimum cost of management but without any load curtailment or FACTS device installation. In the proposed method, on violation of a specified line flow, an additional penalty has been added to the objective function to direct the DE based search process to the most feasible optimal solution considering the constraints. Bus voltage profile has improved with respect to the conventional and loss optimization algorithms. The proposed method has been demonstrated to cause a reduction in congestion management cost which may appear as social welfare in deregulated power networks. The IEEE30 bus system is analyzed to establish the technique. The results show that the proposed algorithm develops a cost effective congestion management technique in a restructured contingent power system which can be used effectively used by ISO.
References
[1] K Selvi, T Meena, N Ramaraj. A generation Rescheduling Method to Alleviate Line Overloads using
PSO. IE (I) Journal-EL. 2005.
[2] Yu Xiaodan, Jia Hongjie, Zhao Jing, Wei Wei, Li Yan , Zeng Yuan. Interface Control Based on Power Flow Tracing and Generator Re-redispatching. Automation of Electric Power Systems IEEE, 2008. [3] G Baskar, MR Mohan. Contingency constrained economic load dispatch using improved particle
swarm optimization for security enhancement. Electric Power System Research Elsevier. 2008.
[4] E Muneender, MD Vinod Kumar. Optimal Rescheduling of real and reactive powers of generators for
zonal Congestion Management Based on FDR PSO. IEEE T&D Asia. 2009.
[5] Sujatha Balaraman, K Kamaraj. Congestion management in Deregulated power system using real coded genetic algorithm. International Journal of Engineering Science and Technology. 2010; 2(11): 6681-6690.
[6] Sujatha Balaraman, K Kamaraj. Application of Diffrential Evolution for Congestion management in power system. Modern Applied Science. 2010; 4(8).
[7] Zhao Jinli, Jia Hongjie, Yu Xiaodan. Voltage Stability Control Based on real power flow tracing.
Proceedings of CSEE, IEEE. 2009.
[8] Xiaosong Zou, Xianjue Luo, Zhiwei Peng. Congestion Management Ensuing Voltage Stability under
Multicontingency with preventive and Corrective Controls. IEEE. 2009.
[9] Hwa-Sik Choi, Seung II Moon. A new Operation of series compensating device under Line Flow Congestion using the Linear zed Line Flow sensitivity. Power Engineering Society winter meeting IEEE. 2001.
[10] EM Yap, M Al-Dabbagh, PC Thum. UPFC Controller in Mitigating Line Congestion for Cost-Efficient Power Delivery. Power Engineering Conference IPEC, IEEE. 2006.
[11] Xiao-Ping Zhang, Liangzhong Yao. A Vision of Electricity network Congestion Management with FACTS and HVDC. DRPT2008. Nanjing China. 2008.
[12] Garng M Huang, Nirmal Kumar, C Nair. An OPF based Algorithm to Evaluate Load Curtailment Incorporating Voltage Stability Margin Criteria.Power Engineering Society Winter Meeting, IEEE. 2002.
[13] Fei HE, Yihong WANG, Ka Wing CHAN, Yutong ZHANG, Shengwei MEI. Optimal Load Shedding Stategy Based on Particle Swarm Optimisation. 8th international conference on Advances in Power System Control operation and Management (APSCOM). 2009.
[14] RN Nayak, YK Sehgal, Subir Sen. EHV Transmission Line Capacity Enhancement through Increase
in Surge Impedance Loading Level. Power India Conference. 2006.
[15] KP Basu. Power transfer Capability of Transmission Line Limited by voltage Stability: Simple Analytical Expressions. IEEE Power Engineering Review. 2000
[16] J Ma, YH Song, Q Lu, S Mei. Framework for dynamic congestion Management in open power markets. IEE Proc.Gener.Transm. Distrib. 2002; 149(2).