AN ANALYSIS AND DESIGN OF RESPONSIVE
AGROINDUSTRIAL SUPPLY CHAIN FOR MULTI
PRODUCTS OF TROPICAL FRUIT
ROHMAH LUTHFIYANTI
GRADUATE SCHOOL
BOGOR AGRICULTURAL UNIVERSITY BOGOR
DECLARATION OF ORIGINALITY
AND COPYRIGHT TRANSFER
I hereby declare that thesis entitle An Analysis and Design of Responsive Agroindustrial Supply Chain for Multi Products of Tropical Fruit is my own work under supervision of Dr Eng Ir Taufik Djatna, MSi and Dr Ir Akmadi Abbas, MEngSc. It has never previously been published in any university. All of incorporated originated references from other published as well as unpublished papers are stated clearly in the text as well as in the references list.
Hereby, I delegate that the copyright to this paper is transferred to Bogor Agriculture University.
Bogor, December 2016
Rohmah Luthfiyanti
SUMMARY
ROHMAH LUTHFIYANTI. An Analysis and Design of Responsive Agroindustrial Supply Chain for Multi Products of Tropical Fruit. Supervised by TAUFIK DJATNA and AKMADI ABBAS.
Allocation of resources at a high complexity level, such as the allocation of raw materials, the fulfillment of processing requirements, the rules, and distribution control, waste management, a responsive supply chain system is needed to multi products operation model. Moreover, competitive business environment with short turnover period, minimum cost and lead time and risk for decline quality are current challenges in designing and improving the responsive agroindustrial supply chain for multi products of tropical fruit. Nowadays, Small and Medium Enterprises (SMEs) need tight requirements to increase the diffuse and adopt of information and communication technology (ICT), so that there is a digital gap between large enterprises and Small and Medium Enterprises especially at distance (geographic dimension). Digital business ecosystem (DBE) is centralized collaboration environment of the species as stakeholder communities within the business ecosystem.
The objectives of this research are (1) to identify the component and process in systems analysis, (2) to develop the design responsive agroindustrial supply chain multi products of tropical fruit for SME, (3) to verify and validate the model. The method used to answer the first objective is decomposition the process with business process model notation (BPMN). The method to design the supply chain responsive for multi products of tropical fruit is a classification of tropical fruit multi product with decision tree method, responsive supply chain model with quantitative model to count the cost, flexibility and level of responsive performance. The third model is to supplier selection with intuitionistic fuzzy hedges method. Verification and validation to models are conducted through the model’s result.
The result of identification and analysis system of supply chain responsive for tropical fruit multi product based on DBE is the first layer in the interaction of suppliers community (vendor procurement), SMEs community (business and processing unit), distribution center and cross docks community (vendor inventory finish goods);the second layer is the digital device infrastructure of the first layer. The result from quantitative model of responsive supply chain for multi products of tropical fruit may be found that it is in low responsiveness level. There are two scenarios to increase the responsiveness level of responsive supply chain for multi-product of tropical fruit to increase to a medium level and to a high level by increasing the capacity of distribution center and cross dock. The supplier selection based on intuitions of decision maker are considered flexible and adaptive). There are top three alternative chosen suppliers; S12, S5 and S8. The verification and validation models have been conducted through the supplier selection model, which resulted in an accuracy of 80 %. It means that it is a very good accuracy that is likely be implemented.
RINGKASAN
ROHMAH LUTHFIYANTI. Analisis dan Desain Rantai Pasok Agroindustri Responsif Multi Produk Buah Tropika. Dibimbing oleh TAUFIK DJATNA dan AKMADI ABBAS.
Alokasi sumberdaya pada tingkat kompleksitas yang tinggi, seperti alokasi bahan baku, pemenuhan syarat pengolahan, aturan dan kontrol distribusi, hingga penanganan limbah, sebuah sistem rantai pasok yang responsif diperlukan untuk permodelan operasi multi produk. Lingkungan bisnis yang kompetitif dengan perputaran produk yang singkat, biaya dan lead time yang minimum serta
penurunan kualitas menjadi tantangan terkini dalam mendesain serta memperbarui pasokan yang responsif. Usaha Kecil dan Menengah (UKM) pada saat ini membutuhkan syarat yang ketat untuk meningkatkan difusi dan adaptasi teknologi informasi dan komunikasi sehingga terjadi kesenjangan yang besar antara usaha skala besar dan UKM khususnya kesenjangan jarak (dimensi geografis). Digital business ecosystem (DBE) merupakan pemusatan kolaborasi lingkungan spesies
sebagai komunitas pemangku kepentingan di dalam ekosistem bisnis. Penelitian ini mendeskripsikan model rantai pasok responsif melalui analisis dan desain untuk memenuhi kebutuhan pemangku kepentingan akan informasi dan keputusan, dan juga terlibat dalam manajemen produk serta bahan baku yang mudah rusak.
Penelitian ini bertujuan untuk (1) mengidentifikasi dan menganalisis komponen dan proses berbasis DBE, (2) mendesain rantai pasok responsif multi produk buah tropika untuk UKM, serta (3) memverifikasi dan memvalidasi model yang dihasilkan. Metode yang digunakan untuk menjawab tujuan pertama adalah mendekomposisi proses dengan Business Process Model Notation (BPMN).
Metode mendesain rantai pasok multi produk buah tropika adalah klasifikasi multi produk buah tropika dengan metode Decision Tree, model rantai pasok responsif
dengan model kuantitatif untuk menghitung biaya, fleksibilitas dan level keresponsifan dari rantai pasok multi produk buah tropika. Model yang ketiga adalah model pemilihan supplier dengan menggunakan metode intuitionistic fuzzy hedges. Verifikasi dan validasi model dilakukan terhadap model yang dihasilkan.
Hasil identifikasi dan analisis sistem rantai pasok responsif multi produk buah tropika berbasis DBE adalah lapisan pertama adalah interaksi dari proses bisnis dari komunitas penyedia bahan baku (vendor procurement), komunitas
UKM (bussines and processing unit) dan komunitas distribution center dan cross dock (vendor inventory finish goods); lapisan kedua adalah infrastruktur digital
device dari lapisan pertama. Model kuantitatif rantai pasok responsif multi produk buah tropika diperoleh bahwa level keresponsifan dari rantai pasok multi produk buah tropika berada dalam kondisi low responsive. Skenario untuk
meningkatkan keresponsifan rantai pasok multi produk buah tropika ada dua yaitu meningkatkan ke tingkat sedang (medium responsive) dan ke tingkat tinggi (high responsive) dengan meningkatkan kapasitas distribution center dan kapasitas cross dock. Pemilihan pemasok bahan baku (suplier) berbasis intuisi dari
sebesar 80 % yang artinya bahwa model sangat baik akurasinya dan besar kemungkinan untuk bisa diimplementasikan.
© Copyright 2016 by IPB
All Rights Reserved
No part or all of this thesis may be excerpted without or mentioning the sources. Excerption only for research and education use, writing for scientific papers,
reporting, critical writing or reviewing of a problem. Excerption doesn’t inflict a
financial loss in the paper interest of IPB
Thesis
as partial fulfillment of the requirements for the degree of Magister of Science in the Agroindustrial Technology Study Program
AN ANALYSIS AND DESIGN OF RESPONSIVE
AGROINDUSTRIAL SUPPLY CHAIN FOR MULTI
PRODUCTS OF TROPICAL FRUIT
GRADUATE SCHOOL
BOGOR AGRICULTURAL UNIVERSITY BOGOR
2016
PREFACE
Praise to Allah Subhanahu Wa Ta’ala the Almighty for every blessing for me to pursue my study and finish my thesis with a title of “An Analysis and Design of Responsive Agroindustrial Supply Chain for Multi Products of Tropical Fruit” in Graduate School of Bogor Agricultural University.
Firstly, I would like to express my sincere appreciation to Dr Eng Ir Taufik Djatna, MSi and Dr Ir Akmadi Abbas, MEngSc, as my supervisors for their supports and encouragements during my study in Bogor Agricultural University. I am also indebted to Dr rer nat Ditdit Nugeraha Utama, as non-committee examiner for his constructive comments on this thesis which I believe greatly contributed to the improvement of this work.
I would like to thank Dr Ir Yoyon Ahmudiarto, MSc IPM, as the head of Center for Appropriate Technology Development, Indonesian Institute of Sciences Subang. I also thank all of the lecturers, colleagues, Fitri Widiyanti, Aisyah Rini, Wenny DK, Seppa Septarianis, Dian Novitasari, Hartami Dewi, Hadi, Asrol, Septian and especially TIP 2014 colleagues, at the Agroindustrial Technology Study Program for their cooperation and share, their valuable ideas and insights during my study in IPB. It has been a great pleasure to work with all of you.
Last but not the least, I want to express my deepest appreciation to my parents Maderi bin Tjik Olah (Alm) and Eti Supiyati binti Mustofa Rohim (Alm), my husband, brothers and sisters who have always prayed for me and give me moral support to complete my studies.
I wish this work will be beneficial to readers and contribute to the development of the knowledge related to the topic.
Bogor, December 2016
TABLE OF CONTENTS
LIST OF TABLES vi
LIST OF FIGURES vi
LIST OF APPENDICES vii
1 INTRODUCTION
Background 1
Objectives 2
Benefits 2
Boundaries 2
2 LITERATURE REVIEW
System Analysis and Design 3
Digital Business Ecosystem 4
Multi Products of Tropical Fruit 5
Responsive Supply Chain 6
3 METHODOLOGY
Research Period and Location 8
Data and Information Acquisition 8
Assumption 9
Research Framework 9
4 RESULTS AND DISCUSSIONS
System Identification 23
Business Process Analysis 24
Classification of Multi Products 25
Modeling Responsive Supply Chain 27
Intuitionistic Fuzzy Hedges for Supplier Selection 32
Verification and Validation 36
Advantage and Disadvantage 37
5 CONCLUSIONS AND RECOMENDATIONS
Conclusions 37
Recommendations 37
REFERENCES 38
APPENDICES 41
GLOSSARY 77
LIST OF TABLES
1 Parameters list and its description for model responsive supply chain 17 2 Parameters list and its description for intuitionistic fuzzy 22
3 Patterns of multi products 26
4 The raw material purchase cost and transportation cost from supplier to
plants 28
5 Total cost and flexibility 29
6 Strategy for improving to medium responsiveness level 29 7 Strategy for improving to high responsiveness level 29 8 Comparative performance of delivery network designs 31 9 Performance of delivery networks for different product customer
characteristics 31
10 Non fuzzy data input 32
11 Rule obtained from the combination of variables and membership
function 33
12 Intuitionistic fuzzy score for supplier 2 33
13 Intuitionistic fuzzy hedges for supplier 2 34
14 E(Mi) and H(Mi) value for supplier 2 34
15 Fuzzy aggregation for supplier 2 35
16 Fuzzy aggregation output and the decision 35
17 Rule for the interestingness measures in supplier 36
18 Fuzzy entropy aggregation result 36
LIST OF FIGURES
1 Basic system entity construct 3
2 Verification and validation concept overview 4
3 Framework of responsive supply chain 7
4 The research framework 10
5 Analytical system entity construct 11
6 Use case diagram 12
7 Membership function for distance variable 19
8 Membership function for capacity variable 19
9 Membership function for transportation cost variable 20 10 Membership function for raw material price variable 20
11 Membership function for lead time variable 20
12 Membership function for demand variable 20
13 Detail of system entity construction 24
14 Fragments of business analysis diagram in responsive supply chain of
multi product 25
15 Result decision tree structure 26
16 The existing structure of mangosteen supply chain in Tasikmalaya 27 17 Design structure of responsive supply chain for multi products of
tropical fruits 28
LIST OF APPENDICES
1 Product diversification of mangosteen (Pohon Industri) 43
2 The research workflow 44
3 Flowchart of supplier selection steps 45
4 Comparative performance of delivery network designs 47 5 Performance of delivery networks for different product customer
characteristics 48
6 Requirement analysis 49
7 Use case 54
8 Fragment process hierarchy diagram (PHD) 55
9 Fragment business process diagram (BPD) 56
10 Fragment business process model notation (BPMN) 57 11 The fix and variable cost associated with plant operation 60 12 The variable cost of handling and inventory of products at distribution
centers (DCs) and transportation of products from plant to DCs 61 13 The transportation cost to ship multi products from DCs to cross docks
and distribution costs to ship multi product from cross-docks to
customer zone 64
14 Flexibility of the supplier’s capacity 66
1
INTRODUCTION
Background
Nowadays, business competition aims for the responsiveness to information of each stakeholder in the networking, especially in the supply chain. Responsiveness to change holds the key to the existence of the company. In Indonesia, small and medium enterprises (SMEs) are the frontline to overcome the economic crisis. Meanwhile, Conchione (2009) explained that SMEs are generally have yet to utilize the information technology in responding the information needs of the stakeholder involved in the supply chain.
SMEs in Indonesia typically produce a wide range of product like juices, jam, dodol, syrup and chips from tropical fruits. Multi-product is the product
diversification from the same raw material, which in this case was mangosteen as the raw material and the product of juice, functional drink and dodol. The success
of SMEs in producing multi-product depends on the reliability and the agility in raw material provision; latency in raw material procurement leads to discontinuation of production and unfulfilled order. A multi-product supply chain design for tropical fruits has been an interesting topic to answer the call for responsive supply chain to the demand. The supply chain design initiated by the identification of the criteria of responsiveness in supply chain as well as the identification of the stakeholder involved in the business environment of the SME. The design and analysis of supply chain is essential for the stakeholder to identify the key aspect in the business environment of Indonesian tropical-fruits-based multi-product. The system design provides the information for stakeholder to gain information of the material flow and condition as well as to help in decision-making. Digital Business Ecosystem (DBE) is one approach in system design, is a digital technology consisting digital ecosystem to facilitate business activities (Nachira et al. 2007). Digital ecosystem provides business ecosystem
activity to achieve the objectives of searching and finding information. The first layer of DBE explains the digital business, which comprises the interaction of involved stakeholders having the same objective. The second layer is the digital operation of the first layer. Utilizing the digital information gives the advantage of time efficacy and cost efficiency in responding the demand.
As identified, the issue in Indonesian tropical-fruits-based multi-product is the information flow between the stakeholders. Furthermore, the material flow itself comes to be crucial as the perishable property of agricultural material. Deteriorated material leads to low-quality end-product. Thus, a responsive supply chain management was proposed as the solution for SMEs to manage its business.
Tiwari et al. (2013) explained that a responsive supply chain performs faster
sales and more cost-efficient production. You and Grossmann (2008) discussed that designing a responsive supply chain in the circumstance where demand uncertainty occurs, with the responsive criteria of transportation time, scheduling of the factory, lead time and stock management, significantly influenced the NPV and supply chain structure. Vidyarthi et al. (2009) designed a system of MTO
2
product lifecycle. Fresh fruit supply chain is a more complex compared to other supply chain as it has a character of perishable, low shelf life, and fluctuating demand and price. Fresh fruit supply is a process flow from the harvesting to shipping/distribution, from the farmer to customer, in this case is the Small Medium Enterprises in food industry (Shukla and Jharkharia 2013). Small Medium Enterprises (SMEs) in their business produce multi-product from one kind of raw material, which is a relevant key aspect in the study of responsive supply chain.
Wasson (2016) represented a system in a form of entity consisting the requirements that have to be analyzed before designing a responsive supply chain, thus requirement analysis is essential to facilitate the comprehension of the supply chain. Next step is to integrate the responsive supply chain system design to ensure that the system is applicable in real business environment. The integration is intended to satisfy the actual needs of the stakeholder involved in the supply chain system.
Objectives
As the motivation and challenges, this research aims to:
1. Analyze the requirement in the responsive agroindustrial supply chain system for multi products of tropical fruit.
2. Design the responsive agroindustrial supply chain system for multi products of tropical fruit in the scale of small and medium enterprises.
3. Verify and validate the model of responsive agroindustrial supply chain for multi products of tropical fruit.
Benefits
This research is expectantly contributing to the following output:
1. Contributing to the knowledge on the responsive supply chain analysis and design of tropical fruits multi product.
2. Providing insights and recommendations on the analysis, design and validation of the responsive supply chain system.
3. Providing knowledge and tools to support the decision making of the stakeholder in the supply chain management.
Boundaries
The subject of this research was multi products of tropical fruit, particularly mangosteen and its derivatives products such as mangosteen juice, dodol and functional drinks, with the focus on the responsive supply chain of mangosteen products in the scale of small medium enterprises (SMEs). Business process analysis of the mangosteen multi product responsive supply chain used the framework of Digital Business Ecosystem (DBE). This work was conducted to the subject in the Regency of Tasikmalaya, West Java.
3
2
LITERATURE REVIEW
System Analysis and Design
System is an integrated set of interoperable elements, each with clearly specified and bounded proficiency, operating synergistically to perform value-added processing to enable a user to meet the mission-oriented operational needs in a determined operating environment with a specified result and success probability (Wasson 2016).
System Engineering (SE) is the multidisciplinary application of analytical, mathematical and scientific principles to formulating, selecting, and developing a solution that has acceptable risk, meets user operational need(s), and minimizes development and life cycle costs while considering stakeholder interests. The depiction of a system entity construction is illustrated in Figure 1. Basically, the construction consists of inputs which are fed into a system that processes the inputs and results the output. In the composition, the function of the system has to be clearly identified and the added value it creates (Wasson 2016).
Figure 1 Basic system entity construct (Wasson 2016)
The systematic approach take to the analysis and design of information systems is embodied in what is called the systems development life cycle (SDLC). The SDLC is a phased approach to analysis and design that holds that systems are best developed through the use of a specific cycle of analyst and user activities. There are several opinions about the stages contained in SDLC. (Kendall and Kendall 2011).
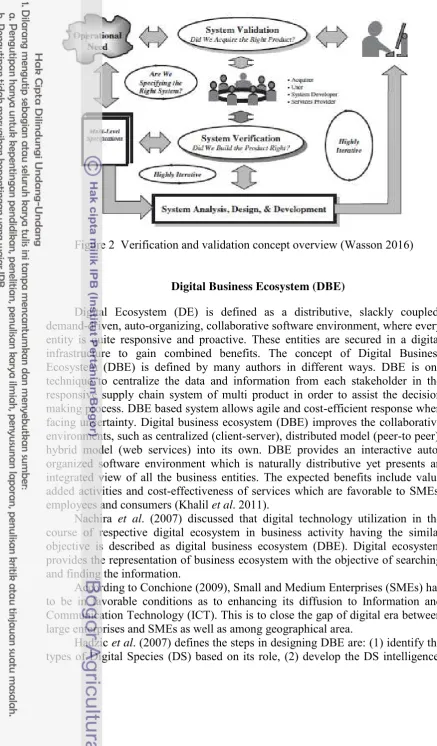
Requirement analysis on SDLC perform by using several tools method. BPMN is graphical notation to depict the sequence of process in business activities that collaborating and interacting to achieve a goal. Business process modeling constructed to aid a communication with work colleagues inside the organization, helping them form a shared understanding. Besides, BPMN also used to drive the way in which work happens in the modern organization and carry the instructions for how work should happen, who should do it, escalation conditions if it is not systems. done in time, links to other systems etc. (Ginantaka 2015). The concepts of system validation and system verification as shown in Figure 2 provides an illustration of system verification and system validation that helps in better understanding these concepts (Wasson 2016).
System Entity
Processing Output Reponse(s)
Products By-products Services
Input(s)
4
Figure 2 Verification and validation concept overview (Wasson 2016)
Digital Business Ecosystem (DBE)
Digital Ecosystem (DE) is defined as a distributive, slackly coupled, demand-driven, auto-organizing, collaborative software environment, where every entity is quite responsive and proactive. These entities are secured in a digital infrastructure to gain combined benefits. The concept of Digital Business Ecosystem (DBE) is defined by many authors in different ways. DBE is one technique to centralize the data and information from each stakeholder in the responsive supply chain system of multi product in order to assist the decision making process. DBE based system allows agile and cost-efficient response when facing uncertainty. Digital business ecosystem (DBE) improves the collaborative environments, such as centralized (client-server), distributed model (peer-to peer), hybrid model (web services) into its own. DBE provides an interactive auto-organized software environment which is naturally distributive yet presents an integrated view of all the business entities. The expected benefits include value added activities and cost-effectiveness of services which are favorable to SMEs, employees and consumers (Khalil et al. 2011).
Nachira et al. (2007) discussed that digital technology utilization in the
course of respective digital ecosystem in business activity having the similar objective is described as digital business ecosystem (DBE). Digital ecosystem provides the representation of business ecosystem with the objective of searching and finding the information.
According to Conchione (2009), Small and Medium Enterprises (SMEs) has to be in favorable conditions as to enhancing its diffusion to Information and Communication Technology (ICT). This is to close the gap of digital era between large enterprises and SMEs as well as among geographical area.
Hadzic et al. (2007) defines the steps in designing DBE are: (1) identify the
5 (3) determine cooperating system between each DS, (4) build the DS, (5) deploy the security system to protect the digital ecosystem.
Multi Products of Tropical Fruits
The industrialization of Indonesia fruits is aimed to fulfill national demand and export demand as to face the free trade era. There is a great potency to improve the availability and the quality of tropical fruit is improved gradually (LPPM IPB 2009). Balitbang Kementan in their work during 5 years from 2009 has been successful to release 58 varieties of superior tropical fruits of Indonesia as well as the technology to cultivate the crops. Those varieties include banana (4 varieties), mangosteen (2 varieties), mango (11varieties), avocado (3 varieties), papaya (1 variety), melon (4 varieties), salak (2 varieties) and 31 varieties of banana, melon, salak and pineapple (Kabar bisnis 2014). The latest 5 varieties of mangosteen, which have been launched as a result of the cooperation between local government and Pusat Kajian Buah Tropika IPB (PKBT–IPB), are Wanayasa, Puspahiyang, Malinau, Marel, Raya (LPM IPB 2009) and one from Balitbang Pertanian (2015) is Ratu Kamang variety.
Mangosteen is an exotic commodity of Indonesia as a “queen of tropical fruit” to be exported since it has a unique taste and color compared to other commodities. Its skin can also be utilized as herbs, food ingredients, supplement, cosmetics, preservatives and natural color, aside being a favorite fruits of both domestic and foreign consumers.
The production of mangosteen in Indonesia in 2014 was up to 114,755 tons from the plantation with a total area of 15,197 ha (Statistika pertanian 2015). As much as 7,411 tons from the production was exported, meaning only about 6.57% was qualified as exported grade, while the rest was for national consumption (LPPM IPB 2009). One of the largest producer of mangosteen in West Java is Tasikmalaya, with an area of 3,384 ha of mangosteen crops, producing as much as 37,523 tons of mangosteen in 2015 (Distan Kab Tasikmalaya 2016). According to LPPM IPB (2009), the superior variety of mangosteen that had been released in Tasikmalaya was Pupahiyang, with a registration number of Kepmentan No 301/Kpts/SR 120/5/2007.
The mangosteen in the supply chain of Tasikmalaya is marketed as raw material for both domestic and export use. The excess products which are not taken over the market can be utilized by the Small and Medium Enterprises (SMEs) of food and beverages processing. Some products from these SMEs are dodol, functional drinks, syrup, juice, puree, instant mangosteen skin powder, etc. The detailed product diversification of mangosteen can be seen in Appendix 1.
Mangosteen juice is a healthy beverage containing vitamins, mineral and xanthine (3.55 mg/100ml). Mangosteen juice is packed in a plastic bottle can sustain for 3 months in the temperature around 4-8 oC, unexposed to direct
6
mg). The shelf life of xanthone in a dark-glass bottle, being kept in low temperature and unexposed to sunlight, is up to 10 months. Some SMEs produce xanthone due to its simple processing steps. Another mangosteen-based product is instant mangosteen skin powder, made by spray drying process. Mangosteen skin is soluble in water, has a soft texture and contains the antioxidant of anthocyanin (minimal of 1.13mg/g), total phenol (8.49 mg/g), antioxidant capacity of 428.72 mg/g AEAC (Ascorbic acid equivalent antioxidant capacity) and xanthone (alpha mangosteen 0.59 mg/g) (Balitbang Pertanian 2015). This research focused on the mangosteen multi product of juice, dodol and functional drink.
Responsive Supply Chain
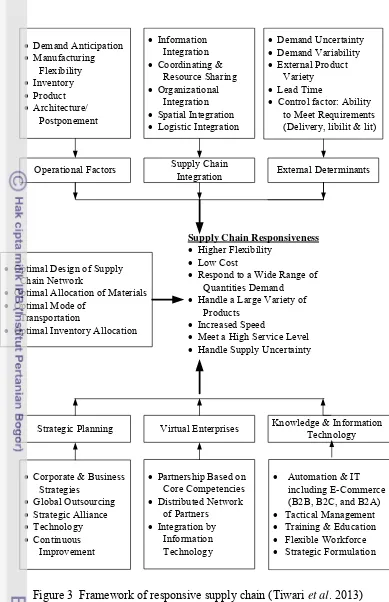
A responsive supply chain is the ability to respond quickly to a multiple demand while minimizing the lead-time, managing multi-product, creating innovative product and serving with high quality (Chopra and Meindl 2013). Tiwari et al. (2013) described the characteristic of responsive supply chain as (1) high flexibility, (2) low cost, (3) responding to multiple demand, (4) managing multi-product, (5) increasing agility or quick-responding, (6) high service level, and (7) managing uncertainty. You and Grossmann (2008) also argued that the criteria of being responsive are transportation time, residence time, scheduling and stock management.
Company aims to distribute its product cost-efficiently when managing a more responsive supply chain. Several alternatives it can endeavor are: (1) reducing production time via slot splitting or decreasing setup time, (2) investing in either finished products or raw materials safety stocks to buffer disruptions coming from the downstream or upstream, respectively, (3) opening retail outlets near the customer’s market, (4) shipping via faster transportation modes and (5) dealing with firms resorting to highly reliable suppliers (Tiwari et al. 2013).
The challenge in today’s foodstuffs supply chain management is the high complexity of global networking, which creates pathways from farm to consumers, involving production, processing, and distribution, to waste management (Nagurney et al. 2013). This calls for a more comprehensive study in the
foodstuffs supply chain modeling, analysis and solutions.
The methodological framework for perishable stuff supply chain has to be able to manage different behavioral concept including optimization and competitive equilibrium, as well as be sufficiently representing different supply chain structures that are relevant to the case of perishable products. (Nagurney et al. 2013). The methodological framework and integrated architecture can be
7
Demand Anticipation
Manufacturing Flexibility
Inventory
Product
Architecture/ Postponement
Information Integration
Coordinating & Resource Sharing
Organizational Integration
Spatial Integration
Logistic Integration
Demand Uncertainty
Demand Variability
External Product Variety
Lead Time
Control factor: Ability to Meet Requirements (Delivery, libilit & lit)
Operational Factors Supply Chain Integration External Determinants
Optimal Design of Supply Chain Network
Optimal Allocation of Materials
Optimal Mode of Transportation
Optimal Inventory Allocation
Supply Chain Responsiveness Higher Flexibility
Low Cost
Respond to a Wide Range of Quantities Demand
Handle a Large Variety of Products
Increased Speed
Meet a High Service Level
Handle Supply Uncertainty
Corporate & Business Strategies
Global Outsourcing
Strategic Alliance
Technology
Continuous Improvement
Partnership Based on Core Competencies
Distributed Network of Partners
Integration by Information Technology
Automation & IT including E-Commerce (B2B, B2C, and B2A)
Tactical Management
Training & Education
Flexible Workforce
Strategic Formulation Strategic Planning Virtual Enterprises Knowledge & InformationTechnology
Figure 3 Framework of responsive supply chain (Tiwari et al. 2013)
8
was also proposed based on the decoupling of different decision-making levels in the problem.
Vidyarthi and Jewkes (2009) developed a model design of MTO (make to order) and ATO (assemble to order) with the consideration of customer demand and distribution time. Cutting plane algorithm and Lagrangian heuristic algorithm was employed in their work. The business strategy aimed to solve responsive supply chain issue of varying products, high demand and short product lifecycle.
Leung et al. (2003) developed a responsive replenishment system with the
consideration of respond agility to the fluctuating demand and punctuality with minimum cost. Fuzzy Logic was employed to solve the demand uncertainty and improve the responsiveness in stock replenishment.
Wang and Ingham (2008) studied the dynamic simulation method to improve and optimize performance of the supply chain. In their research, the simulation was developed to examine the relationship between the stakeholders of the supply chain so that the company is able to survive in the competitive environment.
Chen and Song (2014) assessed and designed the ability to quickly respond in the mechanism of supply chain coordination by using TOPSIS method and Hesitant Fuzzy, where they revealed that it could result more efficient and responsive system quickly to solve the problem.
Buzzone et al. (2014) developed the simulation model of supply chain for
fresh food safety and security in the distribution process using DES (Discrete Event Simulator) technique. The model was able to prevent the contamination while minimizing the transportation cost, inventory cost and sales loss. Seo et al.
(2012) used a mathematical model to plan the supply chain in a business environment and integrate the planning of raw material procurement, production and distribution. The mathematical model is capable of analyzing a high complexity issue.
3
METHODOLOGY
Research Period and Location
This research was conducted from January 2016 to June 2016 in the computer laboratory of the Department of Technology of Agroindustry. Primary data was obtained by proposed judgment sampling in Tasikmalaya district region.
Data and Information Acquisition
9 Assumption
The assumption in the fuzzy intuitionistic model was that we used non-expert respondents and their intuition as the input. In responsive supply chain, the assumptions, which were the distance of supplier to plants (SMEs), the capacity of supplier, SMEs (business and processing unit), distribution center and cross docks, transportation cost, raw material price, lead time and demand/order quantity, were based on the real-time condition on the field.
Several assumption subjected to the estimation in the modeling of fuzzy intuitionistic and responsive supply chain were: (1) the subject commodity of mangosteen and its diversification product of juice, functional drinks and dodol existed, (2) data availability according to observation (raw material price per kilogram, cost and supplier’s capacity) were unchanging during the working of this research, (3) current distance was according to the initial observation (the distance from supplier to the factory), (4) the raw material and the SMEs was according to the current observation, and (5) the data used were primary data, secondary data and simulation result data.
Research Framework
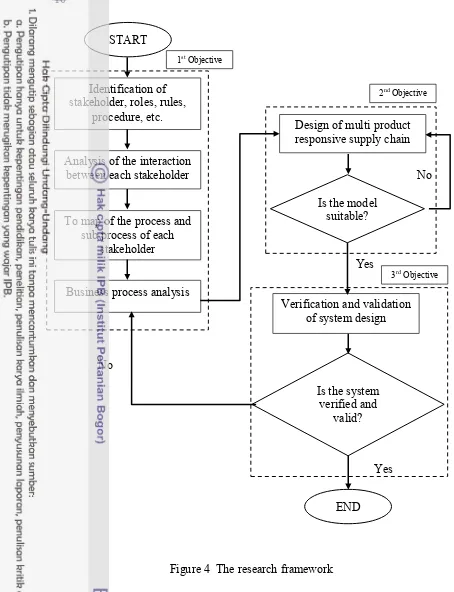
In order accomplish the research objectives, a methodology was designed which can be seen thoroughly in Appendix 2. This work began with the identification of system requirement of the tropical fruit responsive supply chain. System entity analysis (Wasson 2016) was employed for to identify the stakeholder, rule, role, mission, control, regulation, etc. Next, the digital business ecosystem (DBE) was analyzed and the representation of the business community interaction was illustrated by the Business Process Model Notation (BPMN) using Sybase Power Design 16.5 (SAP 2013). The design of responsive supply chain consisted of multi product classification model, responsive supply chain model and supplier selection model. Multi products classification modeling was performed using Decision Tree method and the computational process was done using WEKA 2.6. The quantitative model of responsive supply chain referred to Tiwari et al. (2013).
10
Figure 4 The research framework
Yes
No
Yes
No
START
Identification of stakeholder, roles, rules,
procedure, etc.
Business process analysis To map of the process and
sub process of each stakeholder
Analysis of the interaction between each stakeholder
Verification and validation of system design Design of multi product responsive supply chain
Is the model suitable?
Is the system verified and
valid?
END
1st Objective
2nd Objective
11 Identification of System
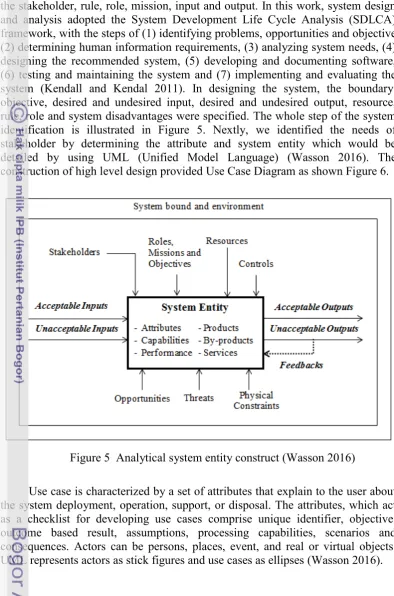
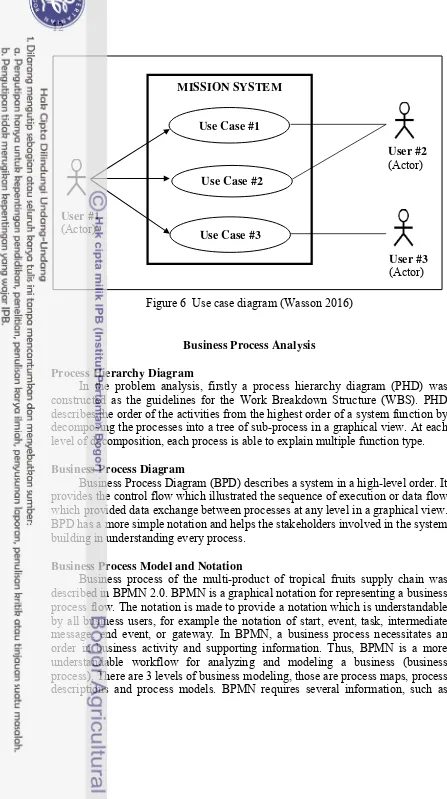
To achieve the first objective, we need to define the system by identifying the stakeholder, rule, role, mission, input and output. In this work, system design and analysis adopted the System Development Life Cycle Analysis (SDLCA) framework, with the steps of (1) identifying problems, opportunities and objective, (2) determining human information requirements, (3) analyzing system needs, (4) designing the recommended system, (5) developing and documenting software, (6) testing and maintaining the system and (7) implementing and evaluating the system (Kendall and Kendal 2011). In designing the system, the boundary, objective, desired and undesired input, desired and undesired output, resource, rule, role and system disadvantages were specified. The whole step of the system identification is illustrated in Figure 5. Nextly, we identified the needs of stakeholder by determining the attribute and system entity which would be detailed by using UML (Unified Model Language) (Wasson 2016). The construction of high level design provided Use Case Diagram as shown Figure 6.
Figure 5 Analytical system entity construct (Wasson 2016)
12
Figure 6 Use case diagram (Wasson 2016)
Business Process Analysis
Process Hierarchy Diagram
In the problem analysis, firstly a process hierarchy diagram (PHD) was constructed as the guidelines for the Work Breakdown Structure (WBS). PHD describes the order of the activities from the highest order of a system function by decomposing the processes into a tree of sub-process in a graphical view. At each level of decomposition, each process is able to explain multiple function type. Business Process Diagram
Business Process Diagram (BPD) describes a system in a high-level order. It provides the control flow which illustrated the sequence of execution or data flow which provided data exchange between processes at any level in a graphical view. BPD has a more simple notation and helps the stakeholders involved in the system building in understanding every process.
Business Process Model and Notation
Business process of the multi-product of tropical fruits supply chain was described in BPMN 2.0. BPMN is a graphical notation for representing a business process flow. The notation is made to provide a notation which is understandable by all business users, for example the notation of start, event, task, intermediate message, end event, or gateway. In BPMN, a business process necessitates an order in business activity and supporting information. Thus, BPMN is a more understandable workflow for analyzing and modeling a business (business process). There are 3 levels of business modeling, those are process maps, process descriptions and process models. BPMN requires several information, such as
User #3 (Actor) User #2 (Actor) MISSION SYSTEM
User #1 (Actor)
Use Case #1
Use Case #2
13 input, process/activity, output, organization/actor, sub-process, roles, mission and objectives (White 2008).
Classification of Multi Product
The classification of tropical fruits multi-product was done using Decision Tree (DT) method, a technique in data mining. We used Weka 2.6 for the data processing. Firstly, we built a dataset which represented the problem and then we determined the data class or the concept. The algorithms starts with a training set of tuples and their associated class labels. DT formulation should define the roots, internal node and leaf node (Han et al. 2012). According to Bramer (2007),
formulation should follow the determination of entropy and information gain as the following equation:
(1)
1
D
v j
InfoA D Info D j
j D
(2)
Gain A
Info D
InfoA
D (3)D is the entropy training set, while pi is the non zero probability that an arbitrary tuple in D belongs to class Ci.
Modeling of Responsive Supply Chain
The quantitative model for responsive supply chain used the mathematical model proposed by Tiwari et al. (2013). The decision variables in Tiwari’s model
are supplier, plant, distribution center, cross dock, cross dock-distribution center and consumer zone-cross dock. The multi-products observed in this research were juice, functional drinks and dodol.
Decision variables:
1. Supplier (s) : N s
1,0, ifotherwisesupplier s is open2. Plant (p) : X k
1,0, if plant p is openotherwise3. Distribution center (k) : Y k
1,0, if distribution center k is openotherwise4. Cross-Dock (j) : Z j
1,0, if cross dock j is openotherwise
log21
m
Info D pi pi
i
14
5. Cross-dock –Distribution center (j,k,i):
1,0,if crossdock j isassigned to distribution center k for product i
R jki otherwise
6. Customer zone (m, j,i):
1,0,if customer zone m isassigned to cross dock j for product i
Amji otherwise
Constraints:
1. The raw material purchase cost and transportation cost from suppliers (s) to
plants (p).
(4)1 1 1
P S R
UTCRrsp UCRrs
p s r rmp
2. The fixed and variable costs associated with plant operations.
(5)
1 1 1 1 1 1
P I P I P K
FCPp X p UPCPip ip UPCPipk vipk
p i p i p k
3. The variable cost of handling and inventory of products at distribution centers (DCs) and transportation of products from plant to DCs.
(6)
1 1 1 1 1
1 1 1
K I K J M I J K
FDCk Yk i j UTCDikj Rjki m i j UCTik DmiRjki Amji
k k k
4. The transportation cost to ship multi products from DCs to cross docks and distribution costs to ship multi products from cross docks to customer zone.
(7)
1 1 1 1
J M I J
FCDj Z j CSCmj Amji
j m i j
a. Flexibility of the supplier’s capacity (SF)
(8)1 1 1
I R S
SF PCVrs Ns D mi
i r s
b. Flexibility of the plant’s capacity (PF)
(9)1 1
I P
PF PCP X p Dmi
p
i p
c. Flexibility of the distribution center’s capacity (DCF)
(10)1 1
I K
DCF CDCk Yk Dmi
i k
15 d. Flexibility of the cross dock’s capacity (CDF)
(11)1 1
I J
CDF CCDj Z j Dmi
i j
e. Distribution volume flexibility (DVFm)
min SF PF DCF CDF, , , (12)
DVF m
f. Plant volume flexibility (PVFm)
(13)
1 1
P I
PVFm p X pPCPpi ipSUPip
The availability of required quantities of raw material with the supplier capability can be examined by equation:
(14) 1
P
PCV
rsp rs
p
Ensures that the raw material supplied by the supplier matches the production requirements:
(15)
1 1
S S
URri rsp PCVrs s s
Total production quantity of products to be manufactured should not exceed the plant capacity:
(16) 1
I
SUpip ip PCP X pp i
The quantity of products to be produced at a plant should be within the minimum and maximum production capacities. This constraint is examined by equation (17). Equation (18) administers the minimum and maximum throughput capacities for DCs and ensures that customer zone assignments can be made only to open DCs.
(17)
MNPVipX pipMXPVipX p
(18) 1 1
I M
MNTHkYki m SUDCikDmiRjkiAmjiMXTHkYk
Equation (19) shows that each customer zone must be assigned to exactly one cross-dock. Equation (20) ensures that the amount transported from plant is equal to the quantity of products available at the plant. Equation (21) checks if all the demand requirements are satisfied.
1 (19)
1
J Amji
16
(20) 1
K
ip k ipk
(21)
1 1 1
P K M
D mi ipk
p k m
The demand requirements at each distribution center are checked by equations (22) and (23). Equation (24) limits cross-docks to be assigned to only open distribution centers. Equation (25) ensures the distribution centers capacity restrictions.
(22)
1 1
P M
Dmi Rjki Amji ipk
p m
, , rsp 0 (23)
ip ipk
(24)
RjkiZj
(25) 1 1
M l
dmi Amji CCDj
m i
Equation (26) represents the capacity restriction for cross-docks. Equation (27) ensures that customer demand for products is satisfied by open cross-docks. Constraint given (28) checks that only open distribution centers will have product flow through its assigned cross-docks to customer zones.
(26) 1 1
M I
CCD CDC
R jki j k
m i
" (27)
Amji Zj
(28)
RjkiYk
Because capital availability is limited to any company, it is necessary to check whether the cost incurred in opening DCs and CDs should not exceed the available capital. This constraint is ensured by equations (29) and (30).
(29) 1
J
MXC Z j
j
(30) 1
K
MXD Y k
k
17 (31)
HRGlRGSsRGPpRGDCkRGCDjHRGu
(32)
MRGlRGSsRGPpRGDCkRGCDjMRGu
(33)
[image:33.595.86.511.177.775.2]LRGlRGSsRGPpRGDCkRGCDjLRGu
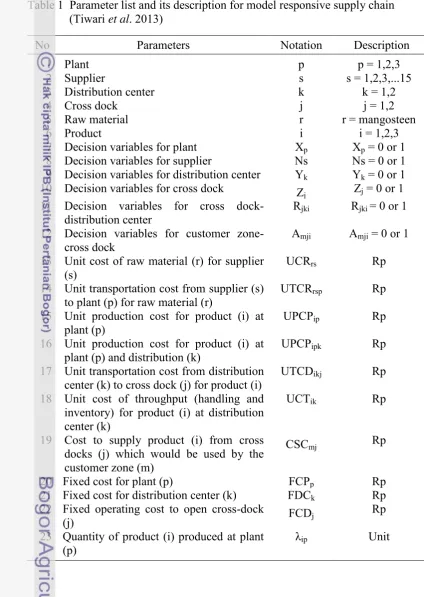
Table 1 Parameter list and its description for model responsive supply chain (Tiwari et al. 2013)
No Parameters Notation Description
1 Plant p p = 1,2,3
2 Supplier s s = 1,2,3,...15
3 Distribution center k k = 1,2
4 Cross dock j j = 1,2
5 Raw material r r = mangosteen
6 Product i i = 1,2,3
7 Decision variables for plant Xp Xp = 0 or 1
8 Decision variables for supplier Ns Ns = 0 or 1 9 Decision variables for distribution center Yk Yk = 0 or 1
10 Decision variables for cross dock Zj Zj = 0 or 1
11 Decision variables for cross
dock-distribution center Rjki Rjki = 0 or 1
12 Decision variables for customer
zone-cross dock Amji Amji = 0 or 1
13 Unit cost of raw material (r) for supplier
(s) UCRrs Rp
14 Unit transportation cost from supplier (s)
to plant (p) for raw material (r) UTCRrsp Rp 15 Unit production cost for product (i) at
plant (p) UPCPip Rp
16 Unit production cost for product (i) at
plant (p) and distribution (k) UPCPipk Rp 17 Unit transportation cost from distribution
center (k) to cross dock (j) for product (i) UTCDikj Rp 18 Unit cost of throughput (handling and
inventory) for product (i) at distribution center (k)
UCTik Rp
19 Cost to supply product (i) from cross docks (j) which would be used by the customer zone (m)
CSCmj Rp
20 Fixed cost for plant (p) FCPp Rp
21 Fixed cost for distribution center (k) FDCk Rp
22 Fixed operating cost to open cross-dock
(j) FCDj Rp
23 Quantity of product (i) produced at plant
18
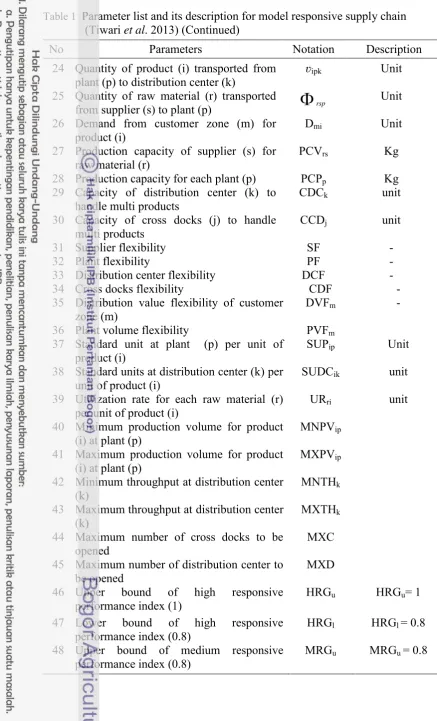
Table 1 Parameter list and its description for model responsive supply chain (Tiwari et al. 2013) (Continued)
No Parameters Notation Description
24 Quantity of product (i) transported from
plant (p) to distribution center (k) ʋipk Unit 25 Quantity of raw material (r) transported
from supplier (s) to plant (p)
rsp Unit26 Demand from customer zone (m) for
product (i) Dmi Unit
27 Production capacity of supplier (s) for
raw material (r) PCVrs Kg
28 Production capacity for each plant (p) PCPp Kg
29 Capacity of distribution center (k) to
handle multi products CDCk unit
30 Capacity of cross docks (j) to handle
multi products CCDj unit
31 Supplier flexibility SF -
32 Plant flexibility PF -
33 Distribution center flexibility DCF -
34 Cross docks flexibility CDF -
35 Distribution value flexibility of customer
zone (m) DVFm -
36 Plant volume flexibility PVFm
37 Standard unit at plant (p) per unit of
product (i) SUPip Unit
38 Standard units at distribution center (k) per
unit of product (i) SUDCik unit
39 Utilization rate for each raw material (r)
per unit of product (i) URri unit
40 Minimum production volume for product
(i) at plant (p) MNPVip
41 Maximum production volume for product
(i) at plant (p) MXPVip
42 Minimum throughput at distribution center
(k) MNTHk
43 Maximum throughput at distribution center
(k) MXTHk
44 Maximum number of cross docks to be
opened MXC
45 Maximum number of distribution center to
be opened MXD
46 Upper bound of high responsive
performance index (1) HRGu HRGu= 1
47 Lower bound of high responsive
performance index (0.8) HRGl HRGl = 0.8
48 Upper bound of medium responsive
19
Table 1 Parameter list and its description for model responsive supply chain (Tiwari et al. 2013) (Continued)
No Parameters Notation Description
49 Lower bound of medium responsive
performance index (0.6) MRGl MRGl = 0.6
50 Upper bound of low responsive
performance index (0.6) LRGu LRGu = 0.6
51 Lower bound of low responsive
performance index (0.4) LRGl LRGl = 0.4
52 Responsive level of supplier (s) RGSs RGSs =0,..., 1
53 Responsive level of plant (p) RGPp RGPp =0,..., 1
54 Responsive level of distribution center (k) RGDCk RGDCk =0,...,
1
55 Responsive level of cross-docks (j) RGCDj RGCDj =0,..., 1
A network designer needs to consider product characteristics as well as network requirements when deciding on the appropriate delivery network. The various networks considered earlier have different strength and weaknesses. The selecting a distribution network design in this study refers to Chopra and Meindl (2013). The comparison of the performance of delivery network design using a scale of 1 to 6, which corresponds to a value of 1 is the strongest performance and value of 6 to a weakest performance (Appendix 4). The suitability of different delivery designs in various situations is shown in Appendix 5.
Intuitionistic Fuzzy Hedges Modeling for Supplier Selection
Membership Function
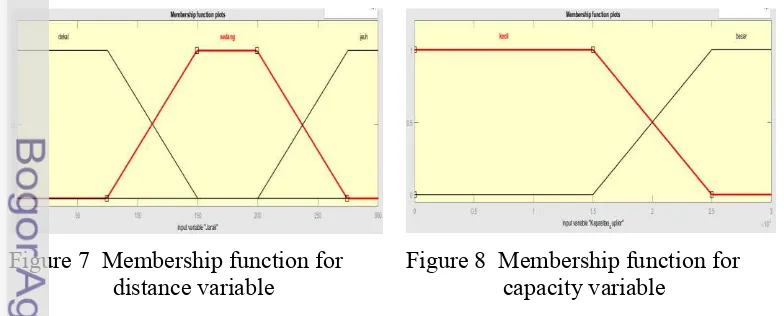
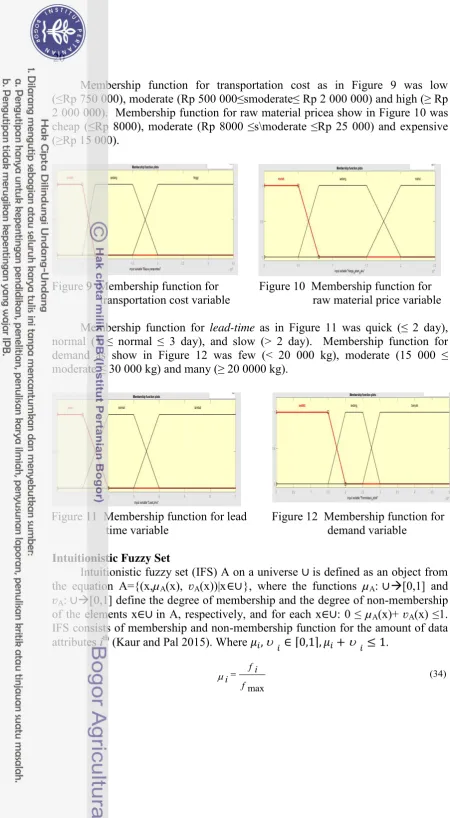
[image:35.595.117.509.585.743.2]Membership function is the essence in fuzzy set (Engelbrecht 2007). Limitation was set to simplify the calculation of fuzzy environment. For example, as shown in Figure 7 is the limitation for distance which were near (≤150km), moderate (75≤moderate≤275 km), and far (≥200 km). Membership function for capacity as in Figure 8 was low (≤25 000 kg) and high ≥25 000 kg).
Figure 7 Membership function for
20
Membership function for transportation cost as in Figure 9 was low (≤Rp 750 000), moderate (Rp 500 000≤smoderate≤ Rp 2 000 000) and high (≥ Rp
[image:36.595.33.484.7.826.2]2 000 000). Membership function for raw material pricea show in Figure 10 was cheap (≤Rp 8000), moderate (Rp 8000 ≤s\moderate ≤Rp 25 000) and expensive (≥Rp 15 000).
Figure 9 Membership function for
transportation cost variable Figure 10 Membership function for raw material price variable Membership function for lead-time as in Figure 11 was quick (≤ 2 day),
normal (1 ≤ normal ≤ 3 day), and slow (> 2 day). Membership function for demand as show in Figure 12 was few (< 20 000 kg), moderate (15 000 ≤ moderate ≤ 30 000 kg) and many (≥ 20 0000 kg).
Figure 11 Membership function for lead
time variable Figure 12 Membership function for demand variable Intuitionistic Fuzzy Set
Intuitionistic fuzzy set (IFS) A on a universe is defined as an object from the equation A={(x,µA(x), ʋA(x))|x }, where the functions µA: [0,1] and
ʋA: [0,1] define the degree of membership and the degree of non-membership
of the elements x in A, respectively, and for each x : 0 ≤ µA(x)+ ʋA(x) ≤1.
IFS consists of membership and non-membership function for the amount of data attributes ith (Kaur and Pal 2015). Where .
(34) max
f i i
f
21 min , min
max (35)
0, min
f f i
f f i f
i
f f i
Intuitionistic Fuzzy Hedges
An intuitionistic fuzzy hedge (Kaur and Pal 2015) consists of the hedge of concentration value (CON), dilation (DIL) values and hesitation function. Concentration (CON) in intuitionistic fuzzy set A of the universe is denoted by CON(A) and is defined by: where
the operation is defined by CON(A) = A2. This measure represents hedging of membership and non-membership functions are expected to decline.
2
1 1 (37)
x x
CON A A
Dilation (DIL) in intuitionistic fuzzy set A of the universe is denoted by DIL (A) and is defined by: where the
operation is defined by DIL(A) = A1/2. This measure represents hedging of
membership and non-membership functions are expected to increase.
1/2
, (38)
x x
DIL A A
1/2
1 1 (39)
x x
DIL A A
The decision making in supplier selection refers to Chen and Tan’s (1994) to evaluate E function in measuring the degrees, in which the alternative Mi
satisfies and does not satisfy the decision maker’s requirement.
, , ... ,
,
(40) ( )E Mi ijij ikik ipip isis
max min , ,..., , (41)
Mi ij ik ip is
min max , ,..., , (42)
Mi ij ik is
Let be an intuitionistic set, an accuracy function H (Liu and Wang 2007) of an intuitionistic fuzzy value can be represented as follows:
( ) (43)
H A x A x
A
Intuitionistic fuzzy weighted average operation
Aggregation intuitionistic fuzzy set is one important part in multi-attribute decision-making using Intuitionistic fuzzy set. Intuitionistic fuzzy weighted
average operation(Li 2014) used in this work is as follows:
,
A
2, (36)
x x
CON A A
22
1 2, ,...,
1 (1 ) , (44)1 1
j
n n
A j
f A A An j j j j
Association Rule Mining(ARM)
The measurement of pattern interestingness in supplier selection was conducted using conventional association rule mining (ARM) method (Han et al.
2012). Support value was obtained following this equation:
( ) ( ) (45)
Support X Y P XY
Entropy Weight
Entropy weight (Kahraman 2008) was deployed to evaluate the model of intuitionistic fuzzy hedges aggregation; equation (46) shows the entropy calculation while equation (47) shows the entropy weight calculation:
∑( ) ( )
[image:38.595.59.488.80.788.2]
∑
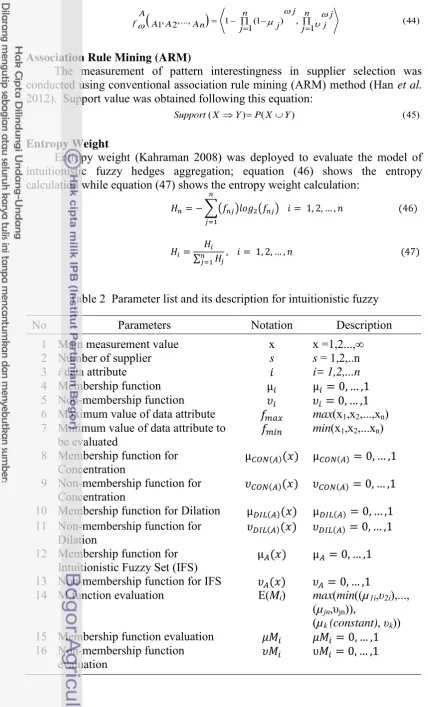
Table 2 Parameter list and its description for intuitionistic fuzzy
No Parameters Notation Description
1 Main measurement value x x =1,2...,∞
2 Number of supplier s s = 1,2,..n
3 i data attribute i= 1,2,...n
4 Membership function
5 Non-membership function
6 Maximum value of data attribute max(x1,x2,...,xn)
7 Minimum value of data attribute to
be evaluated min(x1,x2,...xn)
8 Membership function for
Concentration
9 Non-membership function for
Concentration
10 Membership function for Dilation
11 Non-membership function for
Dilation
12 Membership function for
Intuitionistic Fuzzy Set (IFS)
13 Non-membership function for IFS
14 M function evaluation E(Mi) max(min((µ1i,υ2i),..., (µjn,υjn)),
(µk (constant), υk)) 15 Membership function evaluation
16 Non-membership function
23 Table 2 Parameter list and its description for intuitionistic fuzzy (Continued)
No Parameters Notation Description
17 H function accuracy H(A) H(A) = 0,...,1
18 Intuitionistic fuzzy weighted
average operation function
19 Weight ω ω=0,...1
20 Intuitionistic fuzzy set An {low, moderate, high, etc} 21 Membership intuitionistic fuzzy
weighted average operator function 22 Non-membership intuitionistic
fuzzy weighted average operator function
23 Entropy weight for attribute ith Hi i= 1,2...,n
Verification and Validation
System verification was conducted to reveal the disadvantages of the system while identifying several issues. System verification was conducted to all of the three models: business process analysis (BPMN), responsive supply chain mathematical model and intuitionistic fuzzy hedges. BPMN model verification was conducted to check and ensure that there is no errors and warnings in the model. The quantitative responsive supply chain model was verified to check the properness of the conceptual model and the mathematical model based on real-time data on the field. The intuitionistic fuzzy hedges model verification was conducted before checking the validation using entropy weight method and estimating the accuracy using Confusion Matrix with Equation (48). Model validation ensures that the model satisfies the desired requirements in terms of the methods employed and the results obtained. Verification test that documents test results for each specification requirement based on prescribed verification methods.
4
RESULT AND DISCUSSIONS
System Identification
24
shows the construction of the system entities design of multi product responsive supply chain.
[image:40.595.48.482.46.792.2]The inputs in the system entity construction were the data of production, suppliers, processing and consumers. The process of the multi products responsive supply chain included the roles (data and information, flow of material and decision making), regulation, control (verification and validation) and mission (system of responsive supply chain for multi products of tropical fruit). Stakeholders involved in the system were procurement vendor (smaller to bigger suppliers community), business and processing unit (SMEs community) and finish good vendors, consisting distribution centers and cross dock community. The use case can be seen in Appendix 7.
Figure 13 Details of system entity construction
Business Process Analysis
The analysis of the multi products responsive supply chain system was provided by using BPMN 2.0. BPMN 2.0 is a model that can help to identify, define and describe the problem in a business process. Business process is one or more linked procedures or activities which aims to achieve overall business goals, usually in the context of an organizational structure that defines the functional roles and relationships (Draheim 2010). Result of the analysis of business processes is described in Figure 14 have been validated. PHD and BPD diagram can be seen in Appendix 8 and 9.
25 center and cross dock (vendor of finish goods inventory). Digital business ecosystem of this system had 2 layers, which were interaction between community of the business ecosystem and digital operation of the ecosystem. The first layer was business process between the business actors – or “species”, in the digital environment. The second layer was the digital device infrastructure of the business process of the first layer. The interaction in the infrastructure was service interaction.
Figure 14 Fragments of business analysis diagram in responsive supply chain of multi products
Classification of Multi Products
26
Table 3 Patterns of multi products with class “juice – functional drink, “juice - dodol” and “functional drink - dodol”
No Rule
1 IF final product stocks = many AND product quality= excellent AND the volume of production = many AND season = rainy, THEN a manufactured product = juice – functional drink
2 IF final product stocks = many AND product quality= excellent AND the volume of production = few AND the amount of the demand = high, THEN a manufactured product = juice – functional drink
3 IF final product stocks = many AND product quality= excellent AND the volume of production = many AND season = the summer, THEN a manufactured product = juice – dodol
4 IF final product stocks = many AND product quality= excellent AND the volume of production = few AND the amount of the demand = low, THEN a manufactured product = juice – dodol
5 IF final product stocks = many AND product quality= decayed, THEN a manufactured product= juice – dodol
6 IF final product stocks = few THEN a manufactured product = juice – dodol
[image:42.595.42.490.16.784.2]7 IF final product stocks = many AND product quality= less good, THEN a manufactured product = functional drink – dodol
Figure 15 Result decision tree structure
Final product stock
Juice - Dodol Product quality
The volume of production
Season The amount of the demand
Functional drink -Dodol Juice - Dodol
Juice –
Functional drink Juice - Dodol Functional drinkJuice – Juice - Dodol
Less good Decayed Excellent
Many
Rainy
High
Few Many
Few
Dry
27 Modeling of Responsive Supply Chain
The existing structure of mangosteen supply chain in the Regency of Tasikmalaya can be seen in Figure 16. The supply chain started from the farmer, collectors to local market and export/abroad place. In addition, the chain of SMEs existed as material flew from the farmer, collectors and local market.
[image:43.595.120.511.183.337.2]
Figure 16 The existing structure of mangosteen supply chain in Tasikmalaya Network Design
A crucial component of planning activities of a business and operating unit is the efficient design and operation of its supply chain. A Supply chain is a network of suppliers, business and processing unit (SMEs), warehouses and distribution channels organized to acquire raw materials, convert these raw materials to finished products and distribute these products to customers (Tiwari
et al. 2013). Based on the existing structure mangosteen supply chain, so we
designed responsive supply chain for multi products of tropical fruit network consists of vendor procurement (supplier community), business and processing unit (SMEs community), vendor inventory finish goods (distribution center and cross docks). The supply chain design of this work as seen in Figure 17.
To achieve a responsive supply chain, our main emphasis should be to satisfy the customer demands at specified service level incurring the lowest possible cost. The proposed model is formulated based on multi echelon supply chain network design by considering the responsiveness as a design criterion for supply chains by integrating customer sensitivity, processes, networks and information system. The five echelons of supply chain agroindustrial multi products of tropical fruit in this formulation include suppliers, SMEs, distribution centers, cross-docks and customer zone. The multi echelon supply chain network becomes responsive not only in terms of volume and plant flexibility but also in terms of total supply chain cost.
Farmer (Smallers) Supplier
SMEs Production
Supplier
(Biggers) Abroad Place Expor