THE IMPACT OF BLANCHING AND VACUUM PACKAGING
TO THE SHELF LIFE OF FRESH SEASONED TEMPE
GIDEON SATRIA PUTRA SUGIYANTO
DEPARTMENT OF FOOD SCIENCE AND TECHNOLOGY
FACULTY OF AGRICULTURAL ENGINEERING AND TECHNOLOGY BOGOR AGRICULTURAL UNIVERSITY
STATEMENT LETTER OF MANUSCRIPT AND SOURCE OF
INFORMATION*
Hereby I genuinely state that the manuscript entitled The Impact of Blanching and Vacuum Packaging to The Shelf life of Fresh-Seasoned Tempe is an authentic work of mine under supervision of academic advisor and never being presented in any forms and universities. All the information taken and quoted from published or unpublished works of other writers have been mentioned in the texts and attached in the references at the end of the manuscript.
Bogor, The Undersigned,
Gideon Satria Putra S
ABSTRACT
GIDEON SATRIA PUTRA SUGIYANTO. The Impact of Blanching and Vacuum Packaging to the Shelf Life of Fresh Seasoned Tempe. Supervised by JOKO HERMANIANTO, MADE ASTAWAN, SULIANTARI.
Tempe is an indigenous fermented food from Indonesia, prepared by the action of molds, Rhizopus sp., on cooked soybeans. In 2012, up to 60% of soybean production went to tempe industry with consumption of tempe reaching 8.5 kg per person per year in Indonesia. However, the export of tempe seems still impossible due to its perishable characteristic whose shelf life is very short. Pre-blanching and vacuum packaging were expected to extend the shelf life of tempe. This research was aimed to study the application of blanching and vacuum packaging on the shelf life of fresh-seasoned tempe. Steam blanching of 80 oC for three minutes was selected from pre-investigation for pre-treatment of the tempe without inducing cooked-tempe characteristic. The result of main research revealed that steam blanching and vacuum packaging were able to extend the shelf life of fresh-seasoned tempe for two days in room temperature (23-24 oC), 32 days in refrigeration temperature (4-6 oC), and 49 days in chilling temperature (0-4 oC). The pH of tempe was found increasing during storage with texture getting overstuffed or tender during storage.
Manuscript
Submitted as a partial fulfilment of the requirement for degree of
Bachelor of Agricultural Technology (STP) At the Department of Food Science and Technology
THE IMPACT OF BLANCHING AND VACUUM PACKAGING
TO THE SHELF LIFE OF FRESH SEASONED TEMPE
GIDEON SATRIA PUTRA SUGIYANTO
DEPARTEMENT OF FOOD SCIENCE AND TECHNOLOGY
FACULTY OF AGRICULTURAL ENGINEERING AND TECHNOLOGY BOGOR AGRICULTURAL UNIVERSITY (IPB)
PREFACE
Thank God, Thank God, Thank God for Your abundant grace and blessing so that finally I could finish this final year project and my bachelor degree in Food Science and Technology - IPB regardless hesitations and uncertainties I had before. In this occasion, I would like to embrace my appreciation and gratitude to people and organization whose contribution cannot be disregarded.
1. Mama, Ayah, my two little angels, Maria and Yosua, and my whole family in Kediri for genuine and never ending love, prayers, and support given
2. Dr. Joko Hermanianto, Prof. Made Astawan, and Dr. Suliantari for being my final year project supervisors. Thanks for the constant encouragements, advice, input, constructive criticism, and moral value shared
3. The Directorate of Research and Community Service, the Directorate General of Higher Education, Ministry of Education and Culture, for funding this research through the “Hibah Kompetensi” scheme under the name of Made Astawan
4. Karya Salemba Empat (KSE) for providing me scholarship.
5. Gerardus Yosua, Mustika Aminta, Ayu Pramesti for sharing laugh-tears, happy-sad and bearing with my vicissitudes. Fahlul Bariqi, Raditya Prabowo, Stella Alinneshia, and Mutiara Pratiwi for always inspiring. Not to mention all of my friends in ITP 47 „Doa Ibu‟ such as but not limited to Nurul Falah, Tessa, Diki, Tasya thanks for three years irreversible FST life, also to my „extended family‟, USM-AIMS exchange students and ITP 48 for a short colorful semester.
6. Indonesia Tempe House (Rumah Tempe Indonesia) for allowing me to come over and make the tempe there.
7. Technicians of laboratories of Food Science and Technology and UPT ITP for being wonderfully helpful.
8. IPB Debating Community family for nurturing me to be high achiever, especially Mam Alfa for being great, inspiring, humble Ibu in IDC and giving me exceptional motivation.
9. House mates in „The Dharma House‟, Alam, Habib, Luqman, Hijran, Sodik, and Dias for being my true family in Bogor.
10.Everyone who has given contribution toward this manuscript and help or support during my university life in IPB.
Bogor,
TABLE OF CONTENT
ABSTRACT iv
PREFACE vii
TABLE OF CONTENT ix
LIST OF TABLE x
LIST OF FIGURE x
LIST OF APPENDICES x
INTRODUCTION 1
Background 1
Objectives 2
Advantages of Research 2
METHODOLOGY 3
Time and Places 3
Materials 3
Instruments 3
Methods 3
RESULT AND DISCUSSION 6
Preliminary Study 6
Main Research 7
CONCLUSION AND RECOMEDATION 17
Conclusion 17
Recommendation 17
REFERENCES 17
LIST OF TABLE
1. Blanching Time 7
2. Extended Storage Study for Fresh Seasoned Tempe 9 3. Extended Storage Study for Fresh Non-Seasoned Tempe 9
4. Chemical Composition of Fresh Seasoned Tempe 14
5. Result of Microbial Analysis 15
6. Heavy Metal Contamination Analysis of Fresh Seasoned Tempe 16
LIST OF FIGURE
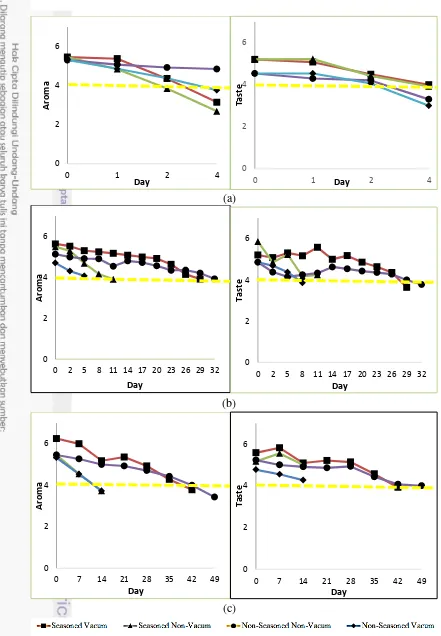
1. Result of Sensory Evaluation on Attributes of Aroma and Taste room (a), refrigeration (b), and chiller (c) with area below yellow line ( )
is rejected area 8
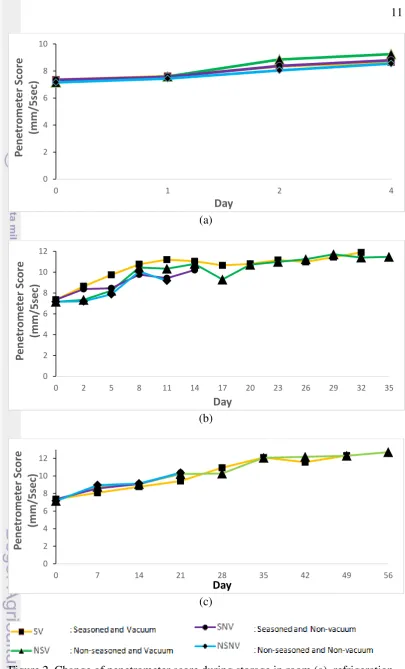
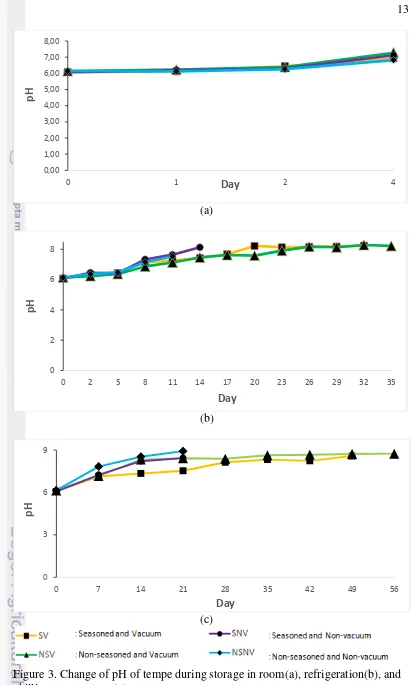
2. Change of penetrometer score during storage in room (a), refrigeration (b), and chilling temperature(c). 11 3. Change of pH of tempe during storage in room(a), refrigeration(b),
and chilling temperature (c). 13
LIST OF APPENDICES
1. Independent Sample Test (T-Test) for Pre-Blanching 22 2. Univariate Analysis of Variance One Way ANOVA Water Content 32 3. Univariate Analysis of Variance One Way ANOVA Protein Content 33 4. Univariate Analysis of Variance One Way ANOVA Lipid Content 34 5. Univariate Analysis of Variance One Way ANOVA Carbohydrate
Content 35
INTRODUCTION
Background
Tempe is an indigenous fermented food from Indonesia, prepared by the action of molds, such as but not limited to Rhizopus sp., on cooked soybeans through controlled fermentation process. Tempe has been being preferred staple food in Indonesia for years. Tempe is well known for its nutritional value, health benefits (Astuti et al. 2000; Astawan 2008; Babu et al. 2009; Messina et al. 2009), and admirable digestibility (Nout and Kiers 2005). Indonesia is acknowledged as
world‟s biggest producer of tempe and centre of soybean market in Asia. In 2012, up to 60% of soybean stocks went to tempe industry with the average population consumption of tempe in Indonesia reached 8.5 kg per person per year (BPS 2012). It was also estimated that there were more than 81 thousand small enterprises of tempe in Indonesia that produced up to 2.4 million ton of tempe per year. Indonesia was only able to supply 600 thousand ton soybean out of 2.2
million ton soybean‟s needs every year. Normally, Indonesia imports soybean from the United States of America to satisfy the demand of soybean (BSN 2012).
Tempe becomes one of meat alternative for people living as vegetarian or veganism due to its high protein content. Sarwono (2002) revealed that in 100 g of fresh tempe contain around 18.3 g protein while in 100 g of beef contain 12.8 g protein. Following that fact, potential market of tempe is not only domestic scale but also international one, countries like India, China, Japan, Australia, European countries (Vegetarian Victoria 2011), as well the United States are listed as top countries with high number of vegans (Stahler 2009). In 2013, there were up to 540 million people were vegetarian with the top consumers spread in India up to 500 million people (Vegetarians 2013) and the rest 40 million were European and American (Raw Food Health 2008). The prediction, which said that up to nine billion people around the world would follow vegetarian trend in 2050, has even strengthened the prospect of tempe in the future (Huffpost Living 2014).
2
soon would become worldwide tempe‟s standard (CODEX Indonesia 2013). It showed how world has also put highest concern upon tempe as international food that is indigenous from Indonesia.
Despite the above facts, the export of tempe seems still impossible due to its perishable characteristic whose shelf life is very short. Tempe can only last for one to two days in ambient temperature. Consequently, it has been being obstacle for further development and innovation of tempe product. Consumers are requested to consume tempe directly or save it in short time prior to consumption. Whereas, consumers nowadays are demanding food with longer shelf life, simple in processing or cooking, and delicious. Thus, seasoning with salt and garlic was chosen as that combination is most favourite and simplest seasoning for tempe in Indonesia.
Many researches have been done to study methods of extending shelf life of tempe, such as dried-flavored tempe (Mutiara 1985), drying and sterilization of tempe (Kemala 2006), and also combination of vacuum packaging and sterilization (Indriani 2006). Previous studies were mostly applying high temperature-thermal process that has been proven to extend shelf life of food product. However, thermal process application changes the natural appearance and physical properties of fresh tempe which is unable to meet consumers nowadays‟ trend upon ready-to-cook food.
Objectives
3
METHODOLOGY
Time and Places
This research was conducted in two places. The first place was Indonesia Tempe House or Rumah Tempe Indonesia (Bogor) for producing the tempe. The second place was Faculty of Agricultural Engineering and Technology Laboratory Bogor Agricultural University (IPB), which were Pilot Plan SEAFAST-Center for blanching process, Packaging Laboratory of Department of Agricultural Industrial Technology for packaging process, Laboratory of Department of Food Science and Technology for analysis. Research was done in March – June 2014.
Materials
Materials of this research were classified into two groups, which were materials for tempe manufacturing and for analysis purposes. Materials for producing tempe consisting of local soybean (Glycine max) Grobogan from Central Java-Indonesia, water, filter cloth, brand Raprima yeast, plastic packaging polyethylene thickness of 8 mm, seasoning (garlic and salt). The materials needed for the analysis included H2SO4, HgO, K2SO4, solution of 60% NaOH-5%Na2SO3,
H3BO3, HCl, Boiling stones, methylene blue indicator, the indicator phenoftalein,
hexane, NaOH, Whatman filter paper No. 2, ethanol, and distilled water. Media required for microbiological analysis were lactose broth, RV medium, TT broth, HEA, BSA, XLDA, TSIA, LIA, LTB medium, EC Broth, EMBA, Trytone broth, MRVP
Instruments
Instrument of this research were classified into two groups, which were materials for tempe manufacturing and for analysis purposes. Instruments for making tempe consisting of buckets, containers stainless boilers, machinery soybean stainless skinner, rack stainless fermentation, and the fermentation chamber (incubator), steam blanching, vacuum sealer. The instrument used for the analysis were analytical balance, oven, desiccator, electric furnace, Kjeldahl complete, complete distillation apparatus, Soxhlet extraction tools such as condensers and electric heating, pH meters, penetrometer, chemical analytical and other standard microbiological analytical tools.
Methods
This research was divided into two parts, which were preliminary investigation and main research.
Preliminary Investigation Characterization of soybean
4
Production of Tempe
Production of tempe was done by applying Good Manufacturing Practices (GMP) and follow standard tempe manufacture in Rumah Tempe Indonesia (RTI), Bogor-Indonesia. The inoculated soybean was packed in oval-shaped plastic (d= 2cm) which had been perforated.
Determination of Blanching Time
Determination of blanching time was done by exposing hot air using steam blanching (80 oC) to ten slices of tempe with thickness of two cm. Blanching times were varied from one minutes to 10 minutes. Texture of blanched tempe was then observed and being compared with un-blanched tempe (control). Texture analysis using penetrometer was also done to examine the texture change objectively. Selected tempe was the tempe that had no significance difference with control in term of texture (p > 0.05) using T-Test.
Main Research
Production of Fresh Seasoned-Tempe and Packaging Process
Tempe that had been made were sliced uniformly with thickness of two cm. Tempe was then blanched by exposing 80 oC hot air for three minutes. The tempe was then marinated in seasoning for one hour to allow optimal absorption. Seasoning that was chosen in this research was salt and garlic. A 10 gram of salt was mixed by 30 gram of garlic and 200 ml water. All of those ingredient were blended homogenously prior to seasoning.
After that, seasoned-tempe was drained before being packed in vacuum packaging using PE plastic. The processes above were done aseptically to prevent microbial contamination. Tempe was then stored in three different temperatures, which were room temperature (23-24 oC), refrigeration temperature (4-6 oC) and chilling temperature (0-4 oC)
Determination of Shelf life
Determination of shelf life of was done both subjectively and objectively. Subjective evaluation was done by conducting sensory evaluation test of tempe to ten trained panellists using hedonic test. Trained panellists were selected after several selection steps. Starting from their sensitivity upon colours, taste, aroma,
texture and continued by their sensitivity upon tempe‟s attribute changes. Selected panellists undergone series of training to enhance their assessment‟s sensitivity
upon sensory attributes of tempe. Objective evaluations were conducted through pH measurement and texture during storage.
Extended Storage Study (Arpah 2001)
5 spoiled tempe. Sensory evaluations were held every day for tempe that were stored in room temperature, every three days for tempe that were stored in refrigeration temperature, and every seven days for tempe that were stored in chilling temperature. Tempe owning average score below four in particular attribute would be classified as deteriorated tempe due to rejection from panellist and the sensory evaluation test would be ended and proceed to simple regression drawing to determine the predicted shelf life. This conventional method of determining shelf life is proven accurate for food that has shelf life less than three months (Arpah 2001).
Measurement of pH
Prior to measurement, pH meter was stabilized for ±10 minutes and calibrated using pH 4.0 and 7.0 standards. Electrode was rinsed with distillate water dried thoroughly using dryer paper. Tempe that had been mashed was mixed homogenously with distillate water with a ratio of 1:1. Electrode was placed into the sample and allowed to stabilize to measure the pH of sample. Analysis of Texture using Penetrometer
Selection of appropriate probe was done prior to texture-analysis using penetrometer. A probe of needle without burden was used in this study. To start analysing, clutch button was pressed to lock the probe once it was fitted. Probe was then lowered until almost touching the sample and the run button was pressed to start analysing for five seconds. This analysis was done ten times for one sample in different spots to ensure that the result would represent all parts of the sample. The average of ten scores showed from the display was the result of texture analyses that expressed in depth (mm/5sec).
Proximate Analysis
Analysis of Moisture Content (AOAC 2005)
Moisture content was determined by drying the sample in the hot air oven at 100-105 oC for four hours. About 10±0.10 g of sample tempe was weighed into pre-dried and weighed moisture dishes, and place in the oven at 100-105 oC until a constant weight obtained.
Analysis of Crude Fat Content (AOAC 2005)
Sample of tempe was hydrolysed before undergoing crude fat content analysis. Crude fat of tempe was determined by solvent extraction using the Soxhlet system. About three g of tempe sample was weighed into pre-dried thimble covered with cotton and dried in 105 oC oven for two hours. Hexane was poured into a pre-dried and weighed vessel in the cup holder. The thimble was attached onto the magnetic head of extraction unit. The vessel was transferred to 105 oC for 30 minutes to evaporate the excess hexane, cooled in desiccators, and weighed.
Analysis of Crude Protein Content (AOAC 2005)
6
went through three stages of crude protein content analysis using Kjeldahl method, namely the stage of digestion, distillation, and titration.
Analysis of Ash Content (AOAC 2005)
About ten g of tempe sample was weight into ashing dish that had been ignited, cooled, and weighed. Sample was burned by Bunsen burner until the some vanished. The ashing dish was transferred into muffle furnaces at 550 oC until white or grey-white, cooled in desiccator and weighed.
Analysis of Carbohydrate Content (By Difference)
Carbohydrate content dry basis in the sample was determined by subtracting the sum of the percentage of crude protein, crude fat, and ash from 100.
Analysis of Microbiology
Microbial analysis was done to detect the existence of Salmonella sp. and E. coli in fresh-seasoned tempe. There were several steps to conduct microbial analyses, which were enrichment, pre-prediction, prediction, identification. Bacteria were analysed following standard methodologies described in the Bacteriological Analytical Manual of Escherichia coli (Feng et al. 2002) and
Salmonela sp. (Andrews and Hammack 2007) Analysis of Heavy Metal Contamination
Heavy metal contamination was conducted to analyse possibility of contaminations of Cd, Pb, Sn, Hg, Ar. Analysis was conducted using atomic absorption spectrophotometer (AAS).
RESULT AND DISCUSSION
Preliminary Study Determination of Blanching Time
Blanching is a unit operation that is commonly done to inactivate enzymes, modify texture, preserve colour, flavour, and nutritional value, and remove trapped air in food. Blanching can be done through water blanching, steam blanching, microwave blanching, or gas blanching (Corcuera 2004). Gokmen (2005) reported that exposing food with hot air 80 oC through blanching could inactivate up to 90% of enzyme activities. Compared to hot water blanching, steam blanching was found to be more effective and beneficial in preventing excess of nutrients loss (Martinez et al. 2012; Xiao et al. 2014). Steam blanching 80 oC was applied in this research on tempe product as pre-treatment to suppress metabolic activity of molds (prevent continued fermentation) and also proteolytic and lipolytic enzyme which were major reasons of fresh tempe deterioration.
7 changing of blanched tempe compared by un-blanched tempe as a control. The result of penetrometer test (Table 1) showed that application of steam blanching 80 oC with the duration longer than three minutes had caused tangible undesirable texture changing (p<0.05) of fresh tempe, consequently tempe was assumed possessing cooked-tempe texture. Full result of T-Test SPSS can be seen in Appendix 1.
Table 1 Blanching Time Time (minutes) Penetrometer
(mm/ 5 seconds)
Time (minutes) Penetrometer (mm/ 5 seconds)
Results were expressed as mean
Symbol * showed significant difference compared to control (p<0.05)
Main Research
Shelf life Determination of Tempe
Shelf life of food product can be defined as a period between production time and retail purchase of a food product during which the product still serves satisfactory quality or retain desired sensory, chemical, physical, and microbiological characteristics (Ellis and Man 2000). Shelf life determination was commonly conducted through Extended Storage Study (ESS) for perishable product, which only had shelf life less than three months and Accelerated Shelf life Testing (ASLT) for food products having longer shelf life (Herawati 2008).
Tempe was categorized as highly perishable food product, which had shelf life less than two days in ambient temperature. In this study, Extended Storage Study (ESS) or conventional method was applied to determine the shelf life of the tempe. ESS was done through partially staggered design by drawing a simple regression of subjective data or organoleptic assessments result (Gacula and Kubala 1975). Plastic that was used in the research was polyetilene (PE) plastic type. PE plastic is commonly used for vacuum packaging due to its characteristic, which are translucent to opaque, robust enough to be virtually unbreakable and quite flexible at the same time (Dirim et al. 2004). Vacuum packaging was applied to this research in expectation to extend the shelf life of the tempe.
8
9 Off odor that was spread by the raw tempe was contributed by ammonia as the impact of continuous fermentation and also influenced of seasoning that was added. Pungent off odor and sour aroma of raw tempe were not detected by panelists on fried tempe but it came up as bitter taste in several samples, thus the fried tempe score on taste attribute reached below four as shown in the graph above. Consequently, these two attributes were mostly referred as detrimental attributes in determining shelf life of tempe. The summary result of extended storage study of the tempe could be seen in Table 2 and 3
Table 2 Extended Storage Study for Fresh Seasoned Tempe
Vacuum Non Vacuum
Room Temperature (23-24 oC)
Y y = -0.6186x + 5.67 y = -0.7051x + 5.444
R2 0.9545 0.9889
Shelf life (days) 2 1
Refrigeration Temperature (4-6 oC)
Y y = -0.0514x + 5.8405 y = -0.1437x + 5.8633
R2 0.9003 0.9756
Shelf life (days) 32 14
Chilling Temperature (0-4 oC)
Y y = -0.046x + 6.38 y = -0.1236x + 6.31
R2 0.9551 0.9991
Shelf life (days) 49 21
x axis represented day(s) y axis represented sensory attribute
Table 3 Extended Storage Study for Fresh Non-Seasoned Tempe
Vacuum Non Vacuum
Room Temperature (23-24 oC)
Y y = -0.384x + 5.252 y = -0.3051x + 4.624
R2 0.9869 0.9371
Shelf life (days) 3 2
Refrigeration Temperature (4-6 oC)
Y y = -0.0285x + 5.1716 y = -0.0867x + 4.8183
R2 0.8917 0.9578
Shelf life (days) 35 11
Chilling Temperature (0-4 oC)
Y y = -0.0386x + 5.8634 y = -0.1143x + 6.1333
R2 0.9324 0.9999
Shelf life (days) 55 21
x axis represented day(s) y axis represented sensory attribute
10
or chilling temperature, vacuum packaging worked better than in the room temperature. Tempe could eventually have longer shelf life in low temperature storage compared to ambient temperature.
Fresh seasoned tempe had shelf life up to 32 days while non-seasoned tempe had shelf life up to 35 days in refrigeration. Lower temperature, which was chilling temperature, could even extend the shelf life of seasoned tempe up to 49 days and up to 55 days for non-seasoned tempe. Vacuum packaging worked by expelling all air inside the packaging without altering with other gas (Jay 2000), thus, eventually vacuum packaging is known to be a good barrier for oxygen and water (Masniyom et al. 2013) and effective to extend shelf life of food product (McMillin 2008; Brenesselova et al. 2015).
Normally, tempe without pre-blanching treatment and vacuum packaging could only remain in a good condition up to two weeks in low temperature storage. Tempe would undergo texture changing and undesirable odor for the time of storage longer than that. The absence of oxygen in the packaging could retard the growth of aerobic spoilage bacteria such as Pseudomonas spp., Enterobacteriaceae, Shewanella putrefaciens (Arashisar et al. 2004; Stamatis and Arkoudelos, 2007; Mastromatteo et al. 2010). The application of hurdle concept by involving low temperature storage could also delay deterioration due to microbial or chemical activities.
Shelf life of seasoned-tempe was shorter than non-seasoned one. Theoretically, garlic that was added as spices seasoning of tempe possess antimicrobial substance, Allicin (diallythiosulphinate), which is able to suppress microbial growth (Rahayu 2010). However, odor or unpleasant smell produced by combination of salt and garlic which owns highly reactive sulfur molecules (Gitin
et al. 2014; Kimbaris et al. 2006) that were stored in vacuum for few days contributed to the production undesirable attribute or odor for panelists, remembering the shelf life determination was done through sensory evaluation. Nevertheless, seasoned tempe owned the strength in term of its simple practicality due to its pre-seasoning step compared by existing product. Thus, consumers could directly cook the tempe without seasoning at first.
Texture of Tempe During Storage
Analysis of texture changing of tempe during storage was done using penetrometer as a form of objective observation upon shelf life determination of
tempe. Texture of tempe can be pointed as one of objective characterization upon shelf life and quality of tempe since consumers often assess the texture of tempe
before purchasing.
11
(a)
(b)
(c)
12
The tempe had been packed in vacuum and blanched previously that could suppress metabolic activities of microorganism, such as molds, however, due to storage condition (room temperature), continued fermentation by Rhizopus sp. still running in lower rate that can destroy inter-matrix of soybeans. Consequently, tempe were getting softer and mushy when continued fermentation happened and
additional water was exist due to carbohydrate‟s breakage (Ferreira et al. 2011). Other than that, tempe which has high amount of protein could undergo coagulation and lose its water binding capacity which caused texture changing of the tempe (Fellow 2000).
Measurement of pH of Tempe during Storage
Stability of food product could be correlated with its easiness to undergo chemical changes. One of the manifestation of chemical changes on food is the change of pH during storage. Measurement of pH change of tempe was done as an objective observation to the shelf life of tempe. Measurement of pH was conducted periodically following subjective determination of shelf life of tempe using ESS method. It is known to be important to measure the change of pH of food as an intrinsic factor that work as an indicator of quality and acceptance of food.
Result of pH measurement is expressed in score number 1-14. Food owning pH below 7 is considered as acid food while those having pH score above 7 are categorized as base or alkaline.
In regard of the quality of tempe, change of pH during storage has a close relation with the content of ammonia inside tempe. Previous study done by Pambudi (2013) reported that the pH of tempe tend to increase due to continued-fermentation process. Figure 3. showed the trend of increment of pH of tempe during storage in various storage condition.
Decipherment of protein happens during storage of tempe. Protein would be degraded into base compound such as ammonia, which contributes in increasing the pH. The pH of food change due to degradation of protein that was caused by the acts of proteolitic enzyme into carboxylic acid, sulfide acid, and ammonia (Chamidah 2000).
Initial ph of fresh tempe is influenced by its fermentation process. As other chemical changes, the pH change during storage was also manifested in sensory attribute of tempe. This chemical reaction‟s result influenced consumers‟ sensory acceptance on tempe through its contribution upon odor or unacceptable aroma and also taste. Normal tempe actually has unique aroma as manifestation of
13
(a)
(b)
(c)
Figure 3. Change of pH of tempe during storage in room(a), refrigeration(b), and chilling temperature (c).
0,00 1,00 2,00 3,00 4,00 5,00 6,00 7,00 8,00
0 1 2 4
pH
Day
0 2 4 6 8
0 2 5 8 11 14 17 20 23 26 29 32 35
pH
Day
0 3 6 9
0 7 14 21 28 35 42 49 56
pH
14
Chemical Composition
Table 4 Chemical Composition of Fresh Seasoned Tempe
Content (%)
Period of Analysis
Req (SNI) Day 0 End of Storage (Rejected Tempe)
Room Refrigeration Chilling Water** (wb) 63.62 ±
* Different words following the number in a row showed that result was significantly different (p < 0.05)
**Different words following the number in a row showed that result was highly significance different (p < 0.01)
Water is one of detrimental component in food affecting its quality, such as appearance, texture, and palatability. Water content in food also determines acceptability and shelf life of food product (Li et al. 2011). Indonesian National Standard of tempe or SNI 3144-2009 regulates the maximum water content of tempe is 65% and this had been complied by final product of fresh-seasoned tempe in this research whose water content was 63.62 %. Result of sequence water content analysis during storages through the analysis of variance (Appendix 2) revealed that there was no significant difference found (p>0.05) for end storage in room and refrigeration. However, a highly significance different (p<0.01) was found between water content in Day 0 tempe and in the end of storage of chilling temperature which was 65.86 %. Water transfer for environment or cold storage to inside the packaging could cause this increment of water content. The vacuum condition of the packaging could possibly be broken after long storage in lower temperature, which were up to 49 days in this research. However, this water content increment that close to maximum of water content regulated by SNI happened in the end of storage when the tempe was nearly rejected.
Tempe is valued mainly as a rich source of high plant protein. As the result of fermentation process, bioavailability of protein of fermented soybean was known to be higher than unfermented one (Pawiroharsono 2007; Susi 2012; Bavia
15 analysis reported that protein content in the tempe was 48.98 % db that was in the range of SNI requirement upon tempe, minimally 45 % db. The result of analysis of variance (Appendix 3) revealed that protein content of fresh seasoned tempe increased significantly (p<0.05) between day 0 and end of storage in ambient temperature (p<0.05) which was 48.982 % into 50.72% respectively.
The result of crude fat analysis showed no significant difference (p>0.05) between tempe day 0 and end of storage in room, refrigeration, and chilling temperature (Appendix 4). The range of crude fat content was 43.63 % to 44.38 % dry basis that had been complied with requirement addressed by Indonesian National Standard of Tempe SNI 3144-2009 which is 28 % in least content. Carbohydrate content that was obtained from by difference calculation reported (Appendix 5) that there was no significant increment (p<0.05) of its content from Day 0 to the end of every storage condition. The range for carbohydrate content were 3.58 % - 5.20 % db.
Ash content analysis informs and is closely related to mineral content in food. The result of ash content though analysis of variance (Appendix 6) reported that there was no significant difference (p>0.05) of ash content of tempe day 0 and end of ambient storage. In the other hand, highly significant difference (p<0.01) was reported between day 0 tempe and end of refrigeration and chilling temperature storage which were 2.2 % to 1.84 % and 1.83 % respectively. The trend of reduction was found during the change after storage in cold temperature. Fennema (1996) reported that mineral content in food can decrease do to washing or physical separation. This mineral reduction was the manifestation of leaching of minerals into water (Helmy 2003; Wang 2010). It was also supported by Santoso et al. (2006) and Salamah et al. (2012), reporting that mineral content in food can decrease after boiling or other processing involving water since mineral is a water soluble. In this research, ash content of tempe stored in cold temperature was analyzed after thawing process, consequently mineral was presumably dissolved and went wasted. However, ash content of the tempe still fulfilled SNI 3144-2009 requirement, which is 4% by maximum.
Microbiological Analysis
Table 5 Result of Microbial Analysis
Microbe Unit Result Req (SNI)
Escherichia coli
MPN/g < 3.00 Max 10
Salmonella sp. per 25 g Negative Negative
16
Streptococcusand Clostridium spp. However, the same activities combating
Escherichia coli and Salmonella sp was not found (Roubos-van den Hil and Nout 2011)
Escherichia coli, abbreviated as E. coli, is a Gram negative and facultative anaerobic bacteria which is a member of the normal intestinal micro flora of humans and other mammals. Its cell ability to grow well outside in a limited time resulted this bacteria often being used as indicator organism for fecal contamination or hygiene practices in food manufacturing (Melliawati 2009).
Salmonella sp belongs to rod-shaped Gram-negative bacteria. Similar with E.coli, Salmoenella sp is characterized as pathogenic bacteria which responsible with some diseases caused by its infection or known as salmonellosis (Narumi et al.
2009). The result of both bacteria indicated that standard quality upon microbial safety of Indonesian National Standard of Tempe or SNI 3144-2009 had been complied. Pre-blanching (steaming 80 oC) applied in this research was indicated to be effective to suppress microbial growth in food. (Gokmen2005).
Water activity is also known to be essential factor for microbial growth. Reducing water activity below which optimum condition of microbial can grow create a stress condition for microbes. Additional of salt as the seasoning which is very hygroscopic could decrease the water activity by binding the free water. Other than that, in common, Salmonella sp. and Escherichia coli, which belong the family of Enterobacteriaceae, are sensitive to salt (Abdulkarim et al. 2009) whereas salt was used as seasoning in this research to marinate the tempe. Addition of garlic (Allium sativum Linn) as seasoning was presumed to have an active compound namely Allicin which could work as antimicrobial agent (Syifa
et al. 2013) which effectively suppress both Gram-positive and Gram-negative bacteria such as Staphylococcus aureus, Salmonella typhii, Pseudomonas aeruginosa, Escherichia coli and Proteus sp. (Durairaj et al. 2009; Syifa et al.
2013).
Heavy Metal Contamination Analysis
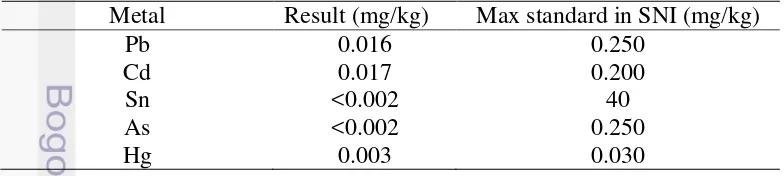
Table 6 Heavy Metal Contamination Analysis of Fresh Seasoned Tempe Metal Result (mg/kg) Max standard in SNI (mg/kg)
Pb 0.016 0.250
Cd 0.017 0.200
Sn <0.002 40
As <0.002 0.250
Hg 0.003 0.030
17 Heavy metals which are found frequently contaminate tempe in Indonesia are lead (Pb), cadmium (Cd), tin (Sn), arsenic (As), and mercury (Hg). The result of heavy metals analysis (Table 7) revealed that fresh-seasoned tempe had afforded safety regulation of tempe established through Indonesian National Standard. Producing method, which had applied principle of Good Manufacturing Practices, contributed in prevention of heavy metals contamination.
CONCLUSION AND RECOMEDATION
Conclusion
Steam blanching 80oC for three minutes can be applied to tempe to supress microbial growth without inducing cooked-like texture. Combination of vacuum packaging and low temperature storage was reported to be effective to extend the shelf–life of fresh-seasoned tempe up to 49 days (without vacuum was only 21 days) in chilling, while storage in refrigeration and ambient temperature with vacuum packaging were reported to have shorter shelf life, which were 32 and 2 days respectively. Increment of pH and penetrometer score were found during storage due to continued fermentation. Fresh-seasoned tempe day 0 had complied regulation of tempe quality established by Indonesian National of Standard (SNI 3144-2009) in term of proximate, microbial safety, and heavy metals contamination.
Recommendation
For the further research, measuring the pressure of vacuum packaging and measurement of ammonia content change are recommended.
REFERENCES
[AOAC] Association of Official Analytical Chemistry. 2005. Official Method of Analysis. Association of Official Analytical Chemistry. Washington DC (US): AOAC
Abdulkarim SM, Fatimah AB, and Anderson JG. 2009. Effect of salt concentrations on the growth of heat stressed and unstressed Escherichia coli. J. Food Agr. Environ. 7 (3&4):52-54.
Andrews WH and Hammack TS. 2007. Salmonella. In Bacteriological Analytical Manual Online, Chapter 5 [Internet]. Downloaded from http://www.fda.gov/Food/FoodScienceResearch/LaboratoryMethods/ucm0 70149.htm
Arashisar S, Hisar O, Kaya M, and Yanik T. 2004. Effects of modified atmosphere and vacuum packaging on microbiological and chemical properties of rainbow trout (Oncorynchus mykiss) fillets. Int. J. Food Microbiol. 97(2):209-214.
18
Astawan M. 2008. Sehat dengan Tempe. Jakarta (ID): Indonesia
Astawan M. 2008. Bahaya logam berat dalam makanan [Internet]. Downloaded from
http://health.kompas.com/read/2008/09/21/11254074/Bahaya.Logam.Berat. dalam.Makanan
Astawan M, Wresdiyati T, Widowati S, Bintari SH, and Ichsani N. 2013. Phsyco-chemical characteristic and functional properties of tempe made from different soybeans varieties. Pangan. 22(3):241-252.
Astuti M, Andreanyta M, Fabien SD, and Mark LW. 2000. Tempe, a nutritious and healthy food from Indonesia. Asia Pac. J. Clin. Nutr. 9(4):322-325. Babu DP, Bhakyaraj R, and Vidhyalakshmi R. 2009. A low cost nutritious food
[BAM] Bacteriological Analytical Manual. 2002. BAM : Chapter 4 Enumeration of Escherichia coli and the Coliform bacteria. Downloaded from http://www.fda.gov/Food/FoodScienceResearch/LaboratoryMethods/ucm0 64948.htm
Bavia ACL, Silva CE, Ferreira MP, Leite RS, Mandarino JMG, and Carrao-Panizzi MC. 2012. Chemical composition of tempeh from soybeans cultivars specially developed for human consumtion. Maderas Ciênc. Tecnol. 32: 613-620
[BB-Pascapanen] Balai Besar Penelitian dan Pengembangan Pascapanen Pertanian. 2008. Tanpa Kedelai Tetap Bisa Makan Tempe. Warta Penelitian dan Pengembangan Pertanian Vol. 30, No. 1 2008. Bogor(ID) : Balai Besar Penelitian dan Pengembangan Pascapanen Pertanian.
[BPS] Badan Pusat Statistik. 2012. Berita Resmi Statistik No. 70/11/Th. XV, 1 November 2012. Jakarta (ID): Badan Pusat Statistik
Brenesselova M, Korenekova B, Macanga J, Marcincak S, Jevinova P, Pipova M, and Turek P. 2015. Effects of vacuum packaging conditions on the quality, biochemical changes and the durability of ostrich meat. Meat Sci. 101:42-47
[BSN] Badan Standardisasi Nasional. 2012. Tempe : Persembahan Indonesia untuk Dunia. Jakarta(ID) : Badan Standardisasi Nasional
[BSN] Badan Standardisasi Nasional. 2009. SNI Nomor 3144 Tahun 2009 tentang Tempe Kedelai. Jakarta (ID): Badan Standardisasi Nasional
CODEX Indonesia. 2013. Standar Tempe Diadopsi Menjadi Standar Regional CODEX. http://codexindonesia.bsn.go.id/main/berita/berita_det/705 [May 20th 2014]
Corcuera J. 2014. Blanching Food. USA : Encyclopedia of Agricultural, Food, and Biological Engineering - Washington State University(US)
19 Dirim SN, Ozden HO, Alev B, and Ali E. 2004. Modification of water vapour transfer rate of low density polyethylene films for food packaging. J. Food Eng. 63 : 9-13.
Durairaj S, Srinivasan S, and Lakshmanaperumalsamy P. 2009. In vitro
antibacterial activity and stability of garlic extract at different pH and temperature. eJBio. 5(1):5-10.
Ellis MJ and Man CMD. 2000. The methodology of shelf-life determination. Gaithersburg (MD): Aspen Publishers
Fellows P. 2000. Food Processing Technology: Principles and Practice2nd Eds. Florida (USA): CRC Press
Feng P, Stephen DW, Michael AG, and William B. 2002. Enumeration of
Rhizopus oligosporus and yeast co-cuntivation during barley tempeh fermentation-nutritional impact and real-time PCR quantification of fungal growth dynamics. Food Microbiol. 24 : 393-402.
Feng XM, Larsen TO, and Schnurer J. 2006. Production of volatile compounds by
Rhizopus oligosporus during soybean and barley tempeh fermentation. Int J. Food Microbiol. 113:133-141.
Fennema, O.R. (ed.). 1996. Food Chemistry 3rd Edition. New York (USA) : Marcel Dekker, Inc
Ferreira M. 2011. Changes in the isoflavone profile and in the chemical composition of tempeh during processing and refrigeration. Pesq Agropec Bras. 46:1555-1561.
Gacula MC and Kubala JJ. 1975. Statistical models for shelf life failures. J. Food Sci. 40:404-409.
Gitin L, Dinica R, Neagu C, and Dumitrascu L. 2014. Sulfur compounds identification and quantification from Allium spp. fresh leaves. J.Food Drug. Anal. 22(4):425-430.
Gokmen V. 2005. Study of lipoxygenase and peroxidase as blanching indicator enzymes in peas : change of enzyme activity, ascorbic acid and chlorophylls during frozen storage. LWT-Food Science and Technology. 38(8):903-908.
Helmy IMF. 2003. Effect of some conventional processing methods on quality of substituted cake with chickpea flour. Minufiya J. Agric. Res. 28(6):1939-1955.
Herawati H. 2008. Penentuan Umur Simpan. Litbang Pertanian. 27(4):124-130
Huffpost Living. 2014. Vegetarian Diet : Scientists Predict The World‟s
Population Will Become Vegetarian by 2050.
http://www.huffingtonpost.ca/2012/08/27/vegetarian-diet-scientist_n_1834182.html. [May 20th 2014]
20
Institute of Food Science and Technology. 1974. Shelf life of food. J. Food Sci.
39: 861−865.
Jay. 2000. Poultry Products Processing – An Industry Guide. Florida (US): CRC Press
Jarup L. 2003. Hazard of heavy metal contamination. Brit Med Bull. 68: 167-182. Kemala SNP. 2006. Upaya Memperpanjang Umur Simpan Tempe dengan Metode Pengeringan dan Sterilisasi [manuscript]. Bogor (ID) : Institut Pertanian Bogor.
Kimbaris AC, Siatis NG, Daferera DJ, Tarantilis PA, Pappas CS, and Polissiou MG. 2006. Comparison of distillation and ultrasound-assisted extraction methods for the isolation of sensitive aroma compound from garlic (Allium sativum). J. Ultsonch. 13(1):54-60.
Li M, Zhu K, Guo X, Peng W, and Zhou H. 2011. Effect of water activity (aw) and irradiation on the shelf-life of fresh noodles. J.Ifset. 12(4):526-630.
Martinez S, Perez N, Carballo J, and Franco I. 2012. Effect of blanching methods
and frozen storage on some quality parameters of turnip greens (“grelos”). LWT-Food Sci Technol. 51(1):383-392.
Mastromatteo M, Danza A, Conte A, Muratore G, and Nobile MAD. 2010. Shelf-life of ready to use peeled shrimps as affected by thymol essential oil and modified atmosphere packaging. Int. J. Food Microbiol. 144:250-256. Masniyom P, Benjama O, and Maneesri J. 2012. Effect of modified atmosphere
and vacuum packaging on quality changes of refrigerated tilapia (Oreochromis niloticus) fillets. Int Food Res J. 20(3):1401-1408.
McMeekin TA and Ross T. 2002. Predictive microbiology: providing a
knowledge-based framework for change management. Int. J. Food
Microbiol. 78: 133–153
McMillen. 2008. Where is MAP going? A review and future potential or modified atmosphere packaging for meat. Meat Sci. 80:15-35.
Melliawati R. 2009. Escherichia coli dalam kehidupan manusia. BioTrends. 4(1):10-14.
Messina M, Watanabe S, and Setchell KDR. 2009. Report on the 8th International Symposium on the Role of Soy in Health Promotion and Chronic Disease Prevention and Treatment. J.Nutr. 139: 1S-7S.
Mutiara D. 1985. Mempelajari Pengaruh Pengeringan dan Penyimpanan Tempe Berflavor Sintesis Terhadap Penerimaan [manuscript]. Bogor (ID): Institut Pertanian Bogor
Narumi H, Zuhriansyah, and Imam M. 2009. Pollution detection of Salmonella sp.
to fresh white shrimp (Penaeusmerguiensis) at traditional market of Surbaya residence. Jurnal Ilmiah Perikanan dan Kelautan. 1(1):87-91. Nout MJR and Kiers JL. 2005. Tempeh fermentation, innovation, and
functionality: Update info the third millennium. J. Appl. Microbiol. 04(98): 789-805.
Pasaribu T. 2007. Produk fermentasi limbah pertanian sebagai bahan pakan unggas di Indonesia. Wartazoa. 17(3): 109-116.
21 Roubos-van den Hil PJ and Nout MJR. 2011. Anti-Diarrhoeal Aspects of
Fermented Soya Beans. InTech. 8:383-406.
Rahayu WP. 2000. Aktivitas Antimikroba Bumbu Masakan Tradisional Hasil Olahan Industri terhadap Bakteri Patogen dan Perusak. Bul.Teknol. dan Industri Pangan. 11(2):42-48.
Raw Food Health. 2008. The Number of Vegetarian in The World. http://www.raw-food-health.net/NumberOfVegetarians.html. [Sept 1st 2014]
Reyes-Moreno C, Romero-Urias CA, Milan-Carrillo J, and Gomez-Garza YRM. 2000. Chemical composition and nutritional quality of fresh and hardened chickpea (Cicer arietinum L) after the solid state fermentation (SSF). Food Sci. Tech. Int. 6 (3):251-258.
Salamah E, Sri P, and Rika K. 2012. Kandungan Mineral Remis (Corbiculajavanica) Akibat Proses Pengolahan. Akuatika. 3(1):74-83. Santoso J, Satako G, Yumiko YS, Takeshi S. 2006. Mineral content of
Indonesian seaweed solubility affected by basic cooking. Food Sci Technol Res. 12(1): 59-66.
Sarwono B. 2002. Membuat Tempe dan Oncom. Jakarta (ID): Penebar Swadaya Shurtleff W and Aoyagi A. 2004. The Book of Tempe: A Cultured Soyfood
available in Badan Standardisasi Nasional. 2012. Tempe : Persembahan Indonesia untuk Dunia. Jakarta(ID) : Badan Standardisasi Nasional
Stahler C. 2009. How Many Vegetarian Are There? The Vegetarian Resource Group Asked in a 2009 National Poll. Vegetarian J. 410:366-8343.
Stamatis N and Arkoudelos J. 2007. Effect of modified atmosphere and vacuum packaging on microbial, chemical, and sensory quality indicators of fresh, filled Sardina pilchardus at 3 oC. J. Sci. Food Agric. 87(6):1164-1171 Susi. 2012. Komposisi kimia dan asam amino pada tempe kacang nagara (Vigna
unguiculata ssp. Cylindrica). Agroscientiae. 19(1):28-36.
Syifa N, Bintari SH, and Mustikaningtyas D. 2013. Uji efektivitas ekstrak bawang putih (Allium sativum Linn.) sebagai antibakteri pada ikan bandeng (Chanos chanos Forsk.) segar. Unnes.J.Life Sci. 2(2):71-77.
Vegetarian Victoria. 2011. Statistics on Vegetarianism. http://www.vegetarianvictoria.org.au/home-page/contact-us.html [May 20th 2014]
Vegetarians New Zealand. 2013. 500 Million Vegetarians in India.http://www.vegetarians.co.nz/articles/500-million-vegetarians-in-india/ [Sept 1st 2014]
Wang N, Hatcher DW, Tyler RT, Toews R, and Gawalko EJ. 2010. Effect of cooking on the Composition of beans (Phaseolus vulgaris L.) and chickpea (Cicer arietinum L.). Food Res.Int. 43:589-594.
Xiao HW, Bai JW, Sun DW, and Gao ZJ. 2014. The application of superheated steam impingement blanching (SSIB) in agricultural products processing.
22
APPENDICES
Appendix 1 Independent Sample Test (T-Test) for Pre-Blanching a. Control and Blanching 1 Minute
Group Statistics
Sample N Mean Std. Deviation Std. Error Mean
Value Control 10 6.4600 .48808 .15434 Blanching 1 10 6.6100 .67733 .21419
Independent Samples Test
Levene's
Test for
Equality of
Variances
t-test for Equality of Means
F Sig. t df Sig.
(2-tailed)
Mean
Difference
Std. Error
Difference
95%
Confidence
Interval of the
Difference
Lower Upper
Value Equal
variances
assumed
3.146 .093
-.568 18 .577 -.15000 .26401
-.70466 .40466
Equal
variances
not
assumed
-.568 16.362 .578 -.15000 .26401
23 b. Control and Blanching 2 Minutes
Group Statistics
Sample N Mean Std. Deviation Std. Error Mean
Value
Control 10 6.4600 .48808 .15434
Blanching 2 10 6.8700 .54782 .17324
Independent Samples Test
Levene's
Test for
Equality of
Variances
t-test for Equality of Means
F Sig. t df Sig.
(2-tailed)
Mean
Difference
Std. Error
Difference
95%
Confidence
Interval of the
Difference
Lower Upper
Value Equal
variances
assumed
.188 .670
-1.767 18 .094 -.41000 .23202
-.89746 .07746
Equal
variances
not
assumed
-1.767 17.765 .094 -.41000 .23202
24
c. Control and Blanching 3 Minutes
Group Statistics
Sample N Mean Std. Deviation Std. Error Mean
Value
Control 10 6.4600 .48808 .15434
Blanching 3 10 6.9300 .56578 .17892
Independent Samples Test
Levene's
Test for
Equality of
Variances
t-test for Equality of Means
F Sig. t df Sig.
(2-tailed)
Mean
Difference
Std. Error
Difference
95%
Confidence
Interval of the
Difference
Lower Upper
Value Equal
variances
assumed
.339 .568
-1.989 18 .062 -.47000 .23629
-.96643 .02643
Equal
variances
not
assumed
-1.989 17.621 .062 -.47000 .23629
25 d. Control and Blanching 4 Minutes
Group Statistics
Sample N Mean Std. Deviation Std. Error Mean
Value
Control 10 6.4600 .48808 .15434
Blanching 4 10 8.8600 .94775 .29970
Independent Samples Test
Levene's
Test for
Equality of
Variances
t-test for Equality of Means
F Sig. t df Sig.
(2-tailed)
Mean
Difference
Std. Error
Difference
95% Confidence
Interval of the
Difference
Lower Upper
Value Equal
variances
assumed
3.916 .063
-7.119 18 .000 -2.40000 .33711
-3.10825
-1.69175
Equal
variances
not
assumed
-7.119 13.460 .000 -2.40000 .33711
-3.12576
26
e. Control and Blanching 5 Minutes
Group Statistics
Sample N Mean Std. Deviation Std. Error Mean
Value
Control 10 6.4600 .48808 .15434
Blanching 5 10 9.4000 .75572 .23898
Independent Samples Test
Levene's
Test for
Equality of
Variances
t-test for Equality of Means
F Sig. t df Sig.
(2-tailed)
Mean
Difference
Std. Error
Difference
95% Confidence
Interval of the
Difference
Lower Upper
Value Equal
variances
assumed
2.034 .171
-10.334 18 .000 -2.94000 .28449
-3.53769
-2.34231
Equal
variances
not
assumed
-10.334 15.395 .000 -2.94000 .28449
-3.54502
27 f. Control and Blanching 6 Minutes
Group Statistics
Sample N Mean Std. Deviation Std. Error Mean
Value
Control 10 6.4600 .48808 .15434
Blanching 6 10 10.1300 .58509 .18502
Independent Samples Test
Levene's
Test for
Equality of
Variances
t-test for Equality of Means
F Sig. t df Sig.
(2-tailed)
Mean
Difference
Std. Error
Difference
95% Confidence
Interval of the
Difference
Lower Upper
Value Equal
variances
assumed
.190 .668
-15.232 18 .000 -3.67000 .24095
-4.17621
-3.16379
Equal
variances
not
assumed
-15.232 17.439 .000 -3.67000 .24095
-4.17738
28
g. Control and Blanching 7 Minutes
Group Statistics
Sample N Mean Std. Deviation Std. Error Mean
Value
Control 10 6.4600 .48808 .15434
Blanching 7 10 11.4900 .92069 .29115
Independent Samples Test
Levene's
Test for
Equality of
Variances
t-test for Equality of Means
F Sig. t df Sig.
(2-tailed)
Mean
Difference
Std. Error
Difference
95% Confidence
Interval of the
Difference
Lower Upper
Value Equal
variances
assumed
7.320 .014
-15.264 18 .000 -5.03000 .32953
-5.72231
-4.33769
Equal
variances
not
assumed
-15.264 13.688 .000 -5.03000 .32953
-5.73828
29 h. Control and Blanching 8 Minutes
Group Statistics
Sample N Mean Std. Deviation Std. Error Mean
Value
Control 10 6.4600 .48808 .15434
Blanching 8 10 12.3100 1.03328 .32675
Independent Samples Test
Levene's
Test for
Equality of
Variances
t-test for Equality of Means
F Sig. t df Sig.
(2-tailed)
Mean
Difference
Std. Error
Difference
95% Confidence
Interval of the
Difference
Lower Upper
Value Equal
variances
assumed
4.455 .049
-16.188 18 .000 -5.85000 .36137
-6.60921
-5.09079
Equal
variances
not
assumed
-16.188 12.826 .000 -5.85000 .36137
-6.63177
30
i. Control and Blanching 9 Minutes
Group Statistics
Sample N Mean Std. Deviation Std. Error Mean
Value
Control 10 6.4600 .48808 .15434
Blanching 9 10 14.4100 .86980 .27506
Independent Samples Test
Levene's
Test for
Equality of
Variances
t-test for Equality of Means
F Sig. t df Sig.
(2-tailed)
Mean
Difference
Std. Error
Difference
95% Confidence
Interval of the
Difference
Lower Upper
Value Equal
variances
assumed
.817 .378
-25.206 18 .000 -7.95000 .31540
-8.61263
-7.28737
Equal
variances
not
assumed
-25.206 14.157 .000 -7.95000 .31540
-8.62577
31 j. Control and Blanching 10 Minutes
Group Statistics
Sample N Mean Std. Deviation Std. Error Mean
Value
Control 10 6.4600 .48808 .15434
Blanching 10 10 15.9400 1.12862 .35690
Independent Samples Test
Levene's
Test for
Equality of
Variances
t-test for Equality of Means
F Sig. t df Sig.
(2-tailed)
Mean
Difference
Std. Error
Difference
95% Confidence
Interval of the
Difference
Lower Upper
Value Equal
variances
assumed
2.748 .115
-24.380 18 .000 -9.48000 .38884
-10.29693
-8.66307
Equal
variances
not
assumed
-24.380 12.253 .000 -9.48000 .38884
-10.32529
32
Appendix 2 Univariate Analysis of Variance One Way ANOVA Water Content Between-Subjects Factors
Value Label N
Treatment 1.00 Control 2
2.00 Room Temperature 2
3.00 Refrigeration 2
4.00 Chilling 2
Tests of Between-Subjects Effects
Dependent Variable: Water
Source Type III Sum of
Squares
df Mean Square F Sig.
Corrected Model 7.242a 3 2.414 31.882 .003 Intercept 33072.062 1 33072.062 436811.123 .000
Storage 7.242 3 2.414 31.882 .003
Error .303 4 .076
Total 33079.607 8
Corrected Total 7.544 7
a. R Squared = .960 (Adjusted R Squared = .930)
Water
Duncan
Storage N Subset
1 2
Room Temperature 2 63.4600
Day 0 2 63.6200
Refrigeration Temperature 2 64.2400
Chilling Temperature 2 65.8650
Sig. .050 1.000
Means for groups in homogeneous subsets are displayed.
Based on observed means.
The error term is Mean Square(Error) = .076.
a. Uses Harmonic Mean Sample Size = 2.000.
33 Appendix 3 Univariate Analysis of Variance One Way ANOVA Protein Content
Between-Subjects Factors
Value Label N
Treatment 1.00 Control 2
2.00 Room Temperature 2
3.00 Refrigeration 2
4.00 Chilling 2
Tests of Between-Subjects Effects
Dependent Variable: Protein
Source Type III Sum of
Squares
df Mean Square F Sig.
Corrected Model 3.265a 3 1.088 6.973 .046 Intercept 19799.505 1 19799.505 126869.075 .000
Storage 3.265 3 1.088 6.973 .046
Error .624 4 .156
Total 19803.394 8
Corrected Total 3.889 7
a. R Squared = .839 (Adjusted R Squared = .719)
Protein
Duncan
Storage N Subset
1 2
Day 0 2 48.9800
Refrigeration Temperature 2 49.4400
Chilling Temperature 2 49.8600 49.8600
Room Temperature 2 50.7150
Sig. .094 .096
Means for groups in homogeneous subsets are displayed.
Based on observed means.
The error term is Mean Square(Error) = .156.
a. Uses Harmonic Mean Sample Size = 2.000.
34
Appendix 4 Univariate Analysis of Variance One Way ANOVA Lipid Content Between-Subjects Factors
Value Label N
Treatment 1.00 Control 2
2.00 Room Temperature 2
3.00 Refrigeration 2
4.00 Chilling 2
Tests of Between-Subjects Effects
Dependent Variable: Lipid
Source Type III Sum of
Squares
df Mean Square F Sig.
Corrected Model 1.277a 3 .426 1.697 .304 Intercept 15485.360 1 15485.360 61716.176 .000
Storage 1.277 3 .426 1.697 .304
Error 1.004 4 .251
Total 15487.641 8
Corrected Total 2.281 7
35 Appendix 5 Univariate Analysis of Variance One Way ANOVA Carbohydrate
Content
Between-Subjects Factors
Value Label N
Treatment 1.00 Control 2
2.00 Room Temperature 2
3.00 Refrigeration 2
4.00 Chilling 2
Tests of Between-Subjects Effects
Dependent Variable: Carbohydrate
Source Type III Sum of
Squares
df Mean Square F Sig.
Corrected Model 2.882a 3 .961 3.519 .128 Intercept 145.096 1 145.096 531.413 .000
Storage 2.882 3 .961 3.519 .128
Error 1.092 4 .273
Total 149.070 8
Corrected Total 3.974 7
36
Appendix 6 Univariate Analysis of Variance One Way ANOVA Ash Content Between-Subjects Factors
Value Label N
Treatment 1.00 Control 2
2.00 Room Temperature 2
3.00 Refrigeration 2
4.00 Chilling 2
Tests of Between-Subjects Effects
Dependent Variable: Ash
Source Type III Sum of
Squares
df Mean Square F Sig.
Corrected Model .240a 3 .080 101.688 .000 Intercept 31.880 1 31.880 40482.683 .000
Storage .240 3 .080 101.688 .000
Error .003 4 .001
Total 32.124 8
Corrected Total .243 7
a. R Squared = .987 (Adjusted R Squared = .977)
Ash
Duncan
Storage N Subset
1 2
Chilling Temperature 2 1.7950
Refrigeration Temperature 2 1.8550
Room Temperature 2 2.1450
Day 0 2 2.1900
Sig. .099 .184
Means for groups in homogeneous subsets are displayed.
Based on observed means.
The error term is Mean Square(Error) = .001.
a. Uses Harmonic Mean Sample Size = 2.000.
37
AUTHOR BIOGRAPHY
“Until you get enough of enough, the enough that is never enough, you dare not quit! If your good is better, your better
can be best; your best too can become excellent!” Cheerful, friendly, workaholic, and smart. Those are four-first words that pop up in people mind about Gideon. Gideon Satria Putra Sugiyanto was born in Kediri, January 6th, 1992 as the first son of a lovely family of Yohanes Gentur Sugijanto and Tutik Suhermin. Spending most of his youth time (almost 17 years) far away from his parent and younger siblings, Maria A.D.P Sugiyanto and Yosua Sugiyanto, which most people cannot deal with has nurtured him to be a tough, visionary, and independent person. Being a high achiever has been in the blood of Gideon proven by him awarded top student in honour class of SDN Pare 2, SMPN Pare 2, and SMAN Pare 2 where he previously enjoyed his education. He has collected trophies of various competitions during high school period. He was awarded as The Most Friendly Tourism Ambassador of Kediri Regency (Inu-Kirana) 2009, trusted as one of Duta Lalu Lintas East Java Province 2009, selected as delegate of East Java Province for JENESYS and Singapore Camp 2009. The interesting dynamics and promising prospect of food industry worldwide brought him to Bogor Agricultural University in 2010 majoring Food Science and Technology with Communication as his minor.
His interest in discussing current issues, sharpening logical thinking and public speaking brought him to IPB Debating Community (IDC) where he eventually elected as the President in his sophomore year, he was also a member of International Association of Students in Agricultural and Related Sciences (IAAS). He championed WHO Debate on Food and Water Crisis, being semi-finalist of Danone Youth Social Entrepreneurship 2012, speaking at Asia Pacific Model United Nations, Melbourne-Australia 2012 and World Universities Debating Championship in Berlin-Germany 2013. In his senior year (7th semester), he was granted a scholarship for exchange program, ASEAN International Mobility for Students, to University Sains Malaysia from DIKTI for a semester. He came back to Indonesia in 2014 and flight to Montreal-Canada as the Grand Finalist of Students Fighting Hunger Competition held by IUFoST during World Food Science and Technology Congress 2014 continued by championing workshop competition during Tri-U International Joint Seminar and Symposium 2014, Chiangmai-Thailand three months later. He was also a scholar receiver of Karya Salemba Empat (KSE).