GENETIC DIVERSITY AND ORIGIN OF LEATHERBACK
TURTLE (
Dermochelys coriacea
) FROM SUMATRA
MASLIM
GRADUATE SCHOOL
BOGOR AGRICULTURAL UNIVERSITY BOGOR
STATEMENT OF THESIS AND
INFORMATION SOURCES
I hereby certify that the thesis entitled Genetic Diversity and Origin of Leatherback Turtle (Dermochelys coriacea) from Sumatra is true of my work with the direction of the supervisory commission and has not been submitted in any form to any college. The source of information originating in or quoted from published and unpublished works from other writers have mentioned in the text and listed in the bibliography at the end of this thesis.
I hereby assign copyright of my thesis to the Bogor Agricultural University.
Bogor, March 2016
RINGKASAN
MASLIM. Keragaman Genetik dan Asal Penyu Belimbing (Dermochelys
coriacea) di Sumatera. Dibimbing oleh ACHMAD FARAJALLAH dan
NEVIATY P. ZAMANI.
Penyu belimbing (Dermochelys coriacea) adalah salah satu dari tujuh spesies penyu di dunia. Distribusi spesies ini tersebar di perairan tropis dan sub-tropis. Habitat mencari makan dan bersarang spesies ini dapat ditemukan di beberapa tempat di Indonesia, mulai dari Sumatera sampai Papua.
Sebagai salah satu habitat penyu belimbing, studi penyu belimbing di Sumatera perlu dilakukan. Hal ini dilakukan untuk memperoleh berbagai data sebagai pendukung pengelolaan perlindungan spesies ini. Penelitian ini bertujuan untuk menganalisis keragaman genetic dan pola konektivitas penyu belimbing dari Sumatra menggunakan penanda genetik mitokondria dan mikrosatelit.
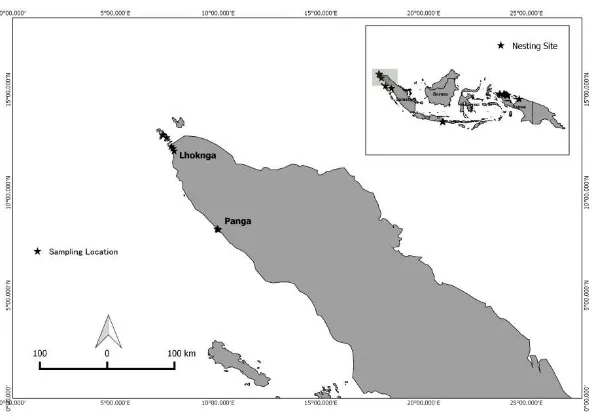
Sampel penyu belimbing dikumpulkan dari daerah peneluran penyu belimbing di Panga (Aceh Jaya) dan Lhoknga (Aceh Besar), Sumatera. Jaringan penyu belimbing yang diambil dari bagian flipper. Isolasi DNA dilakukan dengan menggunakan metode fenol/kloroform. Amplifikasi DNA ruas control region
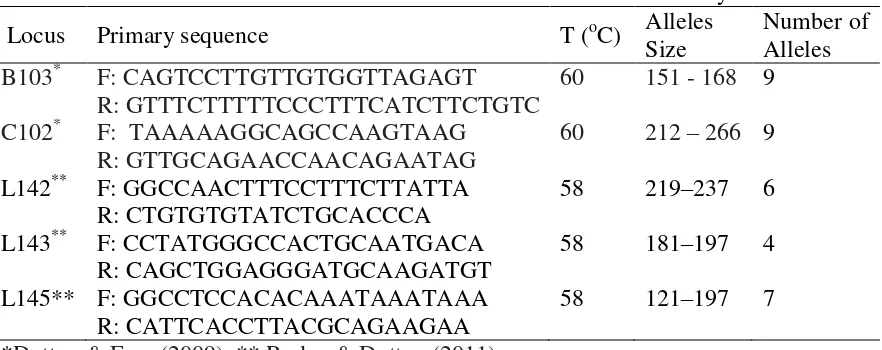
mitokondria dilakukan dengan menggunakan polymerase chain reaction (PCR). Primer yang digunakan untuk mikrosatelit adalah lokus B103, C102, L142, L143 dan L145.
Berdasarkan hasil dari 763 bp control region, kami memperoleh 4 haplotipe dari 22 variasi. Haplotipe yang ditemukan menunjukkan bahwa pola konektivitas penyu belimbing Sumatera memiliki jalur migrasi ke Samudera Hindia dan Laut Cina Selatan. Haplotipe yang ditemukan di Sumatera yang sama dengan haplotipe yang ditemukan di Papua.
Populasi di Sumatera memiliki keragaman genetik yang tinggi dibandingkan dengan Papua, namun perbedaan genetic antar populasi di Sumatera kecil. Hasil dari 5 lokus mikrosatelit menunjukkan konektivitas antara populasi penyu belimbing di Sumatera. Oleh karena itu, daerah yang menjadi lokasi penghubung spesies ini perlu diperhatikan dengan lebih baik.
Kesimpulan dari penelitian ini adalah populasi penyu belimbing di Sumatera memiliki keragaman genetik yang tinggi. Populasi penyu belimbing di Sumatera memiliki perbedaan genetik yang kecil. Pola konektivitas menunjukkan bahwa penyu belimbing Sumatera memiliki jalur ke Samudera Hindia dan Laut Cina Selatan. Lima lokus mikrosatelit (B103, C102, L142, L143 dan L145) polimorfik pada populasi penyu belimbing di Sumatera.
SUMMARY
MASLIM. Genetic Diversity and Origin of Leatherback Turtle (Dermochelys coriacea) from Sumatra. Supervised by ACHMAD FARAJALLAH and NEVIATY P. ZAMANI.
The leatherback turtle (Dermochelys coriacea) is one of seven species sea turtle in the world. Distribution of this species spread in the tropics and sub-tropics water. Foraging and nesting habitat of this species can be found in several places in Indonesia including Sumatra and Papua.
Studies of Leatherback turtles from Sumatra need to be done. We need a variety data to support the management and protection of this species, so that the management and the protection of leatherback turtles can be done better. This study aimed to analyze the genetic diversity and connectivity patterns of leatherback turtles from Sumatra using mitochondrial and microsatellite markers.
Sample of leatherback turtles ware collected from the nesting area of leatherback turtles in Panga (Aceh Jaya) and Lhoknga (Aceh Besar), northern part of Sumatra. Tissue of leatherback turtles were collected from flipper. DNA isolation used method phenol/chloroform. Amplification of control region from mitochondria was performed using Polymerase Chain Reaction (PCR). Primers for microsatellites were used loci B103, C102, L142, L143 and L145 for microsatellite.
Based on 763 bp control region in leatherback turtles, we obtained 4 haplotypes from 22 variable sites. The haplotypes showed that the connectivity patterns of Sumatran leatherback turtles have migration path to Indian Ocean and South China Sea. Haplotypes that were found in Sumatra were similar with haplotypes in Papua. Sumatra has a high genetic diversity compared to Papua, but the population in Sumatra have a little genetic differentiation. Five loci of microsatellites showed the connectivity between leatherback turtle populations from Sumatra. Therefore, the connecting location of these species need to be managed more specifically.
Sumatran leatherback turtle populations have high genetic diversity. Leatherback turtle populations from Sumatra have little genetic differentiation. The connectivity pattern showed that Sumatran leatherback turtles have the pathway to the Indian Ocean and South China Sea. Five microsatellite loci (B103, C102, L142, L143 and L145) were polymorphic in leatherback turtle populations from Sumatra.
Copyright @ 2016, Bogor Agricultural University
Copyright are protected by law
It is prohibited to cite all or part of this thesis without referring to and mentioning the source; Citation only permitted for the sake of education, research, scientific writing, report writing, critical writing, or reviewing scientific problems. Citation does not inflict the name and honor of Bogor Agricultural University.
Thesis
as one of the requirements for achieving Master of Science degree in Animal Bioscience Program
GENETIC DIVERSITY AND ORIGIN OF LEATHERBACK
TURTLE (
Dermochelys coriacea
) FROM SUMATRA
GRADUATE SCHOOL
BOGOR AGRICULTURAL UNIVERSITY BOGOR
PREFACE
Praise and gratitude to Allah SWT for all of his gifts so that the scientific work was successfully completed. The theme chosen in this study is to collect data related to the population of leatherback turtles in Sumatra.
The author wants to thank Dr. Ir Ahmad Farajallah, MSi and Dr. Neviaty P. Zamani, MSc as supervisor, as well as lecturers of Animal Biosciences Program. Thank you to all students of BSH 2014, the staff of Molecular Laboratory of Biology Department and all members of zoocorner who always give support. The author thank Aceh Government which has gave scholarship during study. In addition, the authors convey appreciation to Panga and Lhoknga sea turtle team, who has helped during data collection. Expressions of thanks are also extended to father, mother, and the whole family, for all the prayers and affection. Hopefully this thesis could be useful.
Bogor, March 2016
v
LEATHERBACK TURTLE (Dermochelys coriacea) POPULATIONS FROM
SUMATRA: GENETIC DIVERSITY AND CONNECTIVITY PATTERN 3
Introduction 3
Materials and Method 3
Results 4
Discussion 7
Conclusion 9
POLYMORPHISMS OF FIVE MICROSATELLITES LOCI ON LEATHERBACK
TURTLES (Dermochelys coriacea) FROM SUMATRA 10
LIST OF TABLES
2.1 Variable sites of 4 haplotypes based on sequence (763) of mtDNA Control
Region in Sumatran leatherback turtle populations 5
2.2 Genetic diversity of Sumatran leatherback turtle populations 5
2.3 Haplotype frequencies, haplotype (h) and nucleotide (π) diversities 6
3.14Characteristics of five microsatellites loci were used in this study 11
3.25Genotype frequencies (%) of Loci B103, C102, L142, L143 and L145 12
3.36Alleles Frequencies of population in Panga 12
3.47Alleles Frequencies of population in Lhoknga 12
3.58Estimates of heterozygosities for five polymorphic loci 13
LIST OF FIGURES
2.1 Sampling location in Sumatra 4
2.2 Model of connectivity pattern of leatherback turtle in Indonesia 8
2.3 Distribution of leatherback turtle haplotypes around the word using MJ network 8
LIST OF APPENDICES
1. Haplotypes of leatherback turtle from Sumatra 21
1
GENERAL INTRODUCTION
Background
The leatherback turtle (Dermochelys coriacea) is one of seven sea turtle in the world. Distribution of this species spread in the tropics and sub-tropics water (Vargas
et al. 2008). Foraging and nesting habitat of this species can be found in several places in Indonesia. Some coastal areas in Indonesia are as the nesting habitat of this species. Papua and Sumatra are the center of nesting habitat of this spesies in Indonesia. The studies of leatherback turtles in Papua can be found in many subject. Instead, Sumatra as one habitat of this species has no data. This is due to the lack of research conducted at this location.
As one of the leatherback turtle habitat, Sumatra has an immense potential to be explored in deeper. It is essential to execute a study about leatherback turtle in Sumatra, so that the protection management could be developed. The decline in the population of leatherback turtles occurs constantly, demanding the protection of this species needs to be improved. Therefore, we need a variety data to support the protection management of this species.
Mitochondrial DNA (mtDNA) and Microsatellite markers have been used as a genetic markers on many animals including leatherback turtle. These tool are powerfull to identify the phylogeography and connectivity of leatherback turtles. Genetic studies of the leatherback turtles and genetic assessment of the stock population on a global scale showed that the group that lodged separately are an independent population maternally (Limpus 2009).
Many Studies of leatherback turtle were using genetic markers, such as the genetic diversity of the leatherback turtle populations in the Pacific (the East Pacific (Mexico and Costa Rica), the Western Pacific (Dutton et al. 1999, 2007 and 2013), Indian Ocean (Andaman and Nicobar Islands) (Phillott and Gamage 2014). However, there is still no data from Sumatra. IUCN Red List 2013 (Wallace et al. 2013) puts populations in Sumatra in a category of data deficient. Study of leatherback turtles leatherback turtle populations from Sumatra using mitochondrial DNA.
2. To Determine polymorphisms of five microsatellites loci on leatherback turtles (Dermochelys coriacea) from sumatra
Advantages
2. Policies for the protection of leatherback turtles in Indonesia
3
LEATHERBACK TURTLE (Dermochelys coriacea) POPULATIONS FROM
SUMATRA: GENETIC DIVERSITY AND CONNECTIVITY PATTERN
Introduction
Leatherback turtle (Dermochelys coriacea) is a turtle species that can be found in the tropics and sub-tropics, including areas within Indonesian archipelago. Leatherback turtle populations in Indonesia are divided into two sub-populations, sub-populations of Papua (Western Pacific) and sub-populations of Sumatra (Northeast Indian Ocean) (Wallace et al. 2013). Sub-populations of Papua have nesting habitat centralized in Jamurba-Medi and Warmon beach (Hitipeuw et al.
2007). The movement of leatherback turtles in this area was reaching to the North America region (Benson et al. 2007). There is no report about populations of leatherback turtle in Sumatra, only some places in Indian Ocean (Nicobar island, Sri Lanka and South Africa) (Bowen and Karl 2007).
Indonesia is an area that is flanked by two oceans (DeBoer et al. 2008). Indonesia’s water has a chance as an interaction place of two leatherback turtle populations (West Pacific and Indian Ocean) (Bowen et al. 1998). The connectivity of these populations, migration path and interaction areas of these populations are important to be studied (Avise 2009). It requires further verification by analysing two populations of leatherback turtles in Indonesia (Sumatra and Papua), but data populations of Sumatra was unavailable, it needs more studies.
Studies about genetic diversity that have been performed in leatherback turtle are global phylogeography of leatherback turtle (Dutton et al. 1999), phylopatric (Stewart and Dutton 2011) and natal homing (Prosdocimi et al. 2014). All of these studies were performed in Atlantic, (Dutton et al. 2013), Pacific (Dutton et al. 2007), and Indian ocean (Phillott and Gamage 2014). IUCN Red List 2013 (Wallace et al.
2013) puts the sub-populations of Sumatra into data deficient category. Sub-populations of Sumatra require exploration to obtain adequate data. This study aims to determine the genetic diversity and analyse connectivity pattern of leatherback turtle populations from Sumatra using mitochondrial DNA.
Materials and Method
Sample Collection
Figure 2.1 Sampling location in Sumatra
DNA Isolation and Amplification
DNA isolation was using standard phenol/chloroform by modifying the method of Sambrook et al. (1989). DNA amplification was performed using Polymerase
chain reaction (PCR). Primers used are LCM15382
(5'GCTTAACCCTAAAGCATTGG-3') (forward) and H950g
(5'GTCTCGGATTTAGGGGTTTG-3 ') (reverse) to amplify 832 base pairs (bp) fragment of mtDNA control region (Abreu-Grobois et al. 2006). PCR reaction was performed at 25 µL using Gotaq Green Mix Master. PCR consists of initial denaturation 94 ºC for 5 min; 35 cycles of 94 ºC for 30 seconds (denaturation), 58 ºC for 30 seconds (annealing), and 72 ºC for 60 seconds (extension), and final extension 72 ºC for 9 min. The amplicons showed a single band on polyacrylamide gel were sequenced using previous primers.
Data Analysis
Alignment was conducted using Mega v 5.1 (Tamura et al. 2011). Arlequin 3.5 was used to calculate the haplotype diversity (h) and nucleotide diversity (π) (Excoffier and Lischer 2010). Superimposed of phylogeny tree to the geography map used Network 4.6.1.3 (http: // www.Fluxus-engineering.com).
Results
5
Table 2.1 Variable sites of 4 haplotypes based on sequence (763) of mtDNA Control Region in Sumatran leatherback turtle populations
Haplotypes
Variable Sites
053 092 093 115 157 168 199 203 212 292 312 430 537 588 616 673 720 721 725 738 739 741
Dc1.1 A C C A A A A A G A T T C A A G A C A A C C
Dc4.1 . . . G . A G . . . . G . . . .
Dc4.2* . . . G . A G G G T C G A . . G . . .
Dc4.3* T A A T G C G G A G . . . . G . T T . T G T
*New
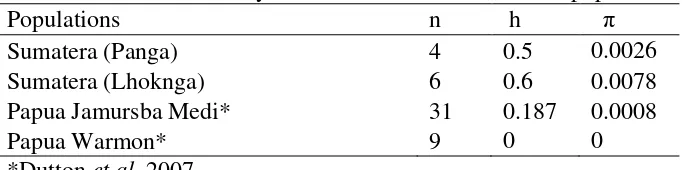
The highest value of haplotypes and nucleotides diversity found in the Sumatra populations was Lhoknga h = 0.6 and π = 0.0078 followed by Panga h = 0.5 and π = 0.0026 (Table 2.2). Papua populations (Jamursba Medi and Warmon) have a low diversity (h = 0.187and π = 0.0008).
Table 2.2 Genetic diversity of Sumatran leatherback turtle populations
Populations n h π
Sumatera (Panga) 4 0.5 0.0026
Sumatera (Lhoknga) 6 0.6 0.0078
Papua Jamursba Medi* 31 0.187 0.0008
Papua Warmon* 9 0 0
6
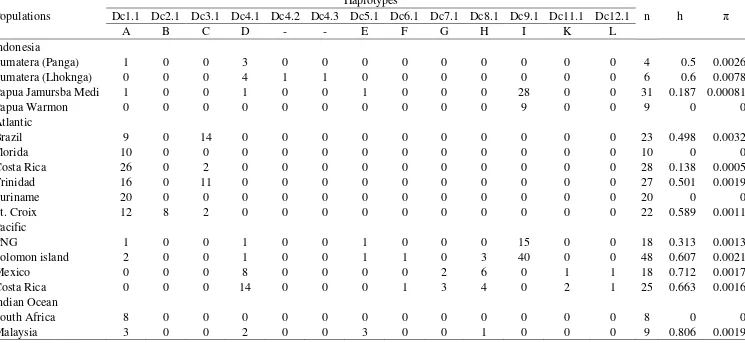
Table 2.3 Haplotype frequencies, haplotype (h) and nucleotide (π) diversities for Dermochelys coriacea populations using 763 bp from Indonesian Populations compared with other worldwide populations (Dutton et al. 1999 and 2007)
Populations
Haplotypes
n h π
Dc1.1 Dc2.1 Dc3.1 Dc4.1 Dc4.2 Dc4.3 Dc5.1 Dc6.1 Dc7.1 Dc8.1 Dc9.1 Dc11.1 Dc12.1
A B C D - - E F G H I K L
Indonesia
Sumatera (Panga) 1 0 0 3 0 0 0 0 0 0 0 0 0 4 0.5 0.0026
Sumatera (Lhoknga) 0 0 0 4 1 1 0 0 0 0 0 0 0 6 0.6 0.0078
Papua Jamursba Medi 1 0 0 1 0 0 1 0 0 0 28 0 0 31 0.187 0.00081
Papua Warmon 0 0 0 0 0 0 0 0 0 0 9 0 0 9 0 0
Atlantic
Brazil 9 0 14 0 0 0 0 0 0 0 0 0 0 23 0.498 0.0032
Florida 10 0 0 0 0 0 0 0 0 0 0 0 0 10 0 0
Costa Rica 26 0 2 0 0 0 0 0 0 0 0 0 0 28 0.138 0.0005
Trinidad 16 0 11 0 0 0 0 0 0 0 0 0 0 27 0.501 0.0019
Suriname 20 0 0 0 0 0 0 0 0 0 0 0 0 20 0 0
St. Croix 12 8 2 0 0 0 0 0 0 0 0 0 0 22 0.589 0.0011
Pacific
PNG 1 0 0 1 0 0 1 0 0 0 15 0 0 18 0.313 0.0013
Solomon island 2 0 0 1 0 0 1 1 0 3 40 0 0 48 0.607 0.0021
Mexico 0 0 0 8 0 0 0 0 2 6 0 1 1 18 0.712 0.0017
Costa Rica 0 0 0 14 0 0 0 1 3 4 0 2 1 25 0.663 0.0016
Indian Ocean
South Africa 8 0 0 0 0 0 0 0 0 0 0 0 0 8 0 0
7
Discussion
Genetic Diversity
Relativel high genetic diversity was found in Sumatra. These findings support several previous studies that showed the genetic diversity of leatherback turtles from Indian Ocean were higher than Pacific region (Dutton et al. 1999, and 2007). However, despite having a high genetic diversity, the number of populations in the Indian Ocean region, particularly Sumatra, are smaller than the Pacific region (Wallace et al. 2013).
Nucleotide and haplotype diversity that is found in Sumatra indicate that the population of leatherback turtles in the region still connect with populations from other regions. The genetic assessment of leatherback turtles from Atlantic showed different results (Rivalan et al. 2006 and Prosdocimi et al. 2014). It supports the division of the leatherback turtles region which show that the populations in the Pacific region and the Indian ocean still can not be separated (Dutton et al. 1999, 2007 and 2013).
Genetic Connectivity of Sumatran Leatherback Turtle
The haplotypes show that the connectivity patterns of Sumatran leatherback turtles (Figure 2.2) have migration path to Indian Ocean and South China Sea. Haplotypes that were found in Sumatra were similar with haplotypes in Papua. This indicates that there is connectivity between leatherback turtles form Sumatra and Papua. This model was related with the phylogeography and genetic connectivity of boring giant clam (DeBoer et al. 2008), co-distributed stomatopods (Barber et al.
2006), and giant mottled eel (Ishikawa et al. 2004) in the Pacific and Indian Ocean. South China Sea is the connecting location between Sumatra and Papua leatherback turtles. The connectivity pattern of Sumatran leatherback turtles was supported by the leatherback nesting beach that found in Terengganu (Malaysia). The migration path of leatherback turtles nesting in Papua also showed the movement to the North Pacific region and the South China Sea (Bailey et al. 2012). The availability of jellyfish in Malacca Strait and South China Sea (Omori and Nakano 2001) and ocean flow were also important factors for the movement of leatherbacks turtles. In addition, some public report that leatherback turtles were captured in the Malacca Strait area.
Figure 2.2 Model of connectivity pattern of leatherback turtle in Indonesia
Origin of Indonesian Leatherback Turtle
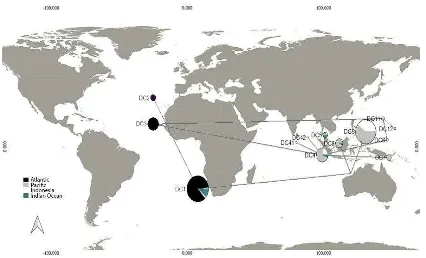
Figure 2.3 Distribution of leatherback turtle haplotypes around the word using Median Joining network.
9
Haplotypes diversity that were found in Indonesia were similar with Pacific and the Indian Ocean. It shows the origin of the leatherback turtle populations in Indonesia came from Indian Ocean and the Pacific region.
Based on the median joining network, Dc4.1 haplotype is the origin of haplotypes in the world (Table 2.3). Figure 2.3 shows haplotypes that were found in Atlantic came from Pacific-Indian haplotype. It shows that leatherback turtles in the world comes from the Pacific-Indian Ocean region. Then the distribution spread to the Atlantic, before finally separated genetically.
Conclusion
POLYMORPHISMS OF FIVE MICROSATELLITES LOCI ON
LEATHERBACK TURTLES (Dermochelys coriacea) FROM SUMATRA
Introduction
Leatherback turtle (Dermochelys coriacea) is the species with widespread distribution in the world (Vargas et al. 2008), migration path to tropical or subtropical beaches for nesting (Rivalan et al. 2006). Foraging and nesting habitat of this species can be found in several places in Indonesia. One of the nesting habitats of this species is in Sumatra (Sarong and Maslim 2013). Leatherback turtle is a pelagic species, it is able to migrate extensively (> 5000 km) between tropical nesting habitats and cold foraging habitats. Wide distribution and high capacity of migration also caused interaction with the other species such as pelagic marine fish and marine mammals (Dutton et al. 1999).
Study of intraspecific genetic variation using molecular markers was useful to analyse the structure of populations and phylogeography of sea turtle. Mitochondrial DNA has been used to identify the composition of origin, stock populations and conclude the migration path in sea turtle (Prosdocimi et al. 2014). DNA microsatellite was useful in analysing the structure of the populations in many organisms. Study of polyandry in green turtles in West Java (Purnama et al. 2013), multiple paternity in leatherback turtles in the Virgin Islands (Stewart and Dutton 2011) and analysing the structure of the populations of leatherbacks in Atlantic (Dutton et al. 2013) are few studies that used DNA microsatellite marker.
Information regarding the existence of leatherback turtle populations in Sumatra are unavailable. IUCN Red List 2013 puts leatherback turtle populations in Sumatra into the data deficient (Wallace et al. 2013). Therefore, it requires a lot of studies related to the leatherback turtle populations in Sumatra, specially using microsatellite marker. Data can be used as a basic information in making policy management and protection of leatherback turtles in Sumatra. The aim of this study is to determine polymorphisms of five microsatellite loci on leatherback turtles (Dermochelys coriacea) in sumatra.
Materials and Method
Sample Collection
Sample of leatherback turtles were collected from the nesting area of leatherback turtle in Panga (Aceh Jaya) and Lhoknga (Aceh Besar). Tissue of leatherback turtles were collected from flipper (Dutton and Stewart 2013). Fourteen samples from Panga and Lhoknga were collected and preserved in absolute alcohol.
DNA Isolation and Amplification
11
Mix Master. PCR consist of initial denaturation 94 ºC for 5 min; 30 cycles of 94 ºC for 30 seconds (denaturation) , 60 ºC for 90 seconds (annealing), and 68 ºC for 120 seconds (extension); and final extension 72 ºC for 5 min.
PCR product performed by polyacrylamide gel electrophoresis (PAGE) 8%, (Byun et al. 2009). DNA bands were scored based on the migrating rate of DNA bands. Allele a was identified as the fastest allele (Appendix 2).
Table 3.14Characteristics of five microsatellites loci were used in this study
Locus Primary sequence T (oC) Alleles
Allele polymorphism, gene diversity and allele frequency were detected using
Nei’s formula (1987). Population structure of leatherback turtle was showed through
gene diversity in the total population (HT), within subpopulations (HS), between
subpopulations (DST), and gene differentiation among subpopulations (GST). Analysis
of fixation index used PopGen32 (Yeh et al. 1999).
Results
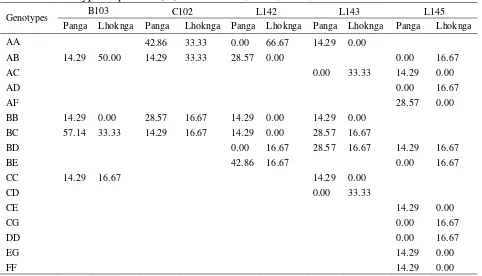
Table 3.25Genotype frequencies (%) of Loci B103, C102, L142, L143 and L145
Genotypes B103 C102 L142 L143 L145
Panga Lhoknga Panga Lhoknga Panga Lhoknga Panga Lhoknga Panga Lhoknga
AA 42.86 33.33 0.00 66.67 14.29 0.00
Table 3.36Alleles frequencies of population in Panga
Allele B103 C102 L142 L143 L145
Table 3.47Alleles Frequencies of population in Lhoknga
Allele B103 C102 L142 L143 L145
13
found in one of the leatherback turtle populations were observed. Allele f on the locus L145 was only found in Panga. It shows the difference in the distribution of allele f in both populations.
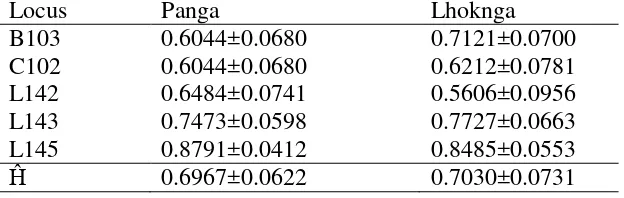
Table 3.58Estimates of heterozygosities of five polymorphic loci for populations of Leatherback turtles from Sumatra
Heterozygosity values in both populations were observed, are generally quite high (Table 3.5). The average value of heterozygosity (Ĥ) of Panga is 0.6967, and Lhoknga is 0.7030 . Based on the average value of heterozygosity (Ĥ) of the five loci showed both populations have high allele diversity (H> 0.60). However Lhoknga population has a high allele diversity when compared with the Panga population.
Genetic differentiation aims to examine the genetic diversity within and between subpopulation (Nei, 1987). Genetic differentiation was obtained by calculating the average diversity in subpopulation (HS), genetic diversity in the
population total (HT) and genetic diversity among subpopulations (DST). The results
show the value of genetic diversity populations total (HT) is 0.9653, the average
diversity in subpopulation (HS) is 0.8786, genetic diversity among subpopulations
(DST) is 0.0867, and coefficient of genetic differentiation (GST) is 0.0898. Small
genetic differentiation (8%) in both populations showed that the genetic differentiation of leatherback turtle populations from Sumatra (Panga and Lhoknga) is low. Fixation index (FIS, FST, FIT) was used to determine the breeding and the
The diversity of alleles from two populations of leatherback turtles in Sumatra showed a high scores. It can be seen from the value of heterozygosity in both populations was greater than 0.6 (H> 0.60). The diversity that obtained indicate that these populations need special attention on the protection of this species. Genetic conservation needs to be done in a population of leatherback turtles from Sumatra. Results of studies that have been done on some marine species. Species that have a high genetic diversity, had a chance for the occurrence of genetic isolation (Hoffman et al. 2009).
genetic connectivity. Although being on different nesting sites, the low value of genetic differentiation can be interpreted that both of these populations still have a relationship. Therefore, it is necessary to conduct further study, related path connectivity of these populations to reduce the potential for bycatch by fishermen in the region. This study is also useful to execute how far away the migration location of leatherback turtles from Sumatra.
Benson et al. (2007) showed the movements of leatherback turtles from Jamursba Medi Papua to the northern America. This indicated that the distance of migration locations, increasing their chances to connect with other leatherback turtles from other locations. It can cause the genetic mixture between populations. The high genetic diversity and low genetic differentiation, indicated that there is connectivity among leatherback turtle populations from Sumatra. It can be assumed that leatherback turtles from Sumatra have the same migration path. It is necessary to conduct further study to prove it.
Polymorphism
Based on the 5 microsatellite loci, it is showed that all loci are polymorphism on leatherback turtles in Sumatra. Although the two loci (B103 and C102) has been tested on a green turtle (Dutton and Frey 2009), but these loci also showed polymorphism on leatherback turtles. It is showed that some of the microsatellites marker can still be used on other sea turtle species.
The highest allele was obtained on the locus L145 (7 alleles), and lowest one was on the loci B103 and C102 (3 alleles). The number of alleles that obtained on the locus L145 in accordance with the results of Rodden and Dutton (2012). However, on the loci B103 and C102 were only found three alleles, it was different with Dutton and Frey (2009). Their results gained 9 alleles on these loci. It was caused their research conducted on green turtles, while on leatherback turtles only gained 3 alleles.
The sharing of alleles showed the presence of genetic connectivity between the two populations. Although some alleles at 5 loci were not shared, but in general, alleles that were found in leatherback turtles from Sumatra were shared alleles. This supports previous results that show the low value of genetic differentiation on leatherback turtles from Sumatra. Despite having a high allelic diversity, but the number of each shared alleles in both populations showed a genetic flow in both populations.
Genetic Differentiation
The genetic structure of the leatherback turtle populations from Sumatra can be seen from the genetic differentiation and fixation index (Nei, 1987). The value of genetic differentiation between populations (Gst) obtained is low (0.0898), whereas based on the fixation index was known that in each subpopulation were crossbred (FIS
= 0.0168), also occurs interbreed in all populations (FIT = 0.1052), and between
subpopulations (FST = 0.0898). The low value of FST is proportional to genetic
differentiation. The value of FST indicates little genetic differentiations (0 - 0.05)
15
the data of female leatherback turtles, can be used as one of the data to analyse the population structure of leatherback turtles.
The use of microsatellites as genetic markers to analyse population structure is useful. Microsatellite markers have also been used in analysing polyandry in population of Chelonia mydas (Purnama et al. 2013), multiple paternity in Dermochelys coriacea (Stewart and Dutton 2011), multiple paternity in Lepidochelys olivacea (Hoekert et al. 2002), effective population size in Natator depressus (Theissinger et al. 2009), and genetic structure in Carreta carreta (Carreras et al.
2007). Therefore, genetic differences in the two populations in Sumatra are low. This is also evidenced by Dutton et al. (2013) showed genetic differences between populations of leatherback turtles from Atlantic that close each other are still low
Conclusion
GENERAL DISCUSSION
Leatherback turtle populations in the world have a strong structure (Dutton et al. 1999). Although this species has a wide range, but genetically the structure of the population of leatherback turtles can be identified based on breeding territory. The structure of the leatherback turtle populations divided into two major regions, Atlantic and Pacific-Indian (Bowen and Karl 2007). The identity of Indonesia leatherback turtle proves that Pacific-Indian region was inseparable as well as the ranges of these species.
Molecular approaches in analysing the spread of leatherback turtles are indispensable (Lee 2008). The results of genetic identification has been studied by Dutton et al. (1999, 2007, 2013), Molfetti et al. (2013), Prosdocimi et al. (2014), Phillott and Gamage (2014) showed the haplotypes diversity of leatherback turtles in the world. All of the studies showed that phylogeogrraphy of leatherback turtle has a genetic identity related to their nesting habitat.
The use of microsatellites as genetic markers to analyse population structure is useful. Microsatellite markers have been used in analysing polyandry in population of
Chelonia mydas (Purnama et al. 2013), multiple paternity in Dermochelys coriacea
(Stewart and Dutton 2011), multiple paternity in Lepidochelys olivacea (Hoekert et al. 2002), effective population size in Natator depressus (Theissinger et al. 2009), and genetic structure in Carreta carreta (Carreras et al. 2007). Therefore, genetic differences in the two populations in Sumatra are low. This is also evidenced by Dutton et al. (2013) showed genetic differences between populations of leatherback turtles adjacent to the Atlantic are still low.
Although Sumatra has a high genetic diversity compared with Papua, but the population in Sumatra have little genetic differences between the populations. This indicates the connectivity between populations of leatherback turtles in Sumatra. Therefore, the areas that are as the connecting place of these species need to be considered more specifically. The areas, as a fishing ground area, need to be disseminated to the fishermen to be more careful in the fish capturing in the connecting path of leatherbacks.
17
CONLUSION
Sumatran leatherback turtle populations have higher genetic diversity than Papua populations. The connectivity pattern showed that Sumatran leatherback turtles have the pathway to the Indian Ocean and South China Sea. South China Sea, as the connecting location, is important place for leatherback turtles from Sumatra and Papua. Five microsatellite loci (B103, C102, L142, L143 and L145) were polymorphic in leatherback turtle populations in Sumatra. Leatherback turtle populations in Sumatra have little genetic differentiations.
RECOMMENDATION
REFERENCES
Abreu-Grobois FA, Horrocks JA, Formia A, Dutton PH, LeRoux RA, Velez-Zuazo X, Soares L, Meylan AB. 2006. New mtDNA D-loop primers which work for a variety of marine turtle species may increase the resolution of mixed stock analysis. In: Frick M, Panagopoulous A, Rees AF, Williams K editors.
Proceedings of the 26th annual symposium on sea turtle biology. Myrtle Beach, USA. South Carolidan (USA): NOAA, p 179.
Avise JC. 2009. Phylogeography: retrospect and prospect. J Biogeogr. 36: 3–15. doi:10.1111/j.1365-2699.2008.02032.x.
Bailey H, Benson SR, Shillinger GL, Bograd SJ, Dutton PH, Eckert SA, Morreale SJ, Paladino FV, Eguchi T, Foley DG, Block BA, Piedra R, Hitipeuw C, Tapilatu RF, Spotila JR. 2012. Identification of distinct movement patterns in Pacific leatherback turtle populations influenced by ocean conditions. Ecol Appl. 22(3): 735–747.
Barber PH, Erdmann MV, Palumbi SR. 2006. Comparative phylogeography of three codistributed stomatopods: origins and timing of regional lineage diversification in the coral triangle. Evolution. 60(9): 1825–1839.
Benson SR, Dutton PH, Hitipeuw C, Sember B, Bakarsbessy J, Parker D. 2007. Post-Nesting migrations of leatherback turtles (Dermochelys coriacea) from Jamursba-Medi, Bird’s Head Peninsula, Indonesia. Chelonian Conserv Biol 6(1): 150–154.
Bowen BW, Clark AM, Abreu-Grobois FA, Chaves A, Reichart HA, Ferl RJ. 1998. Global phylogeography of the ridley sea turtles (Lepidochelys spp.) as Inferred from mitochondrial DNA sequences. Genetica. 179–189.
Bowen BW, Karl SA. 2007. Population genetics and phylogeography of sea turtles.
Mol Ecol. (16): 4886–4907.
Byun SO, Fang Q, Zhou H, Hickford JGH. 2009. An effective method for silver-staining DNA in large numbers of polyacrylamide gels. Anal Biochem. 385:174-175.
Carreras C, Pascual M, Cardona L, Aguilar A, Margaritoulis D, Rees A, Turkozan O, Levy Y, Gasith A, Aureggi M, and Khalil M. 2007. The genetic structure of the loggerhead sea turtle (Caretta caretta) in the Mediterranean as revealed by nuclear and mitochondrial DNA and its conservation Implications. Conserv Genet. 8:761–775. DOI 10.1007/s10592-006-9224-8.
DeBoer TS, Subia MT, Ambariyanto, Erdmann MV, Kovitvongsa K, Barber. 2008. Phylogeography and limited genetic connectivity in the endangered Boring Giant Clam across the coral triangle. Conserv Biol. 22(5): 1255–1266.
Dutton PH, Frey A. 2009. Permanent genetic resources note. characterization of polymorphic microsatellite markers for the green turtle (Chelonia mydas). Mol Ecol 9:354-356. DOI 10.1111/j.1755-0998.2008.02443.x.
Dutton PH, Bowen BW, Owens DW, Barragan A, Davis SK. 1999. Global phylogeography of leatherback turtle (Dermochelys coriacea). J Zool Lond. 248: 397-09.
19
leatherback turtles (Dermochelys coriacea) in the Western Pacific. Chelonian Conserv Biol 6(1): 47–53.
Dutton PH, Roden SE, Stewart KR, LaCasella E, Tiwari M, Formia A, Thome TC, Livingstone SR, Eckert S, Chacon-Chaverri D et al. 2013. Population stock structure of leatherback turtles (Dermochelys coriacea) in the atlantic revealed using mtDNA and microsatellite markers. Conserv Genet. DOI 10.1007/s10592-013-0456.
Dutton PH, Stewart KR. 2013. A method for sampling hatchling sea turtles for the development of a genetic tag. MTN. 138: 3-7.
Excoffier L, Lischer HEL. 2010. Arlequin suite ver. 3.5: a new series of programs to perform population genetics analyses under Linux and Windows. Mol Ecol Resour. 10:564–567.
Hitipeuw C, Dutton PH, Benson SR, Thebu J, Bakarsbessy J. 2007. Population status and internesting movement of leatherback turtles, Dermochelys coriacea, nesting on the Northwest Coast of Papua, Indonesia. Chelonian Conserv Biol. 6(1): 28– 36.
Hoekert WEJ, Neufe´glise H, Schouten AD, Menken SBJ. 2002. Multiple paternity and female-biased mutation at a microsatellite locus in the olive ridley sea turtle (Lepidochelys olivacea). Heredity 89:107–113.
Hoffman JI, Dasmahapatra KK, Amos W, Phillips CD, Gelatt TS, Bickham JW. 2009. Contrasting patterns of genetic diversity at three different genetic
markers in a marine mammal metapopulation. Mol Ecol. DOI:
10.1111/j.1365-294X.2009.04246.x.
Ishikawa S, Tsukamoto K, Nishida M. 2004. Genetic Evidence for multiple geographic populations of the Giant Mottled Eel Anguilla marmorata in The Pacific and Indian Oceans. Ichthyol Res. 51: 343–353.
Lee PLM. 2008. Molecular Ecology of marine turtles: New approaches and future fine-scale structure in the Northwest Atlantic Leatherback (Dermochelys coriacea) turtle population. Plos One. 8(3): 1-11.
Nei M. 1987. Molecular Evolutionary Genetics. New York (USA): Columbia University Press.
Omori M, Nakano E. 2001. Jellyfish fisheries in Southeast Asia. Hydrobiologia. 451: 19–26.
Phillott AD, Gamage RNN. 2014. A Summary of sea turtle genetic studies in The Indian Ocean and Southeast. IOTN. 20: 19-35.
Prosdocimi L, Dutton PH, Albareda D, Remis MI. 2014. Origin and genetic diversity of leatherbacks (Dermochelys coriacea) at argentine foraging grounds. J Exp Mar Bio Ecol. 458:13–19.
Roden SR, Dutton PH. 2011. Isolation and characterization of 14 polymorphic microsatellite loci in the leatherback turtle (Dermochelys coriacea) and
crossspecies Amplification. Conserv Genet. 3:49–52. DOI 10.1007/s12686-010-9284-4.
Sambrook J, Fritsch EF, Maniatis T. 1989. Molecular Cloning a Laboratory Manual.
New York (USA): Cold Spring Harbor Laboratory Pr.
Sarong MA, Maslim. 2013. Daya tetas telur penyu belimbing (Dermochelys coriacea) hasil pemasaran masyarakat di kawasan Pantai Lampuuk Kecamatan Lhoknga Kabupaten Aceh Besar. Jurnal Biotik 1(1): 1-5.
Shrive JF, Hurlburt HE.1997. The Contribution of the global thermohaline circulation to The Pacific to Indian Ocean throughflow via Indonesia. J Geophys Res Atmos.
102: 5491-5511.
Stewart KR, Dutton PH. 2011. Paternal genotype reconstruction reveals multiple paternity and sex ratios in a breeding population of leatherback turtles (Dermochelys coriacea). Conserv Genet. 12:1101–1113. DOI 10.1007/s10592-011-0212-2.
Tamura K, Peterson D, Peterson N, Stecher G, Nei M, Kumar S. 2011. MEGA5: Molecular Evolutionary Genetics Analysis using Maximum Likelihood, Evolutionary Distance, and Maximum Parsimony methods. Mol Biol Evol. 28 (10):2731–2739.
Theissinger K, FitzSimmons NN, Limpus CJ, Parmenter CJ, Phillott AD. 2009. Mating system, multiple paternity and effective population size in the endemic flatback turtle (Natator depressus) in Australia. Conserv Genet. 10:329–346. DOI 10.1007/s10592-008-9583-4.
Vargas SM, Auraujo FCF, Monteiro DS, Estima SC, Almaida AP, Soares LS, Santos FR. 2008. Genetic diversity and origin of leatherback turtles (Dermochelys coriacea) from the Brazilian Coast. J Hered. 99(2):215–220. doi:10.1093/jhered/esm120.
Wallace BP, Tiwari M, Girondot M. 2013. Dermochelys coriacea. The IUCN Red List of threatened species, http://www.iucnredlist.org. [Retrieved on 28 February 2015].
21
APPENDICES
(a)
(b)
(c)
(d)
(e)
23
BIOGRAPHY
The author was born in Rimo on September 23rd, 1991 as a first son from Misno and Salbiah. The author obtained a bachelor's degree education (S.Pd) from the Department of Biology Education, Faculty of Teacher Training and Education, University of Syiah Kuala in 2013. Afterwards, authors continued to Master of Science in Animal Bioscience Program, Graduate School of Bogor Agricultural University in 2014.
During the study the authors obtained a scholarship from Aceh government through LPSDM Aceh. The author was a member of Himpunan Mahasiswa Muslim Pascasarjana (HIMMPAS) IPB as head of entrepreneurship department in 2014.