TELKQMNIKA
..
TELKOMNIKA Indonesian Journal of Electrical Engineering Vol. 12. No. 8, August 2014, pp. 6205 - 6210
DOI: 10.11591/telkomnika.v12i8.6194 • 6205
Similarity Measurement for Speaker Identification
Using Frequency of Vector Pairs
lnggih Permana•1
, Agus Buono2, Bib Paruhum Silalahl3
1.2oepartment of Computer Science, Faculty of Mathematics and Natural Sciences, Bogor Agrlcultufal University, Bogor 16680, Indonesia
3Department of Mathematic, Faculty of Mathematics and Natural Sciences,
Bogor Agricultural University, Bogor 16680, Indonesia •corresponding author, e-mail: inggih.pennana1 [email protected]
bibparuhum [email protected]
Abstract
Similarity measurement is an important part of speaker Identification. This study has modified the similarity measurement technique performed in previous studies. Previous studies used the sum of the smallest distance between the input vectors and the codebook vectors of a particular speaker. In this study, the technique has been modified by selecting a particular speaker codebook which hes the highest frequency of vector pairs. Vector pair in this case is the smallest distance between the input vector and the vector in the codebook. This study used Mel Frequency Cepstral Coefficient (MFCC) es feature extraction, Self Organizing Map (SOM) as codebook maker and Euclidean as a measure of distance. The experimental results showed that the similarity measuring techniques proposed can improve the accuracy of speaker Identification. In the MFCC coefficients 13, 15 and 20 the average accuracy of identification respec;tively increased BS much BS 0.61%, 0.98% and 1.27%.
Keywords: frequency of vector pairs, MFCC, similarity measurement, SOM, speaker identification
Copyright© 2014 Institute of Advanced Engineering and Science. Alf rights reserved.
1.
IntroductionSpeaker identification is part of the sound processing that aims to find out who is talking. Speaker identification is necessary because the human ability to recognize human speech is very limited, especially with so much diversity among human voice. Therefore, the speal<er identification system is needed and widely applied in real life. One important application of speaker identification is in the field of forensics [1 ), for example identifying who Is speaking on a recorded phone call that will be used as evidence in a court case. In daily life, speaker identification is also very important, such as access control to telephone banking, shopping, opening a personal computer and so
forth.
Speaker identification has two main parts, namely the feature extraction and similarity measurement. This study has modified the similarity measurement technique performed in previous studies. In previous studies [2, 3) similarity measurements have been performed by using sum of the smallest distance between the input vector and the codebook vector of a particular speaker. Codebook is voice prints produced through a training (3]. The sum result of the most minimally defined as speakers representing the inputted voice. In this study, the technique was modified by means of selecting a particular speaker codebook that has the highest frequency of occurrence of vector pairs with input vectors as speakers representing the inputted voice. Vector pair is the smallest distance between the input vectors with one of the vectors that exist in the entire codebook. Distance measurement method used in this study is
Euclidean.
-Feature extraction method used in this study is (Ylel lrequency cepstral coefficient (MFCC). MFCC is often used because it is considered a 「・セ@ ー・イヲッイュセ@ than other methods, such as in terms of error rate reduction. The workin s f MFCC is ased on the frequency difference can be captured by the human ear so
エィ。セ@
can repret
how peoplereceive sound signals [4). •
6206 •
ISSN: 2302-4046method may not be able to do so. Its ability to handle data of high dimension which is the consideration for choosing this method to generate codebook.
Data
results from MFCC might produce a high-dimensional, depending on how many coefficients are determined at the MFCC.Speaker identification based on the words spoken divided into two, namely the text-dependent and text-intext-dependent
[6).
Dependent-text is the introduction of the speaker uttered the words fixed. While text-independent speaker recognition which are not determined what the word should be pronounced. This study will focus on identifying the speaker in text-independent.2. Research Method 2.1. Rroposed Techniques
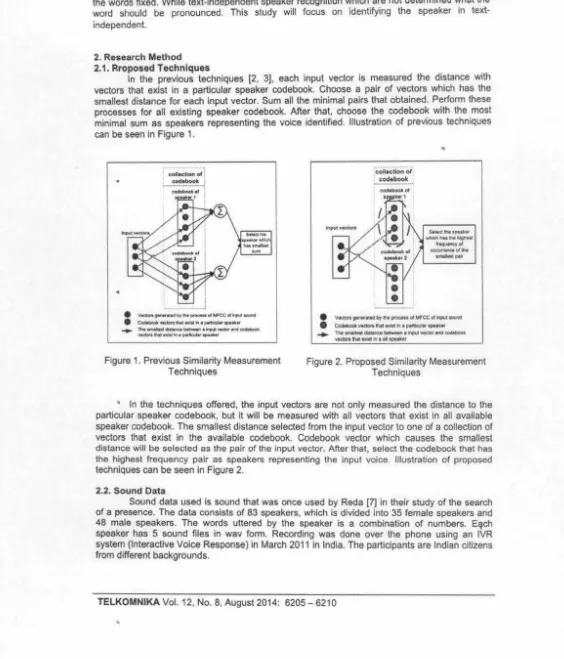
In the previous techniques [2, 3], each input vector is measured the distance with vectors that exist In a particular speaker codebook. Choose a pair of vectors which has the smallest distance for each input vector. Sum all the minimal pairs that obtained. Perform these processes for all existing speaker codebook. After that, choose the codebook with the most minimal sum as speakers representing the voice identified. Illustration of previous techniques can be seen In Figure 1.
calloctlon
of.,
eodebook I - -.. - - - ·1eodebooi of t
I :
e
v ... __.ioy.,._o1wcco1_....,.•
セM... -in . .,..-..,...
---·--Md-
...
セ@..
--Figure
1.
Previous Similarity Measurement Techniques·c;;ii..;iion.of
セッ、「ッッォ@
•
•
- ...
·po--
" - " '
... ...
..._o1 ...
-'*'
• VIQOft gonhted by N - a l Ml'CC al
Input-• セMャエ|ャャMィQNLNN⦅イNイセ@
[image:3.614.4.568.150.809.2].... T'1o---·----
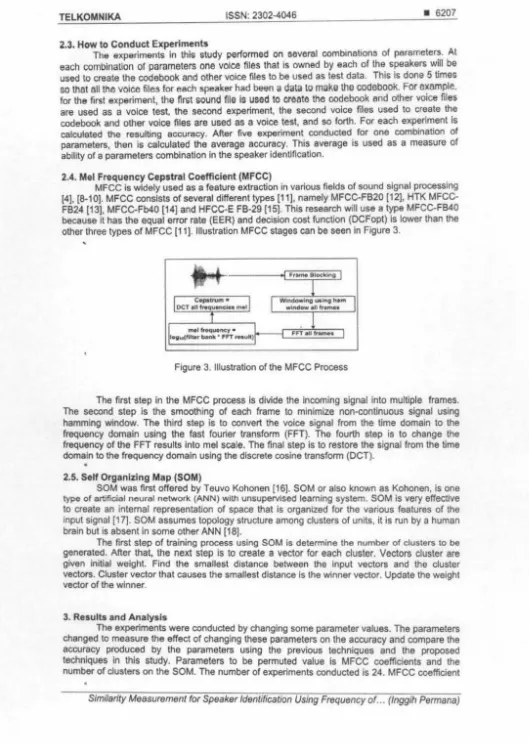
-flll-in1dopubrFigure 2. Proposed Similarity Measurement Techniques
セ@ In the techniques offered, the input vectors are not only measured the distance to the particular speaker codebook, but it will be measured with all vectors that exist in all available speaker codebook. The smallest distance selected from the input vector to one of a collection of vectors that exist in the available codebook. Codebook vector which causes the smallest distance will be selected as the pair of the input vector. After that, select the codebook that has the highest frequency pair as speakers representing the input voice. Illustration of proposed techniques can be seen In Figure
2.
2.2. Sound Data
Sound data used is sound that was once used by Reda [7] in their study of the search of a presence. The data consists of 83 speakers, which is divided Into 35 female speakers and 48 male speakers. The キセイ、ウ@ uttered by the セー・。ォ・イ@ is a combination of numbers. eセ」ィ@
speaker has 5 sound files in wav form. Recording was done over the phone using an IVR
system (Interactive Voice Response) in March 2011 in India. The participants are Indian citizens from different backgrounds.
TELKOM NI KA ISSN: 2302-4046 • 6207
2.3. How to Conduct Experiments
The experiments in this study performed on several combinabons of parameters. Al
each combination of parameters one voice flies that is owned by each of the speakers
will
be used to create the codebook and other voice files to be used as test data. This is done5
times so that all the voice files for each speaker had beena
data to make the codebook. For example. for the first experiment, the first soundfile Is used
to create the codebook and other voice files are used as a voice test, the second experiment, the second voice files used to create the codebook and other voice files are used asa
voice test, andso
forth. For each experiment Is calculated the resulting accuracy. After five experiment conducted for one combination of parameters, then is calculated the average accuracy. This average is used as a measure of ability of a parameters combination In the speaker identification.2.4. Mel Frequency Cepstral Coefficient (MFCC)
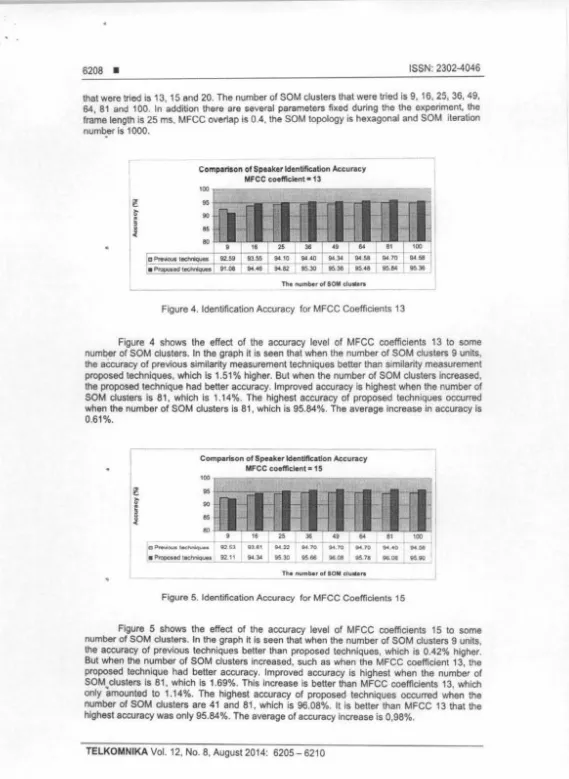
MFCC Is widely used as a feature extraction in various fields of sound signal processing (4], (8-10). MFCC consists of several different types (11), namely FB20 [12), HTK MFCC-FB24 [13), MFCC-Fb40 [14) and HFCC-E FB-29 (15). This research will use a type MFCC-FB40 because it has the equal error rate (EER) and decision cost function (DCFopt) is lower than the other three types of MFCC [11). Illustration MFCC stages can be seen in Figure 3.
'
c,e.,.ttvm • OCT all froquancle9 ,,,_,
mel frequency• 109,.(flher b.nk' ffT mull)
Frame Blocking
Window1no u.lng ham
wind-ml ,, ...
Fnall"-Figure 3. Illustration of the MFCC Process
The first step in the MFCC process is divide the Incoming signal into multiple frames. The second step is the smoothing of each frame to minimize non-continuous signal using hamming window. The third step ls to convert the voice signal from the lime domain to the frequency domain using the fast fourier transform (FFT). The fourth step is to change the frequency of the FFT results into mel scale. The final step is to restore the signal from the time domain to the frequency domain using the discrete cosine transfonn (OCT) .
•
2.5. Self Organizi ng Map (SOM)
SOM was first offered by Teuvo Kohonen [16]. SOM or also known as Kohonen, is one type of artificial neural network (ANN) with unsupervised learning system. SOM Is very effective to create an internal representation of space that is organized for the various features of the input signal (17). SOM assumes topology structure among clusters of units, it is run by a human brain but is absent in some other ANN (18].
The first step of training process using SOM is determine the number of clusters to be generated. After that, the next step Is to create a vector for each cluster. Vectors cluster are given initial weight. Find the smallest distance between the input vectors and the cluster vectors. Cluster vector that causes the smallest distance Is the winner vector. Update the weight vector of the winner.
3. Results and A nalysis
[image:4.626.37.566.55.798.2]6208 • ISSN: 2302-4046
that were
tried
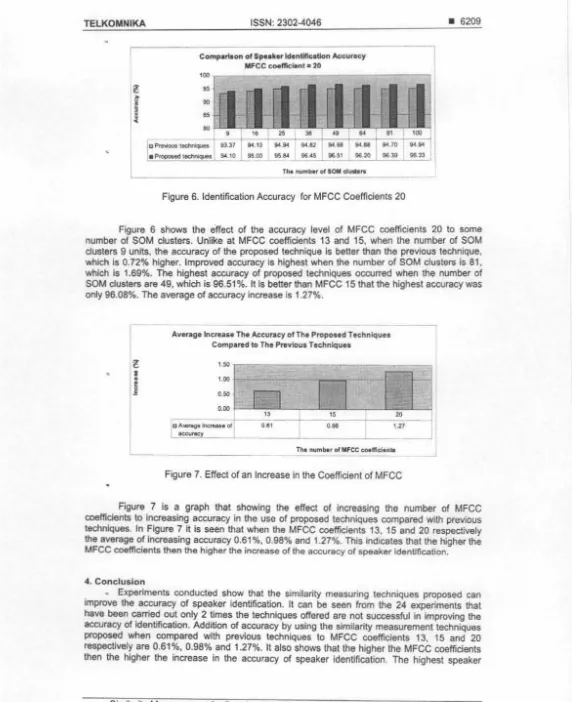
is 13, 15 and 20. The number of SOM clusters that were tried is 9, 16, 25, 36, 49,64, 81 and 100. In addition there are several parameters fixed during the the experiment, the frame length is 25 ms. MFCC overlap 1s 0.4, the SOM topology is hexagonal and SOM iteration number is 1000.
..
Compll'leon of Speaker Identification Accuracy MFCC coefficient• 13
100
9 5 +
-90
85
80
95.30
[image:5.620.13.582.0.779.2]The numt..r of SOM duurs
Figure 4. Identification Accuracy for MFCC Coefficients 13
l
Figure 4 shows the effect of the accuracy level of MFCC coefficients 13 to some number of SOM clusters. In the graph it is seen that when the number of SOM clusters 9 units, the accuracy of previous similarity measurement techniques better than similarity measurement proposed techniques, which is 1.51% higher. But when the number of SOM clusters increased, the proposed technique had better accuracy. Improved accuracy is highest when the number of SOM clusters Is 81 , which is 1.14%. The highest accuracy of proposed techniques occurred when the number of SOM clusters Is 81, which is 95.84%. The average increase in accuracy Is
0.61%.
•
..
Comparison of Speaker ldentlflcatlon Accuracy MFCC coefflclent • 15
100
80
セ@ セ@ セ@
I
セ@ セ@a ? - . . lee.._,._ 112 S3 0311 IM 'n- IM 70 1 1M 70 1M 70 IM.<40
• Pl'OOOled teeiWQues セ@ セ@ 95 30 95 66 118 oe 95 1a _ 96_.oe_ . . _ Th• number or SOM clullera
Figure 5. Identification Accuracy for MFCC Coefficients 15
Figure 5 shows the effect of the accuracy level of MFCC coefficients 15 to some number of SOM clusters. In the graph it Is seen that when the number of SOM clusters 9 units, the accuracy of previous techniques better than proposed techniques, which Is 0.42% higher. But when the number of SOM clusters increased, such as when the MFCC coefficient 13, the proposed technique had better accuracy. Improved accuracy is highest when the number of SOM.clusters is 81, which is 1.69%. This increase is better than MFCC coefficients 13, which only amounted to 1.1 4%. The highest accuracy of proposed techniques occurred when the number of SOM clusters are 41 and 81 , which is 96.08%. It is better than MFCC 13 that the highest accuracy was only 95.84%. The average of accuracy increase is 0,98%.
TELKOMNIKA
l
I
ISSN: 2302-4046
Comparison of Speaker ldentlflc:atlon Accuracy
- - - i
MFCC coefficient• 20 '
100
セ@
eo
as80
9 111 2S
jll Pr...ious
エセ@
113.37I
94.10 - 94 94 94 82 94 81a Pftll)Oled teclv1iqUes I 94.10 セ@ 95 00 115 &I 116 '5 116 51 The num!Mr ol SOM du••,.
L
-Figure 6. Identification Accuracy ror MFCC Coefficients 20
[image:6.616.11.583.45.747.2]• 6209
Figure 6 shows the effect of the accuracy level of MFCC coefficients 20 to some number of SOM clusters. Unlike at MFCC coefficients 13 and 15, when the number of SOM clusters 9 units, the accuracy of the proposed technique Is better than the previous technique, which Is 0.72% higher. Improved accuracy is highest when the number of SOM clusters is 81 , which Is 1.69%. The highest accuracy of proposed techniques occurred when the number of SOM clusters are 49, which is 96.51
%.
It Is better than MFCC 15 that the highest accuracy was only 96.08%. The average of accuracy increase is 1.27%.•
ll
I•
j
L
Average Increase The Accuracy of The Propo11d T echnlquH Compared to The Previous TechnlquH
150
100
050
0.00
13
+-
16D A""'8Q8
iョ」Nエ・・ウ
セ@
--+--0.&1 0.98
ac:curecy _ _
20 1.27
The num!Mr ol MFCC coemclenla
Figure
7.
Effect of an Increase in the Coefficient of MFCC___,
J1
_,
Figure 7 is a graph that showing the effect of increasing the number of MFCC coefficients to increasing accuracy in the use of proposed techniques compared with previous techniques. In Figure 7 It is seen that when the MFCC coefficients 13, 15 and 20 respectively the average of increasing accuracy 0.61 %, 0.98% and 1.27%. This indicates that the higher the MFCC coefficients then the higher the increase of the accuracy of speaker Identification.
4. Conclusion
6210 • ISSN: 2302-4046
identification accuracy is 96.51% with the number or SOM clusters Is 49 and the number of MFCC coefficients is 20.
Although successful in increasing the accuracy of the speaker identification, but the increase was small. Therefore, for further research. the technique in this study need to be improved In order to increase in higher accuracy.
References
(1] Kinnunen T, Li H. An Overview of Text-Independent Speaker Recognition: from Features to Supervectors. Speech Communication. 2010; 52(1): 12-40.
(2] Fruandta A, Buono A. ldentifil<asl Campuran Nada pads Suara Piano Menggunakan Codebook Seminar Nasional Aplikasi Teknologi lnronnasi. Yogyakarta. 2011 ; 8-13.
[3) Wlsnudlsastra E, Buono A. Pengenalan Chord pada Alat Musik Gitar Menggunakan CodeBook dengan Teknik Ekstraksi Ciri MFCC. Jumal llmiah I/mu Komputer. 2010; 14(1): 16-21 .
(4) Muds L, Begam M, Elamvazulhl I. Voice Recognition Algorithms Using Mel Frequency Cepstral Coefficient (MFCC) and Dynamic Time Warping (DTW) Techniques. Journal of Computing. 2010: 2(3): 138-143.
[5] Yan J , Zhu Y, Ho H, Sun Y. Multi-Contingency Cascading Analysis or Smart Grid Based on Self-Organizing Map. Information Forensics and Security, IEEE Transactions on. 2013; 8(4): 646-6. (6) Furul S. An Overview of Speaker Recognition Technology. Automatic speech and speaker
recognition. Springer US. 1996; 31-56.
[7) Reda A, Panjwanl S, Cutrell E. Hyke: A Low-Cost Remote Attendance Tracking System for Developing Regions. Proceedings or the 5th ACM workshop on Networked systems for developing regions ACM. 2011 ; 15-20.
[8) Alam MJ, Kenny P, Ouellet P, O'Shaughnessy D. Multitaper MFCC and PLP Features for Speaker Verification Using I-Vectors. Speech Communication. 2013; 55: 237-251 .
(9) Chen SH, Luo YR. Speaker Verification Using MFCC and Support Vector Machine. Proceedings of
tile
International Multi Conference or Engineers and Computer Scientists. Hong Kong. 2009; 1: 1 S-20.(10] Nakagawa S, Wang L, Ohtsuka S. Speaker Identification and Venficatlon by Combining MFCC and Phase Information. Audio, Speech, and Language Processing, IEEE Transactions on. 2012; 20(4); 1085-1095.
[11) Ganchev T, Fakotakis N, Kokkinakis G. Comparative Evalua/Jon of Various MFCC Implementations on the Speaker Verification Task. Proceedings of the SPECOM. 2005; 1: 191-194.
(12) Davis S, Mermelstein P. Comparison of Parametric Representations for Monosyllable Word Recognition in Continuously Spoken Sentences. Acoustics, Speech and Signal Processing, IEEE Transactions on. 1980; 28(4): 357-366.
(13) Steve Y, Odel J, Ollason D. Valtchev V, Woodland P. The HTK Book, version 2. 1. Cambridge University. 1997.
(14] Slaney M. Auditory Toolbox. Interval Research Corporation, Tech Rep. 1998.
(15] skowronski MD, Harris JG. Exploiting Independent Filter Bandwidth of Human Factor Cepstral Coefficients in Automatic Speech Recognition. The Journal of the Acoustical Society of America. 2004; 116: 1774-1780.
(16] Kohonen T. Self-Organized Formabon of Topologically Correct Feature Maps. Biological Cybernetics. 1982; 43(1): 59-69.
(17] Kohonen T. The Self-Organizing Map. Proceedings of the IEEE. 1990; 78(9): 1464-1480.
[18} Bo:sheer IA, Hajmeer M . .Artlnclal Neural Networks: Fundamentals, Computing, Design, and
Application. Journal of Microbiological Methods. 2000; 43(1 ): 3-31 .