TELKOf\1N IKA Indon esian Journal of Electrical
Engineering
TELVOr·1;,;,;,,, ;. dut.1:·.i :r JoLfn.i d ck(l11ei:l Er y •:t::.:r111q 'i3Si-i ::'1ii2 ·lv·lfi. ,., t1 m•Jnthi; pet:r
•t": ,•::l'c1 !nr...-rn .1t10n•1I Lw"<i' · fw;I -. 11 Pi-. 0:::v0:1 ,, ··1 J.-<L': o.- :::r ·11. sorr. J[i, Goeoq·:
Sc11ot.:ir. , .. ,:;Q..;.:"l. t bセlッ@ Iᄋ⦅セN Z NL@ Si.•·!, \,t._ • N[QZイNNセ@ ..,.- 1-セZNZZッ@
.
tr セLゥNNZ@ ,11•11 ,;· tl11-. Julll 11 1 , ... l'J ーB Q セlセィ@ イオアセエセアQNQ\jャᄋセv@ -.1:lt:J,ic, c·:;..i G[エャ|ZセZ@:v
! I LZ」NNNZ[GBGGZセ@ 'f ·· · ャ|Zセ\ZBGエ@ 'd' 't1.::•ct '1 .. l U,•,,.l r;; fr't:"lt""'* n セセᄋエLL[@ f1,•1,1 of c!ect11c.1l ᄋョアQョセN@ r1riq . : ... ., 11;e • ,,, , .• ,:;.,.,,,' ••·, 111:> ᄋセᄋ@c,,,..,
•.f T,•lpccr· r·1u1 •C:lt )rl NQセQQ@lnfo1mat1011 Tt_!rhnolOlJY. Apµ •eel Cornp, .. nuq i\rld (Qnop .lt:•. i11<.trul'IL·flt.itton cll'd 1..ul'lrvl, EleClltC..ll
(l'u :.(:f j, dfld cl..:<.lr jャャゥセGZゥ@ E.n911h:...-r ll'<J
Publisher
•
セ ᄋセエ。es@
...
Institute of Advanced Engineering and Science
http:/ /'::ww .rae<.JOlll n<il .Cl)m /
Journal Contact
Principal Contact
Tole Sutikno
Un1vers1tas Ahm aJ Oahlan Phone: 622744547770
Email: telkomnika. [email protected]
Support Contact
IAES Support Contact Email· [email protected]
Advisory Editors
l. Prof. Hamid A. Toliyat, Texas A&M Un1verc:1ty, Unrted States
2. Prof. Patricia Melin, T11uana Institute or Technology , Mexico 3. Prof. Neil Bergmann , The University of Queensland, Australia 4 Or. Argyrios Zolotas. University o f Lincoln, United K,nqdom 5. Prof. Aurelio P1azz1, University of Parma, Italy
Mセ@
Editor-in-Chief
Co-Editor- in-Chief
Prof Dr. Leo P L1gthart '1: rt_ ·-·u·.!·c.. t . ,, , セ@ 1·1, • •• :J . ·;. :1•···1,·r : .. Prof Dr. Omar Lengerke J1 1. · , ... · ! l : .. '' • ··1' •·
=.
1' .-.. . .,., 1, ;:3 Assoc. Prof. Or. Wanquan Liu (,, .. ,., l,r Q N LNᄋᄋセ@ l, '"t·C""1:0 • , . : . , , . , , • 1
-: Or Arianna Mencatt1ni l"11,<'''-•:·1 .' :.0:!1 • 11 , .'· .J. !t 1 "t 1 .
:; Or Auzan1J1din '·-'" ·''"'' TL •·'"1 <i1 · .•1a."1r.1 .. il < l jセP NQZNGMG\Z QQᄋ N MNNQ@
o Mark S. Hooper. /.n:i109 /RF IC j 」 セ@ qn Eng1n.:..:r C0rbult,'.11Hj :n i·l1Uu'>L'lll., U111led St.)tb
Editors
1. Prof. Or. Faycal OJeffal, University or Batna, B:nna, Algeria 2. Prof. Dr. LUIS Paulo Reis, University or M1nho, Portug.JI
3 Prof. Or. SanJay Kaul, Fitchburg St<1tc Univers1l y. United State.., 4 Prof. Dr. Sot1nos G. Z1avras. Uniwr<.1ly Height<., United Stall.'"
5 Prof Or. Srinivasan Alavandar. C" CC•lh:\Je of eョアQョセ」Q@ u1g cln d T0chn .>loc1\·, Ind1.:i 6. Prof. Or. Tarek Bouktir, Fer hill Abb e.., Un1ver..,1t y, SL't r . A1ge11,1
7. Prof. dr.sc. Maja Stula , Un1vers1ty of Split, CroJllJ
8 Assoc. Prof. Or. Nik Rumzi Nik Idris. Un1vcr -.1t1 1 ckn01091 l·lcJl.i-,. ::.10. i·l<il.r;<.1t1 9 Assoc. Prof Dr. Lunchakorn Wutt1sittikulkij, Chulalonqko1 n Un1ver<:.1ty, rht111.111d
Io
Assoc. Prof Dr Jumnl Yunas UnivL'1.-.1t • Kcbvn(J<.J 1n t·1illW'>•Ll. Mala·fc..til 11 Assoc. Prof. Dr. Mochammad Facta , Lln1vc1 ':>1lJ<. D1po1109or0 ( UNDIP!, l 1•cJc.n..:'>1a l ::! Asst. Prof. Dr. Ahmet Teke Cu i..lll< v.1 U11 1v1.:1'>1 ty . Turkey13. Asst. Prof. Or. Ehsan 0 . Sheyban1 "•<11111" セャエQォ@ Llr "'-''"'tr. IJ·11tn: ᄋセエNイャNZG^@
14 Asst. Prof. Or. Supavadee Aramv1th. I.IHI• , n1 k 1111 ..,., . ·r ,1t , . '·1" "' !
15 Or. Ahmad Saudi Samosir, Uni\ ..:rstlch LcJmpu ng \ urJILA). rndone:-,1.J 16. Dr. Ahmed Nab1h Zaki Rashed, Menouf1a Univ1::1..,1ly, Egypt
17. Or. Deris Stlawan, CIEH, CIHFI. Univers1tas Snw1Java. Indonesia
18 Dr. Han Yang, Un1vers1ty of El<:ctronic Science ond Technology of Ch1n:i, Chtn.J 19. Or. Jacek Stando, Technical University of Lodi'. Poland
20. Dr. Munawar A Riyadi, Un1vers1t1 Teh.no1og1 MalJys1a, Malays1J
21. Dr. Nidhal Bouaynaya, University of Arkansas at Little Rock , Arkans:is, United sエNZゥエセ セ@
22. Or. Peng Peng, Seagate Technology, Bloomington, MN , United State<. 23. Or. Shahrin Md . Ayob, Univers1t1 Teh.nologi Malaysia , Malaysia 24 Dr. Surinder Singh, SUET Longowal, India
25. Or. Tutut Herawan, Univers1t1 Malaysia Pahang, Malaysia
26. Dr. Vassilis S. Kodogiannis, CEng, University of Westminster, United Kingdom 27 Or. Yin Liu , Symantec Core Research Lab, United States
NO JUOUL MEDIA PENERBITI FORUM
1 2 3
17
Sundanty Mea5uremenl for Speaker ldennfica11on IAES • Ur.v. Ahmad'l
Using Frequency of Vecior Pairs Oahlan-Yogyakartaセオ [セ Nエ lL@
( .
0
\c--
vt
vt..A'._c".1' --1'6,/'-
l
r
)Q
_,
v
!.../
I "'._
.f
c
x '
セ@
.;
""1
'
,
',-"I
1 ...
/''.._
::!,(.
/ < ( t i (,I\,
KEPUTUSAN
PENILAIAN KARYA ILMIAH DOSEN IPB
Dr.Ir. Bib Paruhum Silalahi, M.Kom
NIP. 196701011992031004
Oepartemen Matcmatika
Fakultas Matematil..a dan llmu Pengetahuan Alam
ISSN ISBN
4 5
2302-4 046 NZM セ@
,-.
VOL•
12NO BULAN, TAHUN
7
•
8 Sd
Agustus
2014
r.
I
'-t
, ')
'
/r'
(. セZNMi@ >V...y.;
AKREOI·
KOTA HAL
TAS I PENERBIT
OIKTI
'
10 11Yogyakarta VRPセRQ@
0
t/
"".1/(
.
...
I .._
.,
I ,"I< ( l I
(_,,,
PENULIS NIP
12 13
1 lngg1h Permana
2 Agus Buono
3. Bib Peruhum S1lalah1 19670101199203 1004
Boqor. 11 Maret 2015
PENILAI I
•
PE· PE·
KATEGORI NILAI NIL.Al
I II
14 15 I&
TELKOMNIKA Indonesian Journal of Electrical Engineer ing Vol 12, No. 8. August 2014. pp. 6205 - 6210
DOI 10 11591/telkomnika v1218 6194 • 6205
Similarity Measurement for Speaker Identification
Using Frequency of Vector Pairs
lnggi h Permana·1, Agu s Buono2, Bib Paruhum Silalahi3
• 2Department of Computer Science, Faculty of Mathematics and Natural Sciences. Bogor Agricultural University. Bogor 16680. Indonesia
3
0epartment of Mathematic, Faculty of Mathematics and Natural Sciences
Bogor Agricultural University. Bogor 16680. Indonesia • ? ·corresponding author. e-mail 1n991h permana12p@apps Qセ「@ ac 1d . pudesha@yahoo co 1d·.
b1bparuhum1@yahoo com
Abstract
Similarity measurement is an important part of speaker identification. This study has modified the s1mllanty measurement technique performed in previous studies Previous studies used the sum of the smallest distance between the input vectors and the codebook vectors of a particular speaker In this study, the technique has been modified by selecting a particular speaker codebook which has the highest frequency of vector pairs. Vector pair in this case 1s the smallest distance between the input vector and the vector m the codebook. This study used Mel Frequency Cepstral Coefficient (MFCC) as feature extraction. Self Organizing Map (SOM) as codebook maker and Euclidean as a measure of distance. The experimental results showed that the similarity measuring techniques proposed can improve the accuracy of speaker identification. In the MFCC coefficients 13, 15 and 20 the average accuracy of identification respectively increased as much as 0.61%, O 98% and 1.27%.
Keywords: frequency of vector pairs, MFCC, similarity measurement, SOM. speaker 1denflficat1on
Copyright© 201 4 Institute of Advanced Eng ineering and Science. All rights reserved.
1. Introduction
Speaker identification 1s part of the sound processing that aims to find out who 1s talking. Speaker identification is necessary because the human ability to recognize human speech is very limited, especially with so much diversity among human voice Therefore. the speaker identification system is needed and widely applied in real life. One important application of speaker identification is in the field of forensics
11 ).
for example identifying who is speaking on a recorded phone call that will be used as evidence in a court case. In daily life, speaker identification is also very important, such as access control to telephone banking , shopping, opening a personal computer and so forth.Speaker identification has two main parts. namely the feature extraction and similarity measurement. This study has modified the similarity measurement technique performed in previous studies. In previous studies 12. 3) similarity measurements have been performed by using sum of the smallest distance between the input vector and the codebook vector of a particular speaker. Codebook is voice prints produced through a training (3). The sum result of
the most m inimally defined as speakers representing the inputted voice. In this study, the
technique was modified by means of selecting a particular speaker codebook that has the highest frequency of occurrence of vector pairs with input vectors as speakers representing the inputted voice. Vector pair is the smallest distance between the input vectors with one of the vectors that exist in the entire codebook. Distance measurement method used in this study is Euclidean.
Feature extraction method used in this study is mel frequency cepstral coefficient (MFCC). MFCC is often used because 1t is considered a better performance than other methods, such as in terms of error rate reduction. The workings of MFCC is based on the frequency difference can be captured by the human ear so that 1t can represent how people receive sound signals (4).
In this study the algorithm which will be used as a codebook maker is self organizing map (SOM). SOM successfully applied to high-dimensional data 15), which is the traditional
6206 • ISSN. 2302-4046
method may not be able to do so. Its ab1l1ty to handle data of high dimension which 1s the cons1derat1on
for
choosing this method to generate codebook. Data results from MFCC might produce a h1gh-d1mens1onal. depending on how many coefficients are determined at the MFCCSpeaker 1dent1ficatton based on the words spoken d1v1ded into two. namely the text-dependent and text-intext-dependent (61 Dependent-text is the introduction of the speaker uttered the words fixed. Whtie text-independent speaker recognition which are not determined what the word should be pronounced This study will focus on 1dent1fying the speaker in text-tndependent
2. Research Method
2.1. Proposed Techniques
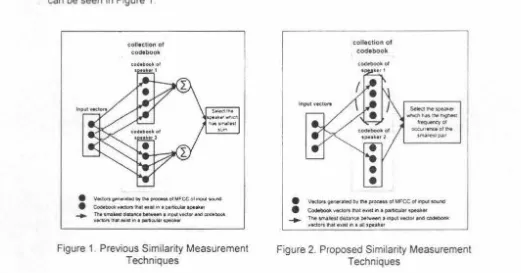
In the previous techniques (2, 3), each input vector 1s measured the distance with vectors that exist in a particular speaker codebook. Choose a patr of vectors which has the smallest distance for each input vector. Sum all the minimal pairs that obtained Perform these processes for all existing speaker codebook After that, choose the codebook with the most minimal sum as speakers representing the voice identified Illustration of previous techniques can be seen in Figure 1
conecllon ol codebook
S..o<I ....
|ーゥャGjャャ・ヲセ@
ャ|aNLLNNNセq@
,...,,
• v ... onvon-odbf.,._olMfCCol_...,..
• Codtt>OOll. vedort O\M e1.a in t PlllOJCM ape-..
_.. TM .,,.. . . . dilitanu セ@ Q Q ョNセ@ vtctot ard ・ッ、エセ@
[image:6.621.23.544.250.523.2]VtciOt'I tnat ... セ@ I peftc:utlf 'l)lll\lf
Figure
1.
Previous Similarity Measurement Techniquescollection of codebook
•
•
s・ャッ、nセoi@
wr.cn ,.,, cmセ@
klQUlltlCY 01
0CC:Ulf1n(.e ol U\e
セQQ・mー。エエ@
• Vectoto - a l t d by"° !)loceu OI Mf"CC Ol W'OIA oouncl
• C-vedOrl 11\al
°'>'II"
1 セB@ . . . . ,. . . . Tiie omallnl dd ... be-I onpul ve<.1or lll'd
-vectott that tllSt .n a a• spea\et
Figure 2. Proposed Similarity Measurement Techniques
In the techniques offered, the input vectors are not only measured the distance to the particular speaker codebook, but it will be measured with all vectors that exist tn all available speaker codebook. The smallest distance selected from the input vector to one of a collection of vectors that exist in the available codebook. Codebook vector which causes the smallest distance will be selected as the pair of the input vector. After that. select the codebook that has the highest frequency pair as speakers representing the input voice. Illustration of proposed techniques can be seen in Figure 2.
2.2. Sound Data
Sound data used is sound that was once used by Reda (7) in their study of the search of a presence. The data consists of 83 speakers, which is divided into 35 female speakers and 48 male speakers. The words uttered by the speaker is a combination of numbers. Each speaker has 5 sound files in wav form. Recording was done over the phone using an IVR system (Interactive Voice Response) in March 2011 in India. The participants are Indian citizens from different backgrounds.
TELKOMNIKA ISSN 2302-4046 • 6207
2.3. How to Conduct Experiments
The experiments in this study performed on several combinations of para'Tleters At each combination of parameters one voice files that 1s owned by each of the speakers will be used to create the codebook and other voice files to be used as test data This is done 5 ttmes so that all the voice files for each speaker had been a data to make the codebook For example. for the first experiment. the first sound fi le 1s used to create the codebook and other voice files are used as a voice test, the second expenment. the second voice files used to create the codebook and other voice files are used as a voice test. and so forth For each expenment is calculated the resulting accuracy. After five experiment conducted for one combination of parameters, then 1s calculated the average accuracy This average is used as a measure of
ability of a parameters combination in the speaker identification.
2.4. Mel Frequency Cepstral Coefficient (MFCC)
MFCC is widely used as a feature extraction m various fields of sound signal processing [4J. [8-1
OJ.
MFCC consists of several different types (11 ), namely FB20 (12}, HTK MFCC-FB24 (13], MFCC-Fb40 (14} and HFCC-E FB-29 (15]. This research will use a type MFCC-FB40 because it has the equal error rate (EER) and decision cost function (DCFopt) is lower than the other three types of MFCC (11). Illustration MFCC stages can be seen in Figure 3*'+-
F ran-. Bloek ong I1
I
Cepsttum •I
I
Windowing using hamI
OCT all trequenc101 met w indow all frames
T
l
I
m•l lroquoncy • I FFT all tram"'I
log.,(filter bank• FFT resull) I
Figure 3. Illustration of the MFCC Process
The first step in the MFCC process is divide the incoming signal into multiple frames The second step is the smoothing of each frame to minimize non-continuous signal using hamming window. The third step is to convert the voice signal from the time domain to the frequency domain using the fast fourier transform (FFT). The fourth step is to change the frequency of the FFT results into mel scale. The final step is to restore the signal from the time domain to the frequency domain using the discrete cosine transform (OCT).
2.5. Self Organizing Map (SOM)
SOM was first offered by Teuvo Kohonen (16). SOM or also known as Kohonen. is one type of artificial neural network (ANN) with unsupervised learning system SOM is very effective to create an internal representation of space that is organized for the various features of the input signal (17}. SOM assumes topology structure among clusters of units. it 1s run by a human brain but is absent in some other ANN (18].
The first step of training process using SOM is determine the number of clusters to be generated. After that, the next step is to create a vector for each cluster. Vectors cluster are given initial weight. Find the smallest distance between the input vectors and the cluster vectors. Cluster vector that causes the smallest distance is the winner vector. Update the weight vector of the winner.
3. Results and Analysis
The experiments were conducted by changing some parameter values The parameters changed to measure the effect of changing these parameters on the accuracy and compare the accuracy produced by the parameters using the previous techniques and the proposed techniques in this study. Parameters to be permuted value is MFCC coefficients and the number of clusters on the SOM . The number of experiments conducted is 24. MFCC coefficient
•
6208 ••
ISSN 2302-4046that were tried is 13. 15 and 20 The number of SOM clusters that were tned is 9. 16 25. 36. 49, 64, 81 and 100 In add1t1on there
are
several parameters fixed during the the experiment the frame length is 25 ms, MFCC overlap 1s 0.4, the SOM topology is hexagonal and SOM iteration number is 1000.Compari.son of Speaker Identification Accuracy MFCC coefficient= 13
100
85
80
9
ウ セMM
-16 25 49 81 100
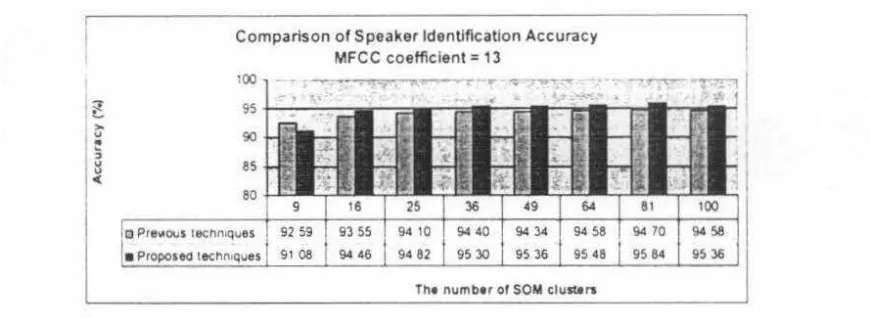
o Pre .. ovs 1ecnn1ques 92 59 93 55 94 10 94 40 94 34 94 58 94 70 94 58
• Propose<11echn•ques 91 08 94 46 94 82 95 30 95 36 95 48 95 84 95 36
Th• number of SOM cl usu rs
Figure 4 Identification Accuracy for MFCC Coefficients 13
Figure 4 shows the effect of the accuracy level of MFCC coefficients 13 to some number of SOM clusters. In the graph it is seen that when the number of SOM clusters 9 units, the accuracy of previous similarity measurement techniques better than similarity measurement
proposed techniques, which is 1.51 % higher But when the number of SOM clusters increased,
the proposed technique had better accuracy . Improved accuracy is highest when the number of SOM clusters 1s 81 . which is 1.14%. The highest accuracy of proposed techniques occurred when the number of SOM clusters is 81 , which is 95.84%. The average increase in accuracy is 0.61%.
l
,..
u
•
:; u
u
<
Comparison of Speaker Identification Accuracy MFCC coefficient= 15
9 16 25 36 •9 6' 81 100
92.53 93 61 94 22 94 70 94. 70 94 70 94 40 94 S8 92. 11 94 3' 95 30 95 66 96 08 95 78 96 08 95 90
Th• number of SOM clusurs
Figure 5. Identification Accuracy for MFCC Coefficients 15
Figure 5 shows the effect of the accuracy level of MFCC coefficients 15 to some number of SOM clusters. In the graph it is seen that when the number of SOM clusters 9 units, the accuracy of previous techniques better than proposed techniques, which is 0.42% higher. But when the number of SOM clusters increased. such as when the MFCC coefficient 13, the proposed technique had better accuracy Improved accuracy is highest when the number of SOM clusters is 81 , which is 1.69%. This increase is better than MFCC coefficients 13, which only amounted to 1.14%. The highest accuracy of proposed techniques occurred when the number of SOM clusters are 41 and 81, which is 96.08%. It is better than MFCC 13 that the highest accuracy was only 95.84%. The average of accuracy increase is 0,98%.
[image:8.618.44.526.69.711.2] [image:8.618.74.509.106.265.2]•
'
TELKOMNIKA ISSN 2302-4046Comparison of Speaker Identification Accuracy MFCC coefficient= 20
100
95
90
85
80
o p セNエ。カウ@ 1ec:11n.ques
I• Propose<! tec11n1ques
The number of SOM c1Ustel'$
[image:9.630.71.546.19.495.2]94 70 94 94 96 39 96 33
Figure 6. Identification Accuracy for MFCC Coefficients 20
• 6209
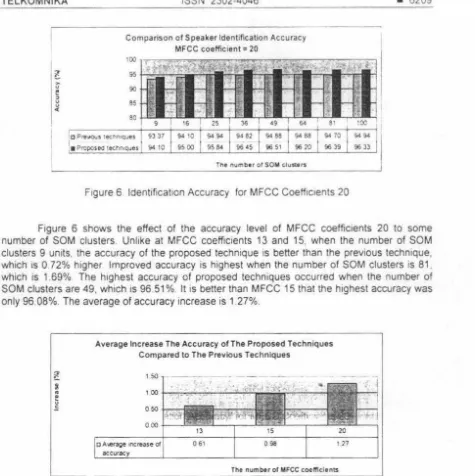
Figure 6 shows the effect of the accuracy level of MFCC coefficients 20 to some number of SOM clusters . Unlike at MFCC coefficients 13 and 15, when the number of SOM clusters 9 units. the accuracy of the proposed technique 1s better than the previous technique. which 1s 0 72% higher Improved accuracy is highest when the number of SOM clusters 1s 81, which 1s 1.69% The highest accuracy of proposed techniques occurred when the number of SOM clusters are 49, which 1s 96 51% It 1s better than MFCC 15 that the highest accuracy was
only 96.08%. The average of accuracy increase is 1 27%.
セ@
x
..
e
u
.:
Average Increase The Accuracy of The Proposed Techniques Compared to The Previous Techniques
I 50
I 00
050
000
13 15
o A1etage ゥョ」セ。ウ・@ ol 061 098
accuracy
20 I 27
[image:9.630.116.531.341.488.2]The number or MFCC coel!lclents
Figure 7. Effect of an Increase in the Coefficient of MFCC
Figure 7 is a graph that showing the effect of increasing the number of MFCC coefficients to increasing accuracy in the use of proposed techniques compared with previous techniques. In Figure 7 it is seen that when the MFCC coefficients 13, 15 and 20 respectively the average of increasing accuracy 0.61 %, 0.98% and 1.27%. This indicates that the higher the
MFCC coefficients then the higher the increase of the accuracy of speaker identification.
4. Conclusion
Experiments conducted show that the similarity measuring techniques proposed can improve the accuracy of speaker identification. It can be seen from the 24 experiments that have been carried out only 2 times the techniques offered are not successful in improving the accuracy of identification. Addition of accuracy by using the similarity measurement techniques proposed when compared with previous techniques to MFCC coefficients 13, 15 and 20 respectively are 0.61 %, 0.98% and 1.27%. It also shows that the higher the MFCC coefficients then the higher the increase in the accuracy of speaker identification The highest speaker
' ,.
•
6210 •
ISSN2302-4046
1dent1ficat1on accuracy is 96
51%
with the number of SOM clusters 1s 49 and the number of MFCC coefficients 1s20
Although successful in increasing the accuracy of the speaker 1dent1ficat1on, but the increase was small Therefore. for further research, the technique in this study need to be improved in order to increase in higher accuracy
References
(1) Kinnunen T. L1 H. An Overview of Text-Independent Speaker Recognition· from Features to Supervectors Speech Communication. 2010. 52(1 ) 12-40
(2) Fruandta A. Buono A . ldent1fikas1 Campuran Nada pada Suara Piano Menggunakan Codebook.
Seminar Nasional Aphkasi Teknolog1 lnformasi. Yogyakarta 2011 : 8 -13
(3) Wisnud1sastra E. Buono A Pengenalan Chord pada Alat Mus1k G1tar Menggunakan CodeBook dengan Teknik Ekstraks1 C1ri MFCC . Jumal llmiah //mu Komputer 2010, 14(1 ) 16-21
(4) Muda L. Begam M. Elamvazuth1 I Voice Recognilton Algorithms Using Mel Frequency Cepstral Coefficient (MFCC) and Dynamic Time Warping (DTW) Techniques. Journal of Computing. 2010, 2(3): 138-143
(5) Yan J. Zhu Y, He H . Sun Y Mulh-Contingency Cascading Analysis of Smart Gnd Based on Self-Organ1z1ng Map. Information Forensics and Security, IEEE Transactions on 2013: 8(4). 646-6
(6) Furui S. An Overview of Speaker Recognition Technology Automatic speech and speaker recognition. Springer US 1996; 31-56
(7) Reda A. Paniwani S. Cutrell E Hyke· A Low-Cost Remote Attendance Tracking System for Developing Regions Proceedings of the 5th ACM workshop on Networked systems for developing regions. ACM. 2011 : 15-20.
(8] Alam MJ. Kenny P , Ouellet P. O'Shaughnessy 0 . Multitaper MFCC and PLP Features for Speaker Verification Using i-Vectors. Speech Communication. 2013: 55: 237-251
(9) Chen SH, Luo YR. Speaker Verification Using MFCC and Support Vector Machine. Proceedings of the International Mulh Conference of Engineers and Computer Scientists. Hong Kong 2009, 1 18-20 (10) Nakagawa S. Wang L, Ohtsuka S. Speaker Identification and Verification by Combining MFCC and
Phase Information. Audio, Speech, and Language Processing, IEEE Transactions on. 2012: 20(4) 1085-1095.
(11) Ganchev T, Fakotakis N, Kokkinakis G. Comparative Evaluation of Various MFCC Implementations on the Speaker Verification Task. Proceedings of the SPECOM 2005, 1. 191-194.
(12) Davis S, Mermelstein P. Comparison of Parametric Representations for Monosyllabic Word Recognition in Continuously Spoken Sentences Acoustics, Speech and Signal Processing, IEEE Transactions on 1980, 28(4). 357-366
[13) Steve Y, Odel J, Ollason 0. Valtchev V. Woodland P The HTK Book. version 2.1 Cambridge University. 1997.
(14) Slaney M. Auditory Toolbox . Interval Research Corporation, Tech Rep 1998.
{15] Skowronski MO, Harris JG. Exploiting Independent Filter Bandwidth of Human Factor Cepstral Coefficients in Automatic Speech Recognition. The Journal of the Acoustical Society of Arnenca.
2004; 116' 1774-1780.
[16} Kohonen T. Self-Organized Formation of Topologically Correct Feature Maps. Biological Cybernetics.
1982; 43(1): 59-69.
[17} Kohonen T. The Self-Organizing Map. Proceedings of the IEEE. 1990: 78(9): 1464-1480.
(18) Basheer IA, Ha1meer M. Artificial Neural Networks: Fundamentals, Computing, Design, and Application. Journal of Microbiological Methods. 2000; 43(1): 3-31 .