THE IMPACT OF MANAGERIAL ABILITY TOWARDS FIRM MARKET VALUE
Stefani Yoan Setiawan Dewi Ratnaningsih
International Financial Accounting Program (IFAP) Economic Faculty
UniversitasAtma Jaya Yogyakarta Babarsari 43-44 street, Yogyakarta
ABSTRACT
This research examines the impact of managerial ability towards firm market value. I measure the managerial ability is measured using Data Envelopment Analysis (DEA). Following the research by Alex Simamora (2013), I regress managerial ability with firm market values. The result shows that the managerial ability has a positive impact on firm market value.
Keywords: managerial ability, price to book value, Data Envelopment Analysis (DEA)
.
INTRODUCTION
At the beginning establishment of a company, the owner will usually execute and manage the businesses. The owner will perform the selling activity, production activity as well as funding. As time goes on, the company will enter a growth phase; this growth phase can be seen from the increase of sales, profit, cash flows and so on. The growth phase will bring much complexity in the business and the company will encounter a competitive competition among companies (Simamora, 2013). The company is required to be able to analyze the current situation and the future, in order to develop and persist in a competitive competition (Kurnia, 2010).
Manager is one of resources, used by the company to face the environmental changes who usually has a personal skill to develop and overcome problems on
the company. Management’s roles are as follows:
1. Interpersonal Role: managers must be able to deal with other parties. 2. Informational Role: managers must able to transmit information about
an organization and its goals to the people outside it.
3. Decision Role: managers must able to solve problems that occur in company and generate new ideas which are best to be applied in company.
are managed to design the business process that is efficient and effective, and able to make decisions that create value for the company. Besides, managers also have an obligation to communicate the company’s performance to the outside parties (stakeholders) who are interested with the company. The most appropriate way for manager to communicate the company performance is through financial reports that are reported at certain period (Isnugrahadi and Kusuma, 2009).
Financial report is a picture of the company’s financial condition that are analyzed with a financial tool analysis, so it is easier to understand whether company is in a good or bad condition at a certain period of time (Ermayanti, 2009). A manager, who is capable, will usually have an accurate judgment. Accounting standards board allows manager to use judgment in making financial reports with the aim that the report which is in accordance to the condition of the business of each company will increase the value of an accounting as a form of communication (Isnugrahadi and Kusuma, 2009).
Healy and Wahlen (1999) give some forms of manager judgments, for example in the financial report, in the estimating events that have an economic value for the future as the estimated age of economical and residual value of long-term assets. Manager must also choose an accounting method allowed for reporting economical transactions like the use of a straight line methods in recording the acceleration of depreciation, or choose First in First out (FIFO) in recording the inventory. Manager must also choose to impose or suspend expenses like research and development (R&D).
In order to make an accurate judgment, manager is required to have expertise. To get the expertise, manager usually has a high level of education. Besides, the
level of a manager’s experience also determines his/her managerial ability.
Managerial ability is a skill or personal characteristics that help the performance achievement in management duty (Sulastri, 2009). Indonesian companies should have qualified or capable managers who can increase firm market value. A manager who has adequate skills is considered as an expert in his field (Ruba’i, 2009). Besides, manager who has adequate skill is considered to be more capable of estimating the policy taken towards the company.
A qualified or capable manager is believed can manage company well, which will result efficient company performance thatcan be seen or reflected through the financial report. Information contained in a financial report will be used by certain parties as investors, a creditor, manager, employees, the government and the community which for sure have different purposes.
To assess the achievement of a company, company usually needs certain measurements. The usual measurement used is financial ratios. These ratios help the user to understand better about the financial condition in a company. Financial report is very important for a company, because this financial report is expected to give positive signal to investor. Any information can be said ” it has value to investors if the information provides a response to the transaction in the capital market”.
report. Because of that, it is expected that investor will consider information in the
company’s financial report to make investment in it.
The more efficient the company performance is, it will increase the level of credibility of investors towards the company. By having this high level of credibility, investors will certainly give a positive response towards the company. If the supply remains the same, the demand of shares of the company will increase, which is resulted with the movement of share prices are likely to rise.
These rising of share prices, will increase the company’s firm market value.
Research Question
The key question of the impact of managerial ability towards firm market value can be summarized as follow,
Does managerial ability have positive impact on firm market value?
The Objective of Research
This research has an objective to prove that empirically managerial ability has positive impact on firm market value.
THEORETICAL BACKGROUND AND HYPOTHESIS DEVELOPMENT Managerial Ability
Managerial ability is a skill or personal characteristics that help the achievement of the performance in management duty (Sulastri, 2009). There are some additional skills and personal characteristics suggested by the American Assembly of Collegiate Schools of Business for college students in developing the managerial skills (Sulastri, 2009), leadership, self-objectivity, analytic thinking, behavioral flexibility, oral communication, written communication, personal impact, resistance to stress, and tolerance of uncertainty.
Managers perform functions which are critical to the performance of organizations and they are therefore generally held accountable for the performance of the organization for which they work (Wagner, 2008). Bertrand and Schoar (2003) document that managers exhibit styles that are reflected in the underlying decisions of the company (e.g., aggressive R&D investment or merger and acquisition activity). Demerjian et al (2008) said that manager specific features (ability, talent, reputation, or style) affect economic outcomes and are therefore important to economics, finance, accounting, and management research as well as to practice.
Data Envelopment Analysis (DEA)
Demerjian et al (2012) uses data envelopment analysis (DEA) for measuring managerial ability by using data from the financial report. Data Envelopment Analysis is a linear programming-based technique for evaluating the efficiency of a Decision Making Units (DMU) (Mantri, 2008). The performance of a unit is evaluated by comparing its performance with the best performing units of the sample. In the population all DMU should have a set of data consisting of the same input and output.
According to DEA, company can be said to be efficient if the ratio between output and inputs is equal to 1 or 100 %. This is indicated that the company is no longer do extravagance in the usage of input. The company is said to be less efficient if the ratio of between outputs and inputs is less than 100 %. This is indicated that the company does not use the inputs efficiently. This level of efficiency is used as a measurement of managerial ability.
Estimation of Total Firm Efficiency
Our main measure of managerial ability, the MA-Score, is the metric developed by Demerjian et al. (2012), using data envelopment analysis (DEA), a nonlinear optimization program that calculates unit-specific relative efficiency. The model is as follows:
Where:
ui: the weight of output i, which is resulted from company k. yik: the quantities of each outputs.
vj: the weight of input j, which is used by company k. xjk: the quantities of each inputs.
outputs scaled by the weighted inputs. There are s outputs and m inputs, indexed by i and j, respectively. The quantities of each output i and input j for firm k are yik and xjk, respectively. The optimization program maximizes (A1) by selecting the weights on each output (ui) and input (vj). The vectors of weights on the outputs (u) and inputs (v) are termed as implicit weights. Efficiency is based on the level of the weighted outputs to the level of the weighted inputs. The most efficient firms have the highest level of outputs for a fixed level of inputs (or equivalently, the lowest level of inputs for a fixed level of outputs). DEA calculates a unique set of implicit weights for each firm k.
The first constraint, (A2), scales the implicit weights so that the most efficient firm (or firms) has (have) an efficiency value of 1. The optimal weights for each firm k are tested for all the other comparable firms (1,. . .,n; ≠k). This calculates what the efficiency would be for each comparable firm under the implicit weights calculated in (A1) for firm k, allowing for the determination of relative efficiency. Constraints (A3) and (A4) require implicit weights to be non-negative, which prevents solutions calling for negative input levels.
Signalling Theory
Signalling theory is used to explain that a company uses the information to give a positive or negative signal to the investor. Leland and Pyle in Scott (2012: 475) explain that signaling theory is that company’s executives who have better information about the company are encouraged to provide this information to prospective investors in which the company can enhance corporate value through its reporting by sending a signal through its annual report.
Management does not fully submit all the information which will increase the firm value to the capital market, so if any information is submitted to the market by management, the market will react to the information as a signal (Listiana, 2009).
The information submitted by the manager about the good condition of the company through the financial statements is a signal that the company has done its operations well. Good signal will either be responded well by other parties or not.
Firm Market Value
The management of a company by the manager must be based on an objective which is going to be achieved. The objective is usually related to the decision making on financial field, which is used to maximize firm value. Firm value is the size of the success of company in improving the prosperity of the owners or shareholders (Suyono, 2011).
of a company. A company that has good management and always grow, will have the number of outstanding shares and the stock price is getting higher (Suyono, 2011).
In this research, the firm market value is measured by using Price to Book Value. Price to Book Value (PBV) describes how much a market value the company shares (Darmadji, 141:2001). PBV is an important indicator in the investment ratio and has already been used in various securities analysis of the world. The higher the value PBV of a share indicates there is an excess on market perception towards firm value and the contrary, if the value PBV of a share is low, then can be interpreted as a signal of good investment opportunity in the long term.
The market price is measured at the publication date, because, it is expected that
investor will consider information in the company’s financial report to make investment in the company. Besides, the book value in this model can be calculated as follows:
THE HYPOTHESIS DEVELOPMENT
One of the keys of a company's success is the existence of managers who are managed to design the business process that is efficient and effective, and able to make decisions that create value for the company. Besides, managers also have an obligation to communicate the company performance to the outside parties (stakeholders) who are interested with the company and the most appropriate way for manager to communicate the company performance is through financial reports that are reporting on certain period (Isnugrahadi and Kusuma, 2009).
Financial report is a picture of the financial condition of companies that are analyzed using a financial tool analysis, so it is easier to understand whether company is in a good or bad condition in a certain period of time (Ermayanti, 2009). A manager, who is capable, will usually have an accurate judgment. In order to make an accurate judgment, manager is required to have expertise. To get the expertise, a manager usually has a high level of education. Besides, the level of experience of a manager also determines his/her managerial ability. Managerial ability is a skill or personal characteristics that help the achievement of the performance in management duty (Sulastri, 2009).
important for a company, because information contained in a financial report will be used by investors, as guidelines on making investment decision.
If the information contained in financial report describes the efficiency of company performance, thus, implicitly, it provides positive signals to investors. According to Signalling theory (Leland and Pyle in Scott, 2012:475), the company could raise the value of the company through sending signals through its annual report. Because of that, it is expected that investor will consider
information in the company’s financial report to make investment in the company. The more efficient the company performance is, it will increase the level of credibility of investors towards the company. By having this high level of credibility, investors will certainly give a positive response towards the company. If the supply remains the same, the demand of shares of the company will increase, which is resulted with the movement of share prices are likely to rise.
These rising of share prices, will increase the company’s firm market value. From the hypothesis development above, the hypothesis of this research is:
H1: Managerial ability has positive impact on firm market value.
RESEARCH MODEL
The regression model of this research presents as follow,
Where:
Y: Firm Market Value (PBV)
α : constanta
DEA : managerial ability
SIZE : log natural of total assets
ε : error
By using confidence level of 95% or level of significant (α) = 5%, the decision criteria, H1 will be accepted if β1 is positive and the probability is (p-value) < 0.05.
Y: α + β1 DEA + β2 SIZE + ε
Firm Market Value
(Y) Managerial Ability
DATA ANALYSIS AND DISCUSSION
[image:8.595.89.533.176.550.2]The research sample selection is listed below,
Table 4.1 Sample Selection
Descriptive Statistics
The descriptive statistics describes about the mean (the central tendency of data), standard deviation, and the number of data. The outcome of descriptive statistics is listed below.
Table 4.2 Descriptive Statistics
N Minimum Maximum Mean
Std. Deviation
DEA 265 .25 1.00 .6506 .21143
PBV 265 .00 10.13 2.0540 1.93835
FirmSize 265 23.08 33.00 27.9397 1.56991
Valid N (listwise) 265
No Criteria 2011 2012 2013 Total
1 Manufacturing company which has been listed at Indonesia Stock Exchange
132 134 137 403
2 Manufacturing company
which has un-complete report of financial statement.
(9) (11) (16) (36)
3 Manufacturing company
which doesn’t use Indonesia Currency in reporting the financial report.
(10) (27) (28) (65)
4 Manufacturing firm which
doesn’t has positive equity (8) (6) (4) (18)
Total manufacturing firms data
[image:8.595.149.509.624.720.2]From table 4.2 above, it is shown that Data Envelopment Analysis Score (DEA) has minimum value 0.25, maximum value 1.00, mean 0.6506 and standard deviation 0.21143. Price to Book Value (PBV) has minimum value 0.00, maximum value 11.13, mean 2.0540 and standard deviation 1.93835. Firm Size are has minimum value 23.08, maximum value 33.00, mean 27.9397 and standard deviation 1.56991. From table 4.1, total manufacturing firms data are 284 firms. Since, some data outliers are present, 19 data out of 284 are diminished. For the need of hypothesis testing, only 265 data are used.
Normality Test
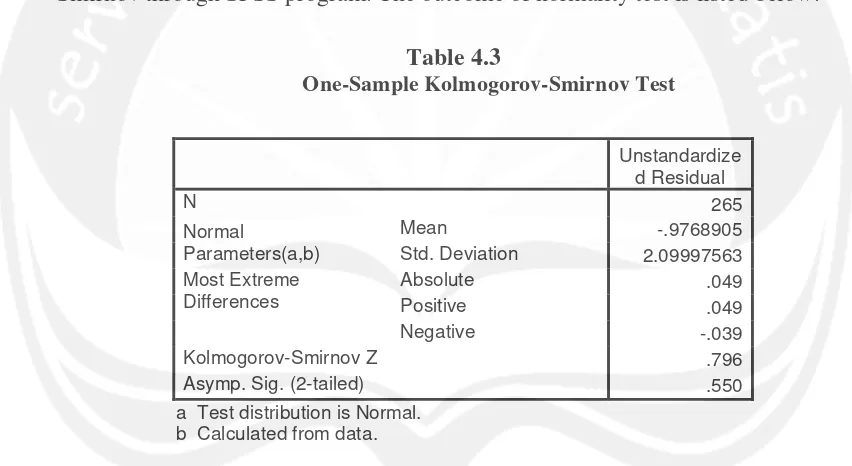
The purpose of normality test is to ascertain either data is normally distributed or data is not normally distributed. A normal data distribution is the indicator of a good regression model. The normality test can be undertaken using Kolmogorov Smirnov through SPSS program. The outcome of normality test is listed below.
Table 4.3
One-Sample Kolmogorov-Smirnov Test
Unstandardize d Residual
N 265
Normal
Parameters(a,b)
Mean -.9768905
Std. Deviation 2.09997563 Most Extreme
Differences
Absolute .049
Positive .049
Negative -.039
Kolmogorov-Smirnov Z .796
Asymp. Sig. (2-tailed) .550
a Test distribution is Normal. b Calculated from data.
The indication of normally distributed data can be observed from the value of unstandardized residual of Asymp. Sig (2-tailed). In the condition where unstandardized residual of Asymp. Sig (2-tailed) is more than significance of 0.05 (5%), it is concluded that the data is normally distributed. The outcome in table 4.3 shows the value of 0.550, where 0.550 > 0.05, in conclusion, the research data is normally distributed.
Heteroscedasticity Test
data (Harahap, 2013). The heteroscedasticity test can be undertaken through SPSS program and it can be observed from the scatterplot diagram. Graphical techniques are quite useful for detecting heteroscedasticity (Newbold, 1995). The outcome of heteroscedasticity test is listed below.
Picture 4.4 Scatterplot Diagram
Regression Standardized Predicted Value
4 2
0 -2
R
egression S
tud
enti
zed
R
esidual
4
3
2
1
0
-1
-2
From picture 4.4, it shows the group of points around 0-point of regression standardized predicted value. The indication of no-heteroscedasticity is when the points are pinpointed randomly and conversely, the outcome shows
heteroscedasticity doesn’t effect in the research data.
Autocorrelation Test
Table 4.5 Durbin Watson Test
Model R R Square
Adjusted R Square
Std. Error of the Estimate
Durbin-Watson
1 .431(a) .186 .180 1.75577 2.029
a Predictors: (Constant), FirmSize, DEA b Dependent Variable: PBV
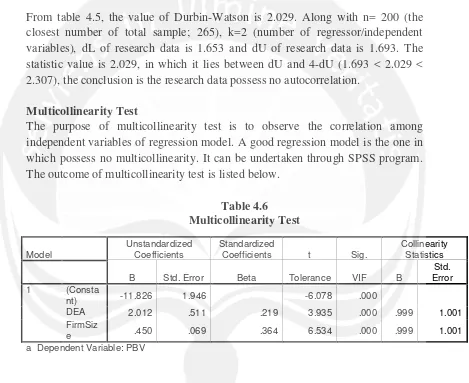
From table 4.5, the value of Durbin-Watson is 2.029. Along with n= 200 (the closest number of total sample; 265), k=2 (number of regressor/independent variables), dL of research data is 1.653 and dU of research data is 1.693. The statistic value is 2.029, in which it lies between dU and 4-dU (1.693 < 2.029 < 2.307), the conclusion is the research data possess no autocorrelation.
Multicollinearity Test
The purpose of multicollinearity test is to observe the correlation among independent variables of regression model. A good regression model is the one in which possess no multicollinearity. It can be undertaken through SPSS program. The outcome of multicollinearity test is listed below.
Table 4.6 Multicollinearity Test
Model
Unstandardized Coefficients
Standardized
Coefficients t Sig.
Collinearity Statistics
B Std. Error Beta Tolerance VIF B
Std. Error 1 (Consta
nt) -11.826 1.946 -6.078 .000
DEA 2.012 .511 .219 3.935 .000 .999 1.001
FirmSiz
e .450 .069 .364 6.534 .000 .999 1.001
a Dependent Variable: PBV
[image:11.595.87.556.231.614.2]Hypothesis Testing
The purpose of hypothesis testing is to measure the impact of independent variable towards the dependent variable. It can be undertaken through SPSS program. The outcome of hypothesis testing listed below.
Table 4.7
Regression of Hypothesis Testing
Model
Unstandardized Coefficients
Standardized
Coefficients t Sig.
B Std. Error Beta B Std. Error 1 (Constant) -11.826 1.946 -6.078 .000
DEA 2.012 .511 .219 3.935 .000
FirmSize .450 .069 .364 6.534 .000
R = 0.431 R Square = 0.186
Adjusted R Square = 0.180 F = 29.880
F. Sig = 0.000
Tabel 4.7 shows that adjusted Rsquare is 0.180. It can be interpret that there is a correlation between independent and dependent variables. The value of DEA is significant (0.000). The value of β1 is positive (2.012). It means that managerial ability has positive impacts on firm market value. The value of firm size is significant (0.000). The value of β2 is positive (0.450). It means that firm size is positively affects the firm market value.
Discussion
From hypothesis testing outcome, β1 is positive and significant, it indicates managerial ability has positive impact on firm market value. It means, the more qualified or capable manager will result to the efficiency of company performance that can be seen through the financial report. If the information contained in financial report describes the efficiency of company performance, thus, implicitly, it provides positive signals to investors.
CONCLUSION AND SUGGESTION
Conclusion
This research explores the impact of managerial ability towards firm market value by using sample of 265 firms listed in BEI during period 2011-2013. It concluded that, managerial ability has positive impact on firm market value. It means, the more qualified or capable manager will result to the efficiency of company performance. Moreover, a manager who has adequate skill is considered to be more capable of estimating the policy taken towards the company that will
increase the company’s firm market value.
From the results of this research that shows, managerial ability has positive impact on firm market value, the owners of the company must be more selective in choosing manager as a person who manages the company in order to increase the firm market value of the company. The owner of a company should choose a qualified and capable manager in order to fulfill the objectives of the company in improving the prosperity of the owners or shareholders (Suyono, 2011).
Suggestion
Suggestions for subsequent similar research are as follows:
1. This research is using input and output that can only be applied in the manufacturing industry in counting the DEA score. If there are, the input and output found to calculate the DEA score of other industries. The subsequent research can use the samples of other industries in addition to manufacturing industry.
2. This research is using only one control variable (firm size), the subsequent research can find other control variable that will strengthen the dependent variable. The subsequent research can also add moderating variable to strengthen the independent variable.
REFRENCES
Demerjian, P., B. Lev and S. McVay, 2008, Quantifying Managerial Ability: A New Measure and Validity Tests, Management Science.
Demerjian, P., B. Lev, S. McVay and M. Lewis, 2010, Managerial Ability and Earnings Quality, Accounting Review.
Djuitaningsih, T. and A. Rahman, 2011, Pengaruh Kecakapan Manajerial Terhadap Kinerja Keuangan, Media Riset Akuntansi Volume 1, No. 2.
Ghozali, Dr Imam, M.Com, Akt, 2001, Aplikasi Analisi Multivariate dengan Program SPSS, Badan Penerbit Universitas Diponegoro, Semarang. Isnugrahadi, I. and I.W. Kusuma, 2009, Pengaruh Kecapakan Manajerial
Terhadap Manajemen Laba dengan Kualitas Auditor sebagai Variabel Pemodarasi, SNA XII, Palembang.
Ji’ah Ana, Diyah Pujiati, 2013, The Differences in Dividend Payout Ratio and Market Performance of Companies that Perform and Do not Perform Real Activities Manipulation, Surabaya.
Mantri, J.K, 2008, Research Methodology on Data Envelopment Analysis (DEA), Universal-Publisher, Florida.
Mintzberg's Management Roles
-http://www.mindtools.com/pages/article/management-roles.htm
Nur Rohma, Yolanda, 2013, Tugas Asas-asas Manajemen “Manajemen dan
Manajer”, Sumatra Selatan.
http://www.academia.edu/5415980/Pengertian_Manajemen_Mana ge ment_dan _Manajer_Manager_
Relative Valuation Models: The Fed Model, The Yardeni Model, The P/10-Year MA(E), Tobin’s Q, and Equity Q. 2013. http://cfatutor.me/tag/tobin-q/ Sentosa, Perdana Wahyu, 2011, Memahami Price to Book Value (P/BV).
http://www.imq21.com/news/read/44419/20111104/121318/Mema ha mi-Price-to-Book-Value-P-BV-.html.
Simamora, Alex Johanes, 2013, Pengaruh Kecakapan Manajerial terhadap Nilai Perusahaan dengan Kepemilikan Manajerial sebagai Variabel Pemoderasi, Yogyakarta.