DOI: 10.12928/TELKOMNIKA.v14i4.3505 1446
Water Quality Monitoring with Fuzzy Logic Control
Based on Graphical Programming
Mochammad Hannats Hanafi Ichsan*1, Wijaya Kurniawan2, Miftahul Huda3 1,2,3
Faculty of Computer Science, University of Brawijaya,
Jl. Veteran Malang, East Java, Phone: +62 341 551611/ Fax +62 341 565420 *Corresponding author, e-mail: [email protected], [email protected],
Abstract
Water quality is the most important aspect to ensure success in various aspects of life, for example in the shrimp ponds. On a shrimp pond, water conditions are very vital because it has a very strict threshold. Unstable water conditions will affect growth and condition of shrimps, eat passion of shrimps, until their ability to survive greatly affect the survival of the shrimps. The percentage of farmers harvesting shrimps if the water did not have good conditions then the farmers will suffer significant losses if yields were not as expected, began from the amount of shrimp that was reduced due to death or the quality of the shrimp were judged from the size of the shrimp. So the authors wanted to do research on how to maintain the quality of the water in shrimp pond so that the water quality is maintained. To overcome this, we need to monitor water conditions based on the level of salinity and turbidity of water in order to stay in good condition. In this case, the researchers used fuzzy logic to monitor the amount of water quality and water volume. In this study only conducted water quality monitoring process but to do water changes to a certain condition still conducted manually. As well as the programming language used as the NI LabVIEW graphical programming with the application form to see monitoring of water quality so that water conditions are well preserved.
Keywords: salinity, turbidity, labview, fuzzy logic control, graphical programming
Copyright © 2016 Universitas Ahmad Dahlan. All rights reserved.
1. Introduction
Water is the most important thing is in the aspects of life, such as households, farms, ponds, etc [1]. One of the vital water utilization was in the shrimp ponds. Water quality in shrimp ponds has an important role determine the success of the crop [2]. Poor water quality conditions will greatly affect the health of shrimps and farmers threatened with crop failure even if the pond water too clean, shrimps will not grow well. Some of the factors that affect the quality of water turbidity and salinity ponds. Several factors as determinants of water quality shrimps (Vannamei types for example) is the level of salinity of 19-25 ppt (part per thousand), while for the turbidity of 3-15 ppt. So the value of salinity and water turbidity should remain balanced.
Water that has low salinity was dangerous because it will decrease the oxygen that would cause the thin-crusted shrimps, it usually occurs during the rainy season due to the increase in water flow due to the rain that has a high acid content. While salinity was too high will reduce their growth, this usually occurs during the dry season [3]. As shrinking water discharge but the amount of clay, organic [2] and inorganic compounds, plankton and other microorganisms strongly suspected as the cause of the water turbidity [4]. Turbidity of pond water greatly affect the growth shrimps, because if the water is not turbid, the sunlight absorbed in the water would be too much. This will cause the shrimp growth was not optimal, although the shrimp even though plankton need sunlight for growth [5].
data and commands between input and output [8] as was done well in previous studies to monitor the irrigation channel.
Therefore it is necessary a system that can monitor water conditions in real time so that the farmer/user can monitor water quality at any moment and can replace or add water so that water quality maintained. The development of this system will be conducted in the form of hardware and software monitoring water quality using fuzzy logic control based on the level of salinity and water turbidity pond. Hardware that will be used was sensor salinity (salt), sensors turbidity (turbid), Arduino Mega microcontroller and LED indicators would implement with LabVIEW.
2. Research Method
This section describes the methods and hardware research procedures. How to use the sensor needs and design of fuzzy logic. Description of needs and their references so that the flow explanation of the system that can be used in Figure 1.
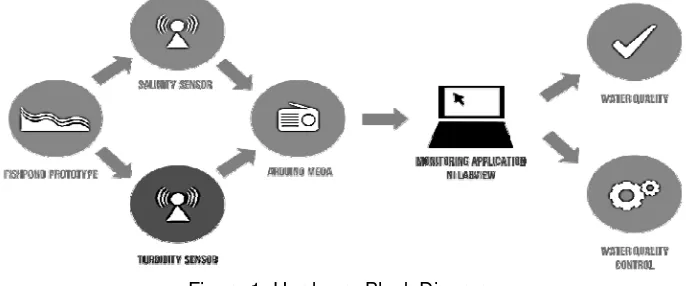
Figure 1. Hardware Block Diagram
This system will be made in the form of a prototype of a pool of water, where the water pools will be given two sensors, namely salinity sensor and turbidity sensor. Two of these sensors will provide an output voltage on the microcontroller. Microcontroller used is Arduino Mega. After Arduino gets the data from the sensor, then he will transmit the data to monitoring applications that have been created using LabVIEW. In such applications, the data of salinity sensors and sensor turbidity will be processed using fuzzy logic. So that the water quality data can be monitored quality. On the application of data obtained in real-time so that any slight change in water conditions, will be read in the monitoring system.
2.1. Sensor
Salinity and turbidity sensors used by the researchers generated data such as voltage output with a range of 0-5V. While the required data input form from the sensor is converted in the form of Part Per Thousand (ppt) to salinity and Nephelometric Turbidity Unit (NTU) with a range of 0-50ppt and 0-50ntu. To overcome this problem researchers apply Analog to Digital Conversion (ADC) [5, 9] as found in
Figure 2. Based on
Figure 2, the data from the salinity sensor 0ppt 1,7v as default and 3.7V as the maximum value 50ppt after conversion. While turbidity sensor produces 0,3v as default 0ntu and 1,3v maximum value 5ntu.
2.2. Fuzzy Logic Control
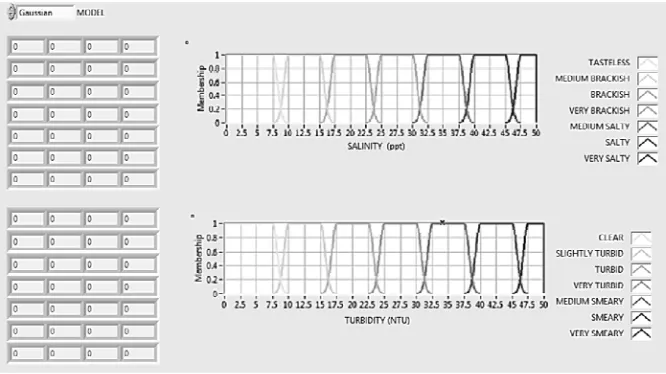
conditions a very vital in many aspects [11] A little water conditions was not precise will be harmful to living things in their environment. Therefore, Fuzzy models used by researchers is the Gaussian model. The membership functions used consisted of seven membership function for each input data. Fuzzy logic can be applied to give a specific value corresponding [12, 13], so in this application provided a feature to edit the membership functions.
Figure 2. ADC Salinity and Turbidity Sensors
Users can edit the membership function by filling the array contained in the left column in Figure 3. Meanwhile, if you want to change the model of Fuzzy to which the user can press the button switch "Model" which located at the top left of the application. "Model" is available here for models from MF example gaussian, trapezoid or triangle. In the left column can be put restrictions into direct value of membership function, fuzzy logic functionality is already provided by LabVIEW so easy to implement.
Figure 3. Fuzzy Logic Membership Function
2.3. Analysis Methods
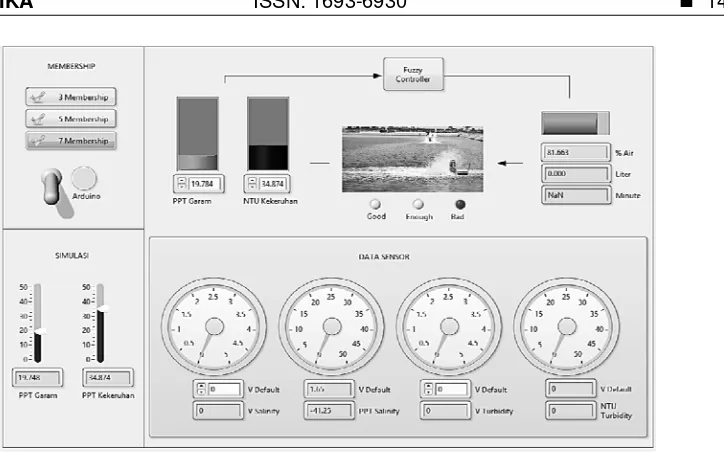
Figure 4. Application of Pond Water Quality Control
Based on Figure 4 the bottom right used to calibrate the sensor. In the picture, there are 4 circles, two circles used to calibrate the salinity of the sensor and then be used for calibration of turbidity sensors. So if performed in a swimming pool displacement smaller or larger, it is possible again to recalibrate. With this functionality will provide a lot of additional features for the system to work better and can be implemented on the condition of different pools.
2.4. ADC Sensor Calibration
Each sensor calibration ADC, to ensure whether the data obtained in accordance with a design that has been created. Based in
Figure 5 shows the ADC calibration salinity sensor produces an output voltage 1.5v default. For salinity sensor requires a long time, because of the influence of the water that soaked the foot sensor while the pool so large that it cause the readings less than the maximum.
Figure 5. Salinity Sensor Calibration ADC
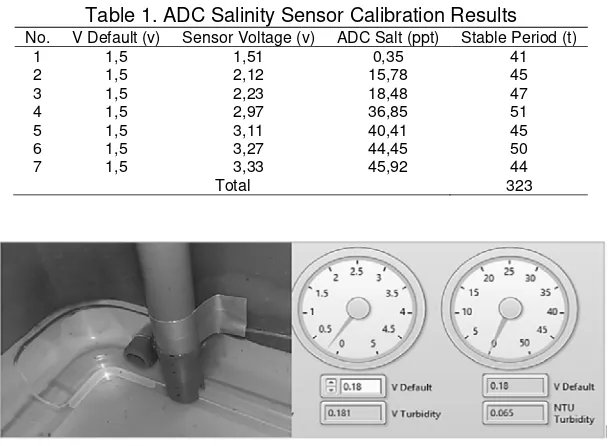
From Table 1, shows the results of ADC in accordance with the design of the system, but the time for the output of the sensor stable long enough salinity. To test seven samples requires 323 seconds or less than five minutes. Meanwhile, the turbidity sensor calibration tends to be more appropriate than the salinity sensor, although the default condition sensor able to changed easily.
There are in Figure 6 shows the results of the turbidity sensor calibration ADC produce output voltage 0,18v default.
turbidity sensor indicates the total number of only 78 seconds or one minute by seven test samples.
Table 1. ADC Salinity Sensor Calibration Results
No. V Default (v) Sensor Voltage (v) ADC Salt (ppt) Stable Period (t)
Figure 6. ADC Turbidity Sensor Calibration
Table 2. Results of ADC Calibration Turbidity Sensor
No V Default (v) Sensor Voltage (v) ADC Salt (NTU) Stable Period (t)
Based on the results of the design to implementation, testing for sensor calibration has been done but have not been tested to perform testing of fuzzy logic that has been designed. The purpose of this test is to assess the level of success, failure, and deficiencies of the system that has been designed.
3.1. Pond Water Quality Control
In this test scenario, testing was conducted by comparing the results of water quality through LED indicator software and hardware after water conditions deemed to be replaced was conditioned in accordance with the control output of the system. Error obtained from the scheme is not great only 0.62 only can be seen in Table 3. Error results obtained from testing the sensor inputs to the membership function that has been made.
Table 3. Error Output Model Fuzzy
The next stage of the test scenario was to determine the sensor data. Sensor data are given at random or random until the LED indicator lights up in the three conditions "Bad", "Enough", and "Good" to see the results of the monitoring of each of these conditions. The total volume of water that must be replaced will appear at the output of the monitoring system. Because this study only monitoring, water change performed manually.
Based on the test results in Table 4, the whole experiment produces good water quality, although the percentage of the input or volume of water each a different membership. In tests, the percentage or volume of water affects the length of time on testing. The worse the quality of the water, the longer duration required to change the water until the water of good quality. Here is photographic evidence of poor quality water test start from water in critical condition until the water in good condition for shrimp pond.
Table 4. Water Quality Test Results
No p0 p1 a0 volume h0 h1 a1 s
1 4,7 46,6 Bad 96 3,9 41,4 2,7 Good 357 2 34,8 24,2 Enough 39 1,6 37,3 5,9 Good 60 3 39,7 3,0 Good 24 1,0 40,9 2,0 Good 48
Time Total (s) 465
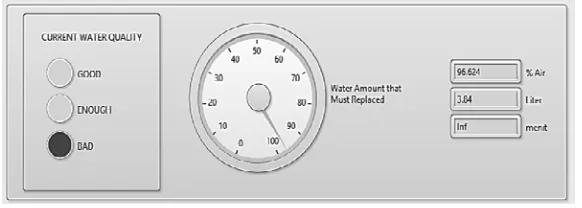
The actual water conditions can be seen Figure 7, while in the program interface, the measurement results are contained in Figure 8. in the image shows that the water conditions "Bad". At the top right column shows the number of liters of water that must be replaced in order to be good or incoming water conditions "Good" or at the center of the image.
Figure 7. Water Condition Before controlled
The initial condition of water in Figure 8, the water conditions before controlled "Bad", the color looks very intense water, thus fall into the category of "bad". In addition to the LED indicator lights up on the left side of the application, which means poor water conditions and should be replaced until the water quality to be good. Figure 8 is a representation of the data processing system taken from the water in Figure 7 is seen that the water very turbid.
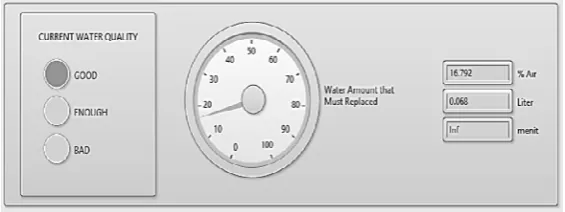
The condition of the water after is replaced or supplemented with other water conditions in Figure 9, then testing the system. The water conditions after controlled well, the color looks on the dark water becomes clearer than the water condition in Figure 8. In addition to monitoring the application, show increased salt and lower ppt NTU turbidity which indicates that water conditions are better than ever. Black LED indicator lights up on the application, which means good water conditions have changed like in Figure 10.
Figure 9. Water Condition after Controlled
Figure 10. Water Indicator In Monitoring Systems After Controlled
The upper left column in Figure 10, black colored indicators move to the indicator "Good" which means indicates that the water quality is good. At the top center of the image also shows the condition of the water that must be replaced smaller than in Figure 8. This shows that the system has been run in accordance with what was expected earlier.
4. Conclusion
This system has made a good communication between the sensor, microcontrollers and LabView working in accordance with the wishes. LabVIEW provides features fuzzy logic designers fairly easy to applied by the user. But fewer problems with sensor because the water input does not directly read fast, it takes a long time to read with appropriate water quality. This relates to the process of mixing water intake when given a particular input quality water and wait for the water and the water feedback from the system.
that no manual process. as well as water mixing process can be done more quickly if added to accelerate the process of mixing water. In addition, factors that affect the water quality of the pond there are two, namely salinity and turbidity, so there are two input flow of water to the control system.
References
[1] Bhandari V, Abrol P. Field Monitoring of Treated Industrial Waste Water. IJECE. 2013; 3: 629-634. [2] Boyd EC, Tucker CS. Pond Aquaculture Water Quality Management. New York: Springer Science.
1998.
[3] Zimmerman RJ, Minello TJ, Zamora G. Selection of Vegetated Habitat by Brown Shrimp, Penaeus Aztecus, In Galveston Bay Salt Marsh. Fishery Bulletin. 1964; 82(2).
[4] DeZuane J. Drinking Water Quality. Second Edition. Danvers: Clearance Center. 1996.
[5] Xie J, Sun XH, Pan JY, Zhao Y. Physicochemical Properties And Bactericidal Activities Of Acidic Electrolyzed Water Used Or Stored At Different Temperatures On Shrimp. Food Research International. 2013; 47(2): 331-336.
[6] Chao J, Wu-bin X, Bing L. Design of Instrument Control System Based on LabVIEW. TELKOMNIKA Indonesian Journal of Electrical Engineering. 2013; 11(6): 3427-3432.
[7] Thepsatorn P, Numsomran A, Tipsuwanporn V, Teanthong T. DC Motor Speed Control using Fuzzy Logic Based on LabVIEW. In SICE-ICAS, International Joint Conference. 2006.
[8] Zhengjun Q, Xiaoxing T, Jiehui S, Yidan B. Irrigation Decision-Making System Based on The Fuzzy-Control Theory and Virtual Instrument. ACSES. 2013; 8.
[9] Luo J, Ault JS, Larkin MF, Barbiery LR. Salinity Measurements from Pop-Up Archival Transmitting (PAT) Tags and Their Application to Geological Estimation for Atlantic Tarpon. Marine Ecology Progress Series. 2008; 367: 101-109.
[10] Duque WO, Huguet NF, Domingo JL, Schuhmacher M. Assessing Water Quality in Rivers with Fuzzy Inference Systems. Environmental International. 2006; 32(6): 733-742.
[11] Glennon R. Groundwater Pumping and The Fate of America Fresh Waters. Washington DC: Island Press. 2002.
[12] Ichsan MHH, Yudaningtyas E, Muslim MA. Optimal Solution Path Finding Using Fuzzy-Dijkstra Hybrid Algorithm. EECCIS. 2013; 6(2): 155-160.