THE IMPACT OF EMBEDDED GENERATION DUE TO HARMONIC
PERFORMANCE
AZIAH KHAMIS
MATTHEW ARMSTRONG
MARIZAN SULAIMAN
(2009 Third Asia International Conference on Modeling & Simulation)
UNIVERSITI TEKNIKAL MALAYSIA MELAKA
2009 Third Asia International Conference on Modelling & Simulation
The Impact of Embedded Generation due to Harmonic Performance
Aziah Khamis, Matthew Armstrong, Marizan Sulaiman
Department of Power Industry,
Universiti Teknikal Malaysia Melaka (UTeM),
75450 Ayer Keroh, Malacca, Malaysia.
Email: [email protected]. my/ azi
_
Abstract
The paper investigates the most suitable location of inverter connection installed into the distribution line feeder. Thus, it can reduce losses, control voltages as well as the protection system [1}-[8}. Besides, it is more focused on mitigated a whack-a-mole phenomenon due to its fifth and seventh harmonics. Whack-a-mole phenomenon occurs as an active filter or passive filter installed on the long feeder line. It effect harmonic voltage where increase on some busses and decrease on other busses, especially at point of installation {9}. In this paper, the inverter replaced by directly connected with the current source. Thus, parallels current source with combination of fundamental, third, fifth and seventh harmonic frequencies were tested. From the analysis, the best location of inverter current source should be at least
:X
from end bus [JO}. Thus, it proves by looking into its harmonic voltage, harmonic current and total harmonics distortion (THD) performance.1.
Introduction
Generally, many distributed generation (DG) such as photovoltaic array should be connecting with power electronic devices as shown in Figure 1. It is use to inject unity power factor sinusoidal current into the grid. Besides, it used to convert DC power into AC. The voltage level as well as the frequency had to be match with the power of the distribution line feeder. This additional power converter should represent minimum impact to the harmonics and it should not generate significant level of harmonics.
Second Stage
i- - - -
-_-L セ@ - - --ii
-"-'-"!.-S''11'_ 1: I
II
Feeder , iII' ! '
Photovoltaic
ilセ@
,11I
MMセZi@
Inverter - _ _ _ _ c __
-_c::
Distnbution Linc Ii iセMMセ@
II
'IL _______________ jセ@ _____ J
Figure l: Block diagram ofDG network system
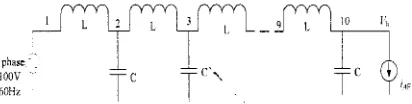
In this paper, the modeling and the parameter of distribution line feeder is base on Wada et al [9). It used lumped-circuit with per-kilometer parameter. The model is set combination of capacitance and inductance that is uniformly discrete in the radial trunk feeder without any branch of the feeder as depicted in Figure 2. Besides, an active filter is installed at the end of the feeder line. The active filter should act like impedance characteristic [l 0). This is due to the elimination of whack-a-mole phenomenon. The purpose of an active filter is to damp out harmonic propagation throughout the feeder line. The harmonic voltage can be detected by simply compesenting a current injected into the feeder line.
MセMヲWQh@
lphase
l l .
__l_¢
ioov --
Tc
Tc'·
Tc
60Hz , 14
F
Figure 2: Distribution line feeder with lumped parameters
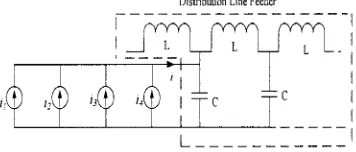
[image:2.597.271.506.255.340.2] [image:2.597.278.484.540.592.2]Figure 3. The parameter is base on ideal value of inverter that connected into the grid system. It used same characteristic of inverter with different effect of frequency. The parameter used can be illustrated in Table I.
Distnbut10n Line Feeder
iZセ@
,,I
Figure 3: Combination of inverter current with different frequency harmonics
Table I: Parameter of inverter current source
Frequency
f
Current (Hz) inverter i (A)i1 60 8
i1 180 0.1
i3 300 0.12
i-1 420 0.13
2. Frequency, wavelength and feeder
length
The relationship between frequency, wavelength and feeder length would effect the location of active filter installation [9]. Generally, the relationship can be illustrated using the following equation.
IL=-1-JJLC
where A represents the wavelength and
f
represents frequency.(I)
As the installation of active filter is on y <
'%
at end of the bus feeder, the most effective harmonics damping would exists (note that y represents the feeder length of the distribution line feeder). However, this is acceptable respectively with the position of harmonic voltage or current source. Whilst, for y >'%
as an active filter represents as an impedance characteristic, the whack-a-mole would be eliminated throughout the feeder. This would correspond to the so-called 'termination' in transmission line theory [10]. Thus, the harmonics current source should be existed at distance%
from end bus (Y-Y1=
'%).
Hence, the highest value of harmonic voltage appeared at'%
515
from bus 1. As state in Wada et al [9], the installation of the inverter current source can be determined using this equation.
(2)
where y is the total length of the feeder and y1 is the
length of feeder line that should allocate the inverter current source.
3. Total Distortion Harmonics (THD)
THD signal is the measurement of harmonic distortion. It is the ratio between total harmonic components with fundamental frequency, which usually state in percentage value [11].
セHィRIR@ + (h,)2 + ... + (hn )2 (3)
THD= . xl00%
h1
where h;, h3, ••. , hn represent the n
1
h harmonic
distortions and h1 is the fundamental harmonic.
4. Experiment Result
4.1 Single-source Inverter
The experimental and simulation using Wada et al [9] model had been done. Throughout the model, the analyses due to best location of inverter current source were studied. All possible locations were tested. From the analysis, the suitable location of inverter current source should be existed at least
'%
from end bus (y-y 1 =
'% ).
This is caused by the relationship betweenwavelength, frequency and feeder length. Besides, it is due to mitigation of whack-a-mole effects [9], [IO]. This can be proved using the equation (2).
As state in Wada et al [9], the best location of inverter current source should be at least
'%
from end bus (y-y1 ='% ).
For example, let say the location ofinverter current source at fifth harmonic want to be determine. From equation (1 ), value of A at fifth harmonic frequency would give 18.35 km. As the total length of feeder line tested is I 0 km long. Thus, from equation (2),
10-l = 18.35
x
4
[image:3.595.43.221.124.200.2] [image:3.595.45.214.265.345.2]Hence, the possible location of the installation of inverter current source should be at 6 km of the bus, which is at bus 6.
Figure 4 show simulation of voltage-magnifying
factor when an inverter current source installed at bus
6 and bus 2. The graph used Kv=l/z as its reference
data. This means that it just directly connected with an active filter at end of the bus without any additional inverter current source inject at the distribution line feeder. The harmonic voltage appeared would be
approximately equal to bus 1. Thus, it can mitigate a
whack-a-mole phenomenon. The comparison between the reference data (Kv=l/z) and inverter current source installed either at bus 6 or at bus 2 were done. As the inverter current source injected into bus 2, the highest harmonic voltage appears at bus 3. This would give slightly different simulation data compare to the references (Kv=l/z). The fifth-harmonic voltage at bus
3 magnify by 1.1 than bus 1. However, the harmonic
voltage would equal to bus I at the end of bus.
As the inverter injected into bus 6, higher harmonic voltage appears at bus 5. Besides, an equal harmonic
voltage of bus I would appear at the end of bus. It is
quite similar to the reference result simulation. Thus, it
implies that installation of inverter at distance of
-X
from the end bus would mitigate the whack-a-mole phenomenon.
Figure 5 shows the effect of harmonic current as
inverter injected into bus 6. The lowest harmonic
current appears at bus 5. This is inversely proportional with the harmonic voltage result. Thus, an impedance characteristic is proved due to Ohm's Jaw.
I.
...
E
u
セ@ I I ' ' t I
bIJ 0.8 i::
_____ ,_ ______ ,_ ______ ,_ ______ ,_ ______ ._ ______ ,_ _____ _
s
ᄋセPNV@
ro
E I
<!)
bIJ
E 0.4
0
>
0.2
'---+---!---$Us 6 •
I I ' '
I I I ' l
--- ---:---:----i<v=
ftz
ッNッセセMセMセMセMセMセMセMセセ@
I 2 3 4 5 6 7 8 9
Number of Bus
Figure 4: Effect of fifth harmonic voltage
10
QNRNMMMMMMMMMMMMMMMMMMセ@
1.0
' ' '
__ ,_ ______ ,_ ______ ,._
'---;---Klis 6 :
0.2 --- セMMMMMMZ@ MMMMMセMMMMMMセMMMMMMBMMMMMMBMMMMMMZMMM
ッNッセセセセMセMセMセMセMセMセセ@
I 2 3 4 5 6 7 8 9 10
Number of bus
Figure 5: Effect of fifth harmonic current
The possible location for seventh harmonic can be determined. However, the length of the feeder line had
to be adjusted. A for seventh harmonic is 13 .1 km
which would give
-%
as 3.38 km. Thus, the length ofthe feeder can be adjusted to 7 km and the possible location for inverter is injected at bus 4. As the inverter injected into bus 4, higher harmonic voltage appears at bus 3. Besides, an equal harmonic voltage of bus I would appear at end of bus. Thus, it implies that
installation of inverter at distance of
-X
from the endbus would mitigate the whack-a-mole phenomenon.
This can be seen in Figure 6.
QNTNMMMMMMMMMMMMMMMMMMセ@
1.2
2
i.o
u
セ@
bIJ .5 0.8
セ@
·a
Oil
a
o.6I
<!)
セ@
0 0.4
>
0.2
/;b::•<•···
MMMM\セZMᆳ
----' - ----
jMMMMMMMMセMMMMMMM
: : kセャOコ@
.____ ___ ---Bus4
"
ッNッセMセMセMMセMセMセMMセMセ@
1 2 3 4 5 6 7 8
Number of bus
4.2 Multiple-Source Inverter
Figure 7(a) shows the effect of harmonic voltage as set combinations of frequency harmonic were installed at bus 2. In this case, the harmonic voltage effect would be higher at bus 5 and bus 6. The harmonic voltage is approximately equal to bus 1 at the end of bus. Thus, the whack-a-mole phenomenon is occurred. Whilst, the highest harmonic voltage appeared at bus 5 as combination of frequencies harmonic installed at bus 6 as shown in Figure 7(b ). The harmonic voltage is approximately equal to bus 1 at end of bus. Thus, the whack-a-mole phenomenon is mitigated. This proves that the most suitable location for harmonic current source is at distance of
-X
from end bus.lioセMMMMMMMMMMMMMMMセ@
0.96
1 2 3 4 5 6 7 8 9 10
Number of bus (a): Harmonic voltage at bus 2 1.10
1.08 .... セ@ 1.06
セ@
bl)
;f
1.04·c:
bl)
g
1.02I v
bl)
.s
1.000
>
0.98
0.96
I 2 3 4 5 6 7 8 9 10
Number of bus (b): Harmonic voltage at bus 6 Figure 7: Effect of harmonic voltage
517
4.3 THD performance of Multiple-source
Inverter
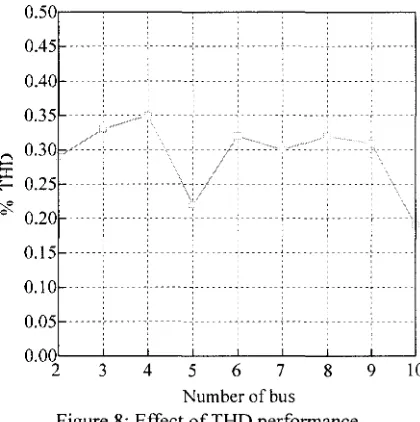
Figure 8 show the THD effect as combination of harmonic current source is injected at bus 6. It shows that it would give lower THD performance at bus 5. Thus, it would identical with the mitigated the whack-a-mole phenomenon. Besides, it proved that the location of inverter should be
-%
from end bus.ッNッセセセjMセTセセUMセVMMWセセXMMYMMQP@
Number of bus Figure 8: Effect ofTHD performance
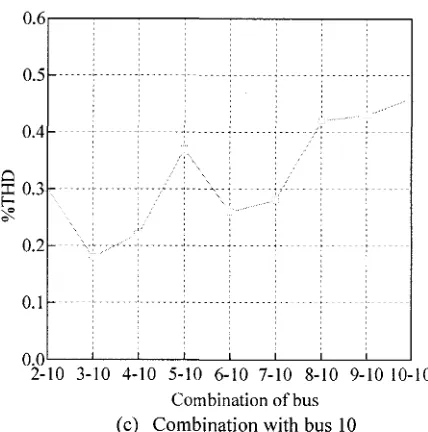
Figure 9 shows the effect as two set combination of harmonic current injected into the feeder line. It shows that the sinusoidal wave of graph trend would appear as the both similar set of harmonic current source applied to the feeder line. From the analysis, there would be several possible location of combination inverter can be installed into the feeder. The location of inverter should give lower THD performance. Thus, effectively to mitigated fifth and seventh harmonics. Besides, the whack-a-mole phenomenon would also be mitigated. There would be three possible effective locations to install the harmonics current source. The location would be at bus 6 and bus 2, bus 8 and bus 3, and also bus 6 and bus 10. ,Thus, it is proven that the
"
harmonic current source should be located at
-X
orYi
from end bus. It would give lower THD performance and mitigated fifth and seventh harmonics. [image:5.598.277.487.189.400.2] [image:5.598.24.242.247.668.2]Table 2: THD data performance
Combination THD 180 Hz 300 Hz 420 Hz of inverter (%) (h3) (h5) (h7)
Cl
::c
f-';?_ Q
Cl
::c
f-セ@
Bus 6-2 0.29 0.12 % 0.19 % 0.18 % Bus 8-3 0.27 0.17 % 0.19 % 0.10% Bus 6-10 0.26 0.21% 0.15% 0.05%
0.1
ッNッセMセMセMセMセMセMセMセMセ@
2-2 3-2 4-2 5-2 6-2 7-2 8-2 9-2 10-2
Combination number of bus
(a) Combination with bus 2
PNVセMMMMMMMMMMMMMMM
0.1
ッNッセMセMセMセMセMセMセMセセ@
2-3 3-3 4-3 5-3 6-3 7-3 8-3 9-3 10-3
Combination number of bus
(b) Combination with bus 3
Cl
::c
0.3f-';?_
Q
0.1
ッNッセMセMセMセMセMセMセMセMセ@
2-10 3-10 4-10 5-10 6-10 7-10 8-10 9-10 10-10
Combination of bus (c) Combination with bus 10
Figure 9: The effect ofTHD performance
5.0 Conclusion
This paper has described the suitable location of inverter current source in feeder line. It used the lump-circuit with per-kilometer parameter as a model for the simulation. From the analysis, the suitable location of inverter installation should be existed at least
-X
orYz
from end bus. Thus, the suitable location of inverter installation for fifth harmonics should be at bus 6. Besides, as ideal situation is applied, the best location of inverter installation is still at bus 6 for fifth harmonics effects. While, for seventh harmonic is at bus 4 with length of feeder is 7 km. Thus, the whack-a-mole phenomenon can be mitigated. Besides, there would be several combination of set harmonic current source that can be injected into the feeder. The combination of bus can be either at bus 6 and bus 2, bus 8 and bus 3, or bus 6 and bus 10. All these combination would give lower THD performance and also the fifth and seventh harmonics. From this analysis, it proved that the suitable location of inverter installation existed at least セN@ orYz
from end bus. This is due to mitigation of whack-a-mole phenomenon as well as its fifth and seventh harmonics.6. Acknowledgement
[image:6.597.269.483.60.276.2] [image:6.597.26.241.75.635.2]Faculty of Electrical Engineering, Universiti Teknikal Malaysia Melaka (UTeM).
7. References
[!] Daly and Morrison (2001) "Understanding the Potential
Benefits of Distributed Generation on Power Delivery
Systems" Rural Electric Power Conference, 200 I. USA:
Little Rock, AR.
[2] Slootweg and Kling (2002) "Impact of Distributed
Generation on Power System Transient Stability", Volume 2,
pp 862-867.
[3] Wang and Nehrir (2004) "Analytical Approaches for
Optimal Placement of Distributed Generation Sources in
Power Systems", IEEE Transaction on Power System,
Volume 19, No. 4, November 2004.
[4] Iyer, Ghosh and Joshi (2006) "Power Flow Control in a
Distribution System through an Inverter Interfaced
Distributed Generator", Power Engineering Society General
Meeting, 2006, IEEE.
[5] Zoka, Sasaki, YoMo, Kawahara and Liu (2004) "An
Interaction Problem of Distributed Generators Installed in a
MicroGrid" Volume 2, pp 795-799.
[6] Silvestri and Berizzi (1999) "Distributed generation
planning using genetic algorithms", Electric Power
Engineering, 1999, Power Tech Budapest 99 International
Conference. Hungrary: Budapest.
[7] Alvarado F.L (2001) "Location Aspects of Distributed
Generation" Volume I, pp 140.
[8] Coles R. L (2001) "Distributed Generation Can Provide
an Appropriate Customer Price Response to Help Fix
Wholesale Price Volatility", IEEE Power Engineering
Society 200 I Winter Meeting, Colom bus, Ohio.
[9] Wada, Fujita and Akagi (2002) "Consideration of a Shunt
Active Filter Based on Voltage Detection for Installation on a
Long Distribution Feeder", Volume 38, No. 4, pp 1123-1130.
[IO] Ackermann, Anderson, Sader and Lennart (200 I)"
Distribution Generation: A Defination", Electric Power
System Research 57, pp 195-204.
[11] Ackermann, Andersson and Soder (2000) "Electricity
Market Regulations and their Impact on Distributed
519
Generation", Electric Utility Deregulation and Restructuring
and Power Technology 2000, Proceeding, DRPT 2000,