GENETIC STRUCTURE AND VARIATION OF FIVE
Shorea leprosula
NATURAL POPULATIONS BASED ON
MICROSATELLITE MARKER
MAHARDIKA PUTRA PURBA
GRADUATE SCHOOL
BOGOR AGRICULTURAL UNIVERSITY
BOGOR
DECLARATION OF ORIGINALITY
I hereby declare that the thesis entitled “Genetic structure and variation of
five Shorea leprosula natural populations based on microsatellite marker” and the
work reported herein was composed by and originated entirely from my
supervisors and I. I declare that this is a true copy of my thesis, as approved by
my supervisory committee and has not been submitted for a higher degree to any
other University or Institution. Information derived from the published and
unpublished work of others has been acknowledged in the text and references are
given in the list of sources.
Bogor, October 2012
Mahardika Putra Purba
ABSTRACT
MAHARDIKA PUTRA PURBA.Genetic structure and variation of five Shorea leprosula natural populations based on microsatellite marker. Supervised by
ISKANDAR Z. SIREGAR and SRI WILARSO BUDI
Shorea leprosula is an economically and ecologically important timber
species and one of the most common tropical lowland rain forest tree species in
Southeastern Asia. Eleven microsatellites DNA loci were used to investigate the
genetic structure and diversity among five natural populations from Sumatera (CS
and NS), Peninsular Malaysia (SM) and Borneo (WKa and WKb). Results
indicated that expected mean heterozygosity (He) was high (0.721) with values
ranging from 0.542 to 0.788, with the highest values found in the populations
from west Kalimantan (WKb). Most of the populations showed high and positive
fixation indices indicating excess of homozygotes. This implies a high level of
inbreeding which may be caused by selfing or/and mating among relatives. A
gene diversity analysis showed that 89.9% of the variation was harbored within
populations and 11.1% (FST= 0.111) was due to differences among populations.
STRUCTURE analysis showed that five natural populations were clustered into
two main groups namely: i) Sumatera-Peninsular Malaysia, and ii) Borneo. Mean
gene flow (Nm) was high (2.00) indicating extensive gene flow in the past among
the natural populations. Three populations (WKb, NS and SM) were identified to
be genetically unique and we recommended for further consideration in
formulation of genetic conservation strategies.
RINGKASAN
MAHARDIKA PUTRA PURBA. Struktur genetika dan variasi lima populasi alami Shorea leprosula berdasarkan penanda mikrosatelit. Dibawah bimbingan
ISKANDAR Z. SIREGAR dan SRI WILARSO BUDI.
Shorea leprosula Miq. atau yang dikenal dengan nama Meranti tembaga
atau Light red meranti merupakan salah satu penghasil kayu berkualitas baik di
wilayah hutan hujan tropis. Jenis ini merupakan pohon yang penting baik secara
ekologi maupun ekonomi. Populasi S. leprosula umumnya tersebar di 3 wilayah
utama (Sumatera, Kalimantan dan Semenanjung Malaysia), yang telah terpisah
antara satu dengan lainnya dalam waktu yang cukup lama, sehingga dapat
diasumsikan bahwa ada perbedaan genetik yang cukup tinggi diantara populasi ini
karena aliran gen yang terbatas. Adapun tujuan dari penelitian ini adalah untuk:
(1) Menduga variasi genetik S. leprosula; (2) Menduga sebaran keragaman
genetik di dalam populasi dan antar populasi, dan (3) Merumuskan arahan terkait
implikasi konservasi S. leprosula berdasarkan informasi genetik yang diperoleh.
Hasil penelitian menunjukkan bahwa S. leprosula memiliki tingkat
keragaman genetik yang masih tinggi (He= 0,721). Nilai koefisien inbreeding
dalam penelitian ini menunjukkan nilai yang positif pada sebagian besar populasi
yang berarti kemunculan homozigot lebih banyak dibandingkan heterozigot, hal
ini menunjukkan bahwa adanya inbreeding yang terjadi disebabkan oleh
penyerbukan sendiri maupun persilangan diantara kerabat dekat. Sebagian besar
keragaman genetik tersimpan didalam populasi (89,9% dari total keragaman),
sedangkan keragaman antar populasi (FST) adalah sebesar 11.1% dan termasuk
dalam kategori sedang berdasarkan nilai differensiasi Wright. Hal ini dikarenakan
tingginya aliran gen yang terjadi dimasa lampau (Nm= 2). Hasil analisis
menggunakan program STRUCTURE menunjukkan bahwa kelima populasi
S. leprosula terpisah menjadi dua bagian yaitu: i) grup Sumatera-Semenanjung
Malaysia, dan ii) Grup Kalimantan, dengan populasi yang berbaur disetiap grup.
Pada beberapa populasi S. leprosula ditemukan private allele yaitu alel
yang memiliki frekuensi yang rendah yang menunjukkan keunikan suatu populasi.
Alel-alel unik ini juga digunakan sebagai kriteria untuk konservasi sehingga
tentunya adalah dengan cara membatasi kegiatan penebangan dan pengrusakan
hutan. Populasi WKa harus mendapat perhatian khusus dalam kegiatan konservasi
karena memiliki keragaman genetik yang paling rendah (A= 3.6; HE= 0.542; FST=
0.080) dibandingkan dengan populasi lainnya, perhatian khusus ini dapat
dilakukan dengan cara melindungi populasi secara keseluruhan dari kegiatan
penebangan dan eksploitasi yang berlebihan demi keberlangsungan populasi ini
© Copyright owned by IPB, 2012
All rights reserved
GENETIC STRUCTURE AND VARIATION OF FIVE
Shorea leprosula
NATURAL POPULATIONS BASED ON
MICROSATELLITE MARKER
MAHARDIKA PUTRA PURBA
Thesis
Submitted in partial fulfillments of the requirements for the degree of Master of Science at the Bogor Agricultural University
GRADUATE SCHOOL
BOGOR AGRICULTURAL UNIVERSITY
BOGOR
Thesis Title : Genetic structure and variation of five Shorea leprosula natural populations based on microsatellite marker
Name : Mahardika Putra Purba Student ID : E451100011
Major : Tropical Silviculture (SVK)
Approved by, Supervisor
Prof. Dr. Ir. Iskandar Z Siregar M.For.Sc Dr. Ir. Sri Wilarso Budi R, MS Head-supervisor Co-supervisor
Endorsed by,
Head of Major Dean of Graduate School Tropical Silviculture
Dr. Ir. Basuki Wasis, MS Dr. Ir. Dahrul Syah, M.Sc. Agr.
ACKNOWLEDGEMENT
I would like to express my sincere appreciation and gratitude to Professor
Iskandar Zulkarnaen Siregar and Dr. Sri Wilarso Budi, whose valuable
supervision, guidance, enthusiasm and especially great patience have facilitated
the completion of this thesis.
I wish to acknowledge Institute of Plant Biology, University of Zurich
(UZH) for granting me a research fellowship and for financial support during my
stayed in Zurich, Switzerland. Assistance from the staff of Gunung Leuser
National Park, Bukit Tigapuluh National Park and Betung Kerihun National Park
are much appreciated during the field work and sample collection, as well as
Forest Research Institute Malaysia (FRIM) for providing samples from Malaysian
site.
I would like to express my appreciation to the staff of the Institute of Plant
Biology, University of Zurich. Prof. Dr. Kentaro Shimizu and Dr. Kevin Ng Kit
Siong for their introduction to microsatellite analysis, for valuable discussion in
terms of data analysis and interpretation, and for their help and companionship
during laboratory works conducted in Genetic Diversity Center (GDC).
Great appreciation is also given to staff and colleagues from Department
of Silviculture, Faculty of Forestry, Bogor Agricultural University (IPB) for their
contribution and help, and Mr. Ismail for help in secretariat work.
Finally, I would like to express my special thanks to my mother and father,
my sisters: Maharani, Maya Vita and Efra, as well as all my friends for their
ABOUT THE AUTHOR
Mahardika Putra Purba was born in Pematang Siantar, North Sumatera on
19 October 1987. He is the eldest son of Matias Tuah Purba and Marice Lingga.
He finished his elementary, junior and high schools at public schools in Pematang
Siantar. In 2005 he became a student at University of Sumatera Utara, Faculty of
Agriculture, Department of Forestry. He graduated with a Bachelor of Forestry in
2009.
In 2010 he joined Bogor Agricultural University (IPB) graduate school as
a Master of Science student in Tropical Silviculture. He was awarded a research
fellowship from Institute of Plant Biology, University of Zurich, Switzerland. He
continued his master study and research in Switzerland for one semester. He
TABLE OF CONTENTS
Problem tree analysis ... 3
Research objectives ... 3
LITERATURE REVIEW ... 4
Shorea leprosula Miq ... 4
General description ... 4
Distribution and ecology ... 5
Reproductive Biology ... 6
System of genetic ... 7
Genetic diversity ... 8
Population genetics and gene flow ... 9
Microsatellite markers ... 11
Genetic Conservation ... 11
MATERIAL AND METHODS ... 13
Place and time of study ... 13
Research procedure ... 13
Sample collections ... 13
DNA extraction and genetic analysis ... 14
Data analysis ... 16
... Microsatellite polymorphism and genetic variation 16 ... Genetic differentiation and gene flow 16 ... Genetic clustering 17 RESULT AND DISCUSSION ... 18
Result ... 18
Microsatellite polymorphisms and level of genetic diversity ... 18
Fixation Indices (FIS) ... 19
Genetic differentiation and gene flow ... 20
Genetic clustering ... 22
Discussion ... 24
Genetic diversity in Shorea leprosula population ... 24
Fixation indices (FIS ) ... 26
Genetic differentiation and gene flow ... 27
CONCLUSIONS AND FUTURE PERSPECTIVE ... 33
Conclusion ... 33
Future perspective ... 33
REFERENCES ... 34
LIST OF TABLES
Page
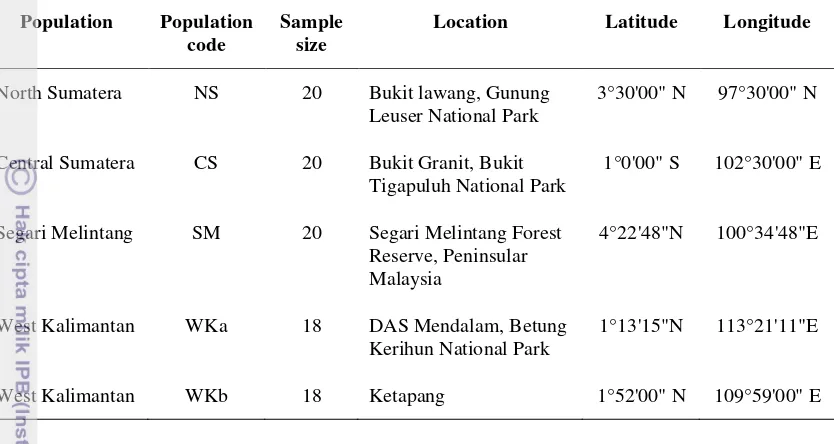
1 Locations and sample size of five natural populations of S. leprosula in Southeast Asia ... 14
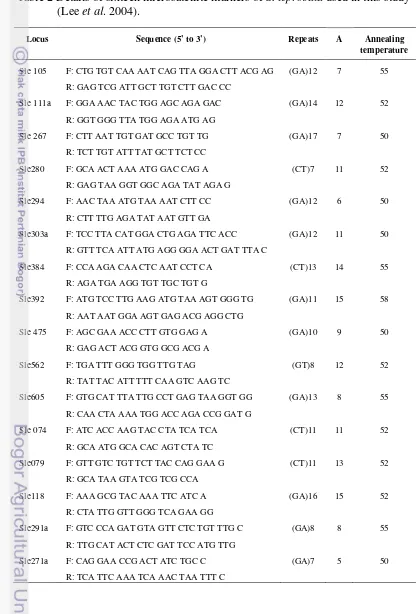
2 Details of eleven microsatellite markers of S. leprosula ... 15
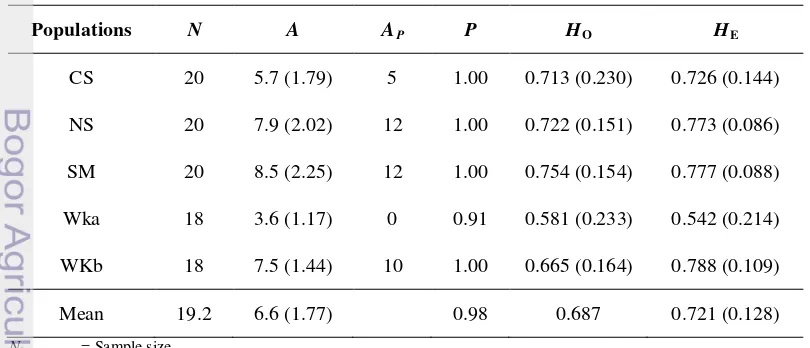
3 Average genetic diversity parameters of five natural populations of
S. leprosula in Southeast Asia based on microsatellite loci ... 18
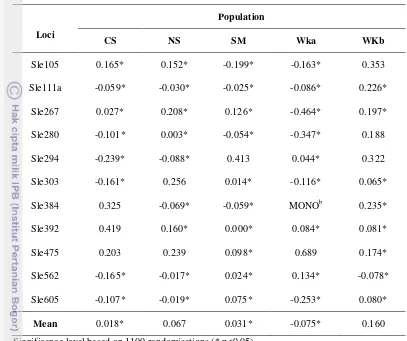
4 Fixation index (FIS) for five natural populations of S. leprosula in
Southeast Asia ... 20
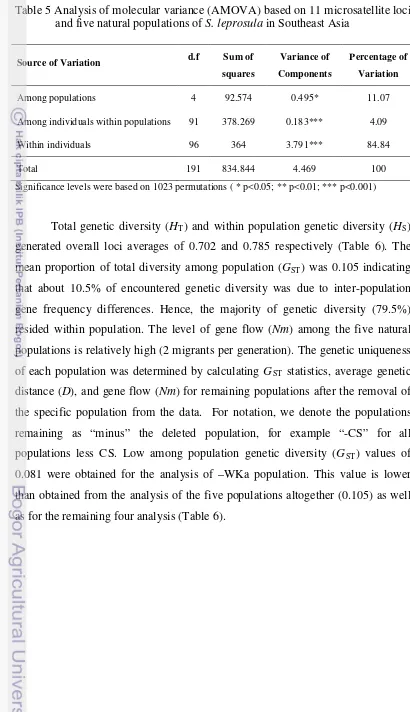
5 Analysis of molecular variance (AMOVA) based on eleven microsatellite loci and five natural populations of S. leprosula in Southeast Asia ... 21
6 Genetic diversity and gene flow for S. leprosula populations after the removal of one population at a time ... 22
LIST OF FIGURES
Page
1 Problem tree analysis of this study ... 3
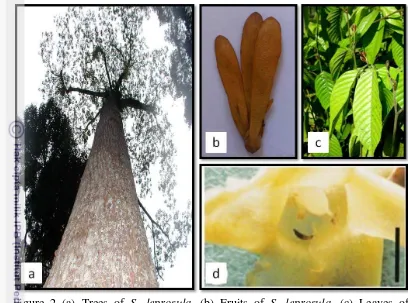
2 Tree, fruits, leaves of S. leprosula and Thrips hidden within corolla ... 5
3 Pollinator of Shorea: (a) Thrips; (b) Bettle ... 6
4 Evolutionary factors and their influence on the phenotypic structure of a population ... 7
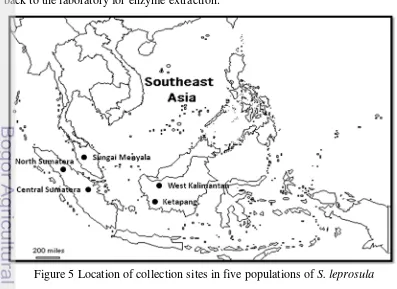
5 Location and collection site in five populations of S. leprosula ... 13
6 Dendrogram for IPGMA cluster analysis based on Nei’s genetic distance between the five natural populations of S.leprosula in Southeast Asia ... 22
7 Bayesian cluster analysis using STRUCTURE ... 23
LIST OF APPENDICES
Page
1 Multiplex PCR Microsatellite analysis ... 41
2 Allele frequencies for polymorphic loci in five natural populations of
Shorea leprosula ... 43
3 Distribution of Allele frequencies for polymorphic loci across five natural populations of Shorea leprosula ... 47
4 Sampling data of Shorea leprosula in Gunung Leuser National Park North Sumatra (Code:NS) ... 53
5 Sampling data of Shorea leprosula in Bukit Tigapuluh National Park Central Sumatra (Code: CS) ... 54
6 Sampling data of Shorea leprosula in Betung Kerihun National Park West Kalimantan (Code: Wka) ... 55
7 Sampling data of Shorea leprosula in Ketapang, West Kalimantan (Code: Wkb) ... 56
8 Documentation of Shorea leprosula ... 57
INTRODUCTION
Background
Tropical forests in Southeast Asia are a center of global biological
diversity. Many of them are dominated by Dipterocarpaceae, with more than 450
species in 13 genera in Asia (Ashton 1982). Shorea is a genus with approximately
196 species, one of the species is Shorea leprosula Miq., locally known as
Meranti Tembaga or Light red Meranti, which is ecologically and economically
important timber in the tropical forest of Southeast Asia (Ashton 1982). Mostly in
Indonesia, The regions with the highest abundance of S. leprosula are mostly in
Indonesia, in particular on Sumatra and Kalimantan (Borneo). It is common and
even abundant on well drained or swampy sites on deep clay soil in lowland and
hilly dipterocarp forest below 700 m elevation (Symington 1943; Ashton 1982).
Deforestation and forest degradation are large-scale problems in
developing countries. In Indonesia, the situation is particularly bad with the
frequent increases in oil palm industry and the area needed for housing as well as
illegal logging all of which pose a significant threat to the sustainability of
tropical forest ecosystems (Tnah et al. 2010). Between 2000 and 2009 Forest
Watch Indonesia (2011) estimated total deforested area in Indonesia was 15.2
million hectares which is a deforestation rate of 1.5 million hectares per year.
Indonesia has been the largest tropical log producing country, producing 34.2
million m3 (mainly from dipterocarps species) in response to increasing demand from the construction industry (International Tropical Timber Organization 2010).
This condition will give more pressure to the natural forest. S. leprosula is one of
dipterocarps species which is economically important, and it has a stabile price
year by year giving a significant income to Indonesia (International Tropical
Timber Organization 2010). As a consequence this species has suffered from a
massive population reduction and is categorized as endangered species according
to the International Union for Conservation of Nature (IUCN, 2011) red list of
threatened species. Although S. leprosula can still be found abundantly in
Sumatera, Kalimantan and Peninsular Malaysia, with continued exploitation for
its timber and conversion of forest to other land uses, it is unlikely for the species
specific environments can easily be lost, unless a proper conservation strategy is
developed and put in practice.
Population differentiation is a fundamental process of evolution which
may lead to speciation under certain conditions. Therefore, determining and
measuring population differentiation is becoming one of the central themes of
population genetic studies. Several studies have been conducted on the genetic
aspect of S. leprosula. Lee et al. (2000b) used allozyme markers to study the
population genetic structure of this species in Peninsular Malaysia. Lee et al.
(2000b) found that the species exhibited high levels of genetic diversity and the
majority of the diversity was partitioned within population. In addition, Ng et al.
(2006) also found high levels of gene diversity within populations of S. leprosula
in Peninsular Malaysia based on microsatellite DNA.
Recently, microsatellite markers have become the markers of choice for a
wide spectrum of genetic, population, conservation, and evolutionary studies in
plants, particularly in forest tree species including S. leprosula (Lee et al. 2000a;
2000b; 2006, Ng et al. 2006). The popularity of microsatellite markers stems from
a unique combination of several important advantages, such as codominant
markers, high reproducibility, abundance in the genome in every organism and the
ease of assessing size of variation by polymerase chain reaction (PCR) with pairs
of flanking primers (Weising et al. 2005). Microsatellite markers are one of the
best tools for measuring genetic diversity and population genetic structure because
of highly polymorphic markers due to its high mutation rate (Ng et al. 2009).
The ecological and life history traits of S. leprosula (i.e. regionally
distributed, long-lived, predominantly out crossing, weak pollinators) allow us to
postulate high genetic diversity within populations for this species. Also these
populations are from three different land masses (Peninsular Malaysia, Borneo &
Sumatera), probably evolving independently from each other for a long time,
therefore we would expect relatively strong genetic differentiation among
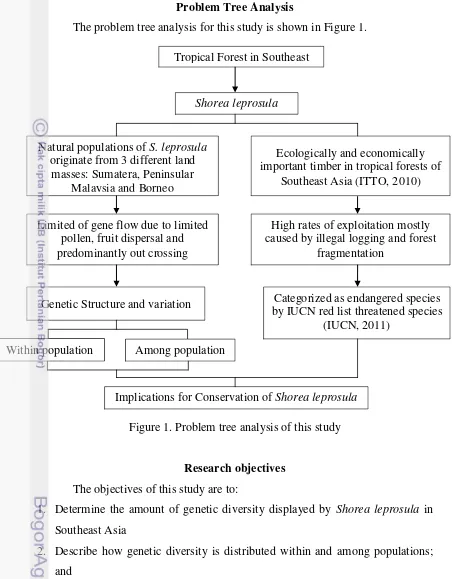
Problem Tree Analysis
The problem tree analysis for this study is shown in Figure 1.
Figure 1. Problem tree analysis of this study
Research objectives
The objectives of this study are to:
1. Determine the amount of genetic diversity displayed by Shorea leprosula in
Southeast Asia
2. Describe how genetic diversity is distributed within and among populations;
and
3. Propose the implications based on genetic information for formulation of
genetic conservation program of Shorea leprosula. Tropical Forest in Southeast
Shorea leprosula
Natural populations of S. leprosula
originate from 3 different land masses: Sumatera, Peninsular
Malaysia and Borneo
Ecologically and economically important timber in tropical forests of
Southeast Asia (ITTO, 2010)
Genetic Structure and variation
High rates of exploitation mostly caused by illegal logging and forest
fragmentation
Categorized as endangered species by IUCN red list threatened species
(IUCN, 2011)
Implications for Conservation of Shorea leprosula
Limited of gene flow due to limited pollen, fruit dispersal and predominantly out crossing
LITERATURE REVIEW
Shorea leprosula Miq. General description
Shorea leprosula Miq. locally known as Meranti Tembaga or Light red
Meranti (Figure 2), belongs to the Dipterocarpaceae, the main timber family in the
tropical forest of Southeast Asia (Angiosperm Phylogeny Group, 2009).
Kingdom : Plantae
Trees up to 60 m high; approximate 100 cm in diameter; bark greyish
brown, shallowly fissured, V-shaped (Figure 2). Outer bark dull purple brown,
rather hard, brittle, inner bark fibrous, dull brown or yellowish brown grading to
pale at the cambium, sapwood pale or cream, resinous, heartwood dark red or
light red brown; leaves elliptic to ovate, 8-14 cm long, 3.5 to 5.5 cm wide, cream
scaly, thinly leathery, base obtuse or broadly cuneate, apex acuminate, up to 8 mm
long, secondary vein 12-15 pairs, slender, curved towards margin, set at 40 to 550,
tertiary veins densely ladder-like, very slender, obscure expect in young tress;
stipules 10 mm long, 35 mm wide, scars short, horizontal, obscure, oblong to
broadly hastate, obtuse, fugacious, falling off early; Fruit pedicel to 2 mm long,
calyx sparsely pubescent, 3 longer lobes up to 10 cm long, approximate 2 cm
wide, spatulate, obtuse, approximate 5 mm broad above the to 8 by 6 mm
thickened elliptic, shallowly saccate base, 2 shorter lobes up to 5.5 cm long,
approximate 0.3 cm wide, unequal, similarly saccate at base (Ashton 1982;
Figure 2 (a) Trees of S. leprosula, (b) Fruits of S. leprosula, (c) Leaves of
S.leprosula seedling (d) Thrips hidden within corolla (Sakai et al. 1999)
Distribution and ecology
Shorea leprosula is distributed from southern Thailand (Pattani)
throughout Peninsular Malaysia (except for the seasonal areas in Perlis, northwest
Kedah and Langkawi island), Sumatera and North Borneo (Symington 1943). S.
leprosula is one of the fastest growing species of Dipterocarp up to approximately
its twentieth year, but it is later surpassed by other Dipterocarp species. S.
leprosula can grow in a wide variety of site conditions including flat topography,
and hilly areas, and it is frequently found on well-drained soil, deep clay soils or
swampy soil in the mixed Dipterocarp forest of lowlands and hills up to 700 meter
above sea level. However, it is a strongly light-demanding species (Meijer and
Reproductive biology
Outcrossing is predominant in many tropical forest tree species, and the
average out crossing rate is more than 80% (Nason et al. 1996). Outcrossing rates
maybe strongly influenced by flowering tree density (Murawski and Hamrick
1992) and the types and behaviors of pollinators governing the pollen movement
(Ghazoul et al. 1998). Dipterocarpaceae have an outcrossing habit and some
species have a considerable degree of self-incompatibility (Chan 1981). The
flowers of dipterocarps are hermaphroditic and pollinated by a variety of insects
(Appanah 1981).
Figure 3 Pollinator of Shorea: (a) Thrips; (b) Beetle (Sakai et al. 1999)
Flowering behavior of S. leprosula is like all other dipterocarps species, it
is sporadic throughout the year and gregarious at intervals of two or five years
(Soerianegara and Lemmens 1993). Pollination studies in lowland dipterocarps
species showed that S. leprosula is characterized by limited pollen and fruit
dispersal. S. leprosula is pollinated by Thrips from order Thysanoptera (Figure
2d; Figure 3a), weaker fliers than bees or other insect pollinators (Chan and
Appanah 1980; Appanah and Chan 1981). Appanah and his colleagues noted that
the short generation time and high reproductive rate of thrips permit a quick
response of thrips to an abrupt increase of flowers at the beginning of general
flowering and that thrips provide sufficient pollination service for multiple species
of Shorea (Sakai et al. 1999). Sakai et al (1999) also found beetle pollinators
(Figure 3b) to be the predominant flower visitors of all nine species of Shorea
Hills National Park, Sarawak. Fruit dispersal in S. leprosula is often by gyration
alone, with seeds largely falling within 50 m from the mother tree, and there is
probably little secondary dispersal by animals once the seed reaches the forest
floor (Chan 1980).
System of genetics
The genetic system includes everything that provides for their creation,
storage, testing, modification and release of genetic variation. It determines the
existence and the adaptability of a population to future environmental change, the
organization and transmission of genetic information and the kind and amount of
genetic combinations produced. The genetic system comprises of several
components, i.e. the recombination system, sexual system, mating system, the
dispersal/gene flow system and the mutation system, sexual system, reproductive
system, adaptive system, incompatibility system and selection system (Hattemer
1991; Finkeldey 1998; Ledig 1998). These components are closely related and
interlinked as shown in Figure 4.
Figure 4 Evolutionary factors and their influence on the genotypic structure of a population (Hattemer and Muller-Starck, 1990)
Genetic diversity
Genetic diversity serves as a way for populations to adapt to changing
environments. With more variation, it is more likely that some individuals in a
population will possess variations of alleles that are suited for the current
environment. Those individuals are more likely to survive to produce offspring
bearing that allele. The population will continue for more generations because of
the success of these individuals. The status of genetic diversity is an important
scientific aspect to be considered for designing effective and efficient programs of
genetic conservation and tree improvement. Genetic diversity plays a very
important role in survival and adaptability of a species because when a species
environment changes, slight gene variations are necessary to produce changes in
the organism’s
Patterns of genetic variation based on 97 isozyme studies of tropical trees
have been reviewed by Loveless (1992). The results demonstrate that levels of
variation in populations of tropical taxa are as high or higher than in plants in
general. Levels of genetic variation differ significantly among species with
different geographic ranges, life form and taxonomic affinities. Levels of
population differentiation are significantly different only between species with
different dispersal modes. Outcrossing rates in 16 tropical tree species showed a
preponderance of highly outcrossed breeding systems. Genetic evidence suggests
that gene flow among local populations is high, but geographically separated
populations showed moderate levels of genetic differentiation (Siregar 2000) that enables it to adapt and survive. If genetic diversity
becomes low at many genes of a species, that species becomes increasingly at
risk. Otherwise, high levels of genetic diversity enable them to survive spatial and
temporal variations of environmental conditions (Finkeldey 1993).
Populations of a species may have different degrees of genetic diversity
according to their breeding systems and life history traits (Lee et al. 2000c). No
matter how many variants of a gene are present in a population today, only the
variants that survive in the next generation can contribute to species diversity in
the future. Once gene variants are lost, they cannot be recovered (Zhou et al.
2003). Genetic diversity of a population can be assessed by proportion of
demonstrate variability), and mean number of individuals with polymorphic loci
(Heterozygosity)
Population genetic and gene flow
The primary goal of population genetics is to understand the factors
determining evolutionary change and stasis, and the amount and pattern of genetic
variation within and between populations (Hedrick 2005; Hartl and Clark 2007).
The amount and type of genetic variation in populations is potentially affected by
a number of factors, but primarily by selection, inbreeding, genetic drift, gene
flow, mutation and recombination. These factors may have general or specific
effects; for example, genetic drift and inbreeding can be considered to always
increase the amount of variation. Other factors, such as selection and gene flow
may either increase or reduce genetic variation, depending on the particular
situation. A combination of two or more of these factors can generate many
different levels and patterns of genetic variation. To understand the influence of
these evolutionary factors, one must first be able to describe and quantify the
amount of genetic variation in a population and the pattern of genetic variation
among populations (Hedrick 2005). One of the basic concepts of population
genetics is Hardy-Weinberg principle (often called Hardy-Weinberg Equilibrium).
This principle states that after one generation of random mating, single locus
genotype frequencies can be represented by a binomial (with two alleles) or
multinomial (with multiple alleles) function of allele frequencies. This principle
allows great simplification of the description of a population’s genetic content by
reducing the number of parameters that must be considered. Furthermore in the
absence of factors that change allele frequency (selection, genetic drift, gene flow
and mutation) and in the continued presence of random mating the Hardy
Weinberg genotype proportion will not change over time.
In most species, populations are often subdivided into smaller units
because of geographic, ecological or behavioral factors. When a population is
subdivided, the amount of genetic connectedness among the parts of population
can differ. Genetic connection depends primarily on the amount of gene flow,
subpopulations or sub groups. When the amount of gene flow between groups is
high, gene flow has the effects of homogenizing genetic variation between the
groups. When the gene flow is low, genetic drift, selection and even mutation in
the separate groups may lead to genetic differentiation. Hierarchical
representation is useful in describing the overall relationships of organism’s
populations and in documenting the spatial genetic variation. Phylogeography, the
joint use of phylogenetic techniques and geographic distributions has been used to
understand spatial relationships and distributions of populations within species or
closely related species (Avise 2000).
Gene flow is central to understanding evolutionary potential and
mechanisms in several areas of applied population genetics. Gene flow from other
populations of the same species can result in genetic rescue or genetic restoration
of these populations by introducing new variation that allows removal of
detrimental variation and restoration of adaptive change. Estimating the amount of
gene flow in most situations is rather difficult. Direct estimates of the amount of
movement can be obtained in organisms where different individual marks are
used. However both the movement of individuals and their incorporation into the
breeding population are necessary for gene flow. Using highly variable genetic
markers, it is now possible to identify parents genetically and thereby determine
the spatial movement of gametes between generations without the direct
movement information of the parents. Or, individuals can be assigned to specific
populations using genetic markers, thereby determining whether they are migrants
or not. Indirect measures of gene flow using genetic markers are useful to confirm
behavioral or other observations or when these observations are inconclusive or
impossible. Theoretically assuming finite subpopulations of size Ne
F
and a
proportion m migrants into each subpopulation each generation, then:
ST =
When Nem is large, the measure FST approaches 0, and when Nem is small, FST
can approaches 1. The value of FST for a group of populations can be estimated
using the amount and pattern of molecular genetic variation over subpopulations
Microsatellite markers
Highly informative genetic markers are required for assisting various
programs in genetics, such as breeding, genome mapping, tree improvement,
forensics and conservation, and the restoration and sustainable management of
forest genetic resources. Microsatellite DNA or simple sequence repeats (SSRs)
are highly informative genetic markers, consisting of tandem repeats of sequence
units, short DNA sequence motifs; they are widely spread in eukaryotic genomes
and are often highly polymorphic due to variation in the number of repeat units.
Microsatellite markers have become the preferred marker in many studies because
they are shorter, easier to amplify, more abundant, and more evenly distributed
throughout the genome than SSRs (Muller-Starck and Schubert 2001).
Microsatellites composed of tri-, tetra- and pentanucleotide repeats are generally
less common than mono- and dinucleotide repeats. Another way to categorize
microsatellites relates to the degree of perfectness of the arrays. Weber (1990)
recognized three classes, comprising (1) perfect repeats, which consist of a single,
uninterrupted array of a particular motif; (2) imperfect repeats, in which the array
is interrupted by one or several out-of-frame bases; and (3) compound repeats,
with intermingled perfect or imperfect arrays of several motifs.
Microsatellite mutation rates proved to vary considerably depending on
the locus, the length of the repeat motif, the organism and sometimes the allele.
The mutational processes governing microsatellite evolution are very complex
and care needs to be taken when microsatellite markers are used in population
genetics. Microsatellites as a molecular marker can be used as single PCR
primers, as primers in combination with other primer types or as hybridization
probes.
Genetic conservation
Forest geneticists have been calling for conservation of diversity for many
years. Since they were geneticists, they naturally called this gene conservation.
Genes were needed in breeding, as raw material for selection, and to maintain
viable populations of commercial species. Research and experience have made us
diversity in forest tree populations that are undergoing population changes due to
natural or human induced events is seen to be instrumental for adaptability and
continued evolution (Muller-Starck and Schubert 2001). Immediate losses in
genetic diversity due to logging may be compensated for by good seed or seedling
banks in the logged or nearby undisturbed stands.
Genetic improvement and conservation should also be complementary. In
situ conservation, if properly planned, can contribute significantly to an ex situ
tree improvement program by providing a sustainable source of genetic material,
while the tree improvement program can provide the motivation and resources for
successful in situ conservation (Payn et al. 2008). If a conservation reserve system
is to adequately represent the genetic diversity of an ecosystem, information on
gene frequencies and population size is critical. The proper design and
maintenance of ex situ plantings are necessary to maximize genetic recombination
while minimizing outside contamination (Lim et al. 2000). Maintaining separate
breeding populations based on specific traits of interest is one effective way to
maintain diversity and minimize the loss of low-frequency alleles (genes for
MATERIAL AND METHODS
Place and time of study
The research was conducted at Laboratory Institute of Plant Biology,
University of Zurich, Switzerland and at Genetic Diversity Center Zurich (GDC).
This researched was completed between July 2011 and March 2012.
Research procedure Sample collection
Sample collections were conducted throughout the distribution range of
S. leprosula in Southeast Asia (Figure 5). Samples from five natural populations
of S. leprosula were collected from five forest reserves i.e. North Sumatera (NS),
Riau (CS), Ketapang (WKa), West Kalimantan (WKb), and Sungai Menyala
(SM). A total of 96 individuals, that were more than 10 cm diameter breast height
(dbh) were sampled. The location and names of the sample populations are
presented in Table 1. The samples were collected in the form of inner bark
(Appendices 9) or leaf tissue. The collected samples were kept in plastic bags
containing silica gel, and maintained at low temperature before being brought
back to the laboratory for enzyme extraction.
Table 1 Locations and sample size from the five natural populations of
S. leprosula in Southeast Asia included in this study
Population Population
code
Sample size
Location Latitude Longitude
North Sumatera NS 20 Bukit lawang, Gunung
Leuser National Park
3°30'00" N 97°30'00" N
Central Sumatera CS 20 Bukit Granit, Bukit Tigapuluh National Park
1°0'00" S 102°30'00" E
Segari Melintang SM 20 Segari Melintang Forest Reserve, Peninsular Malaysia
4°22'48"N 100°34'48"E
West Kalimantan WKa 18 DAS Mendalam, Betung Kerihun National Park
1°13'15"N 113°21'11"E
West Kalimantan WKb 18 Ketapang 1°52'00" N 109°59'00" E
DNA extraction and genetic analysis
Genomic DNA was extracted from leaf and inner bark tissue using the
procedure by DNeasy Plant Mini Kit (QIAGEN, Valencia, CA, USA), all steps
were performed as described in the DNeasy Plant Mini Kit Manual. DNA quality
and quantity were determined by Nanodrop ND-1000 technologies. The samples
were genotyped for sixteen microsatellite loci developed for S. leprosula
(Lee et al. 2004) i.e sle105, sle111a, sle267, sle280, sle294, sle303a, sle384,
sle392, sle475, sle562, sle605, sle074, sle079, sle118, sle271a, and sle291a.
Details of microsatellite markers appear in Table 2. Multiplex microsatellite
amplification was performed in 8μl reaction volume containing 5ng DNA (1 μl template DNA), 4 μl 2x Type-it multiplex PCR (Qiagen) master mix, 10 x primer mix 0.2 μM of each primer, and 2,2 μl dH2O. The PCR was carried out in a
GeneAmp 9700 thermal cycler (Applied Biosystems, USA), for an initial
denaturing step of 95oC for 5 min, followed by 30 cycles each at 95oC for 30 sec, 52-54oC for 90 sec and 72oC for 30 sec. A final extension step at 60oC for 30 min was performed after the 30 cycles (details of multiplex PCR microsatellite
against the internal size standard and the individuals were genotyped using
GeneScan Analysis 3.1 and Gene Mapper software (Applied Biosystems, USA).
Data analysis
Microsatellite polymorphism and genetic variation
The levels of genetic diversity were estimated for the mean number alleles
per locus (A), Private alleles (AP) and proportion of polymorphic loci (P) were
calculated for each locus and averaged for each population over all loci using
program GDA 1.1 (Lewis and Zaykin, 2001). Observed heterozygosity (HO) and
Nei’s (1978) expected heterozygosity (HE) were calculated with the assistance of
FSTAT version 2.9.3.2 (Goudet 2002).
Genetic differentiation and gene flow
The genetic differentiation of populations is a key parameter in population
genetic investigation (Leng and Zhang 2011). Wright’s (1951) F statistic is a
standard measure of differentiation and deviation from hardy Weinberg
equilibrium at each polymorphic locus in each population. The fixation index, FIS
(inbreeding within individual in population; inbreeding coefficient) and FST
(inbreeding due to population sub division, an indicator of the degree of
differentiation among populations) were calculated based on Weir and Cockerham
(1984) estimator f, respectively using program FSTAT (Goudet 2002). Significant
positive or negative FIS was tested using 1100 randomizations for each locus. The
standard error of FST was calculated using unbiased jackknife analysis, and the
probability of the FST
Differentiation among populations was quantified using Nei’s genetic
diversity statistics (Nei 1973; 1975). Total genetic diversity (H
> 0 was determined using bootstrap analysis with a 95%
confidence interval.
T) at polymorphic
loci, distribution of genetic diversity within populations (HS) and among
populations (DST), so that DST= HT-HS. Among population variation was
compared to total genetic variation to give GST= DST/HT. The GST values were
calculated for each polymorphic locus and then averaged over all loci. HT, HS,
and GST together were obtained using GENETIX V4.02 (Belkhir 2001). The level
of gene flow among the studied populations was determined using the relationship
Nm= (1 – GST)/4GST (Wright, 1951). The genetic of uniqueness of a specific
and El-Kassaby 1998) as follows: (1) removing population xi data from original
dataset (i.e., -xi), (2) estimating the GST, and gene flow (Nm) for the new data set
(i.e., the original five populations data set minus the population xi data) and
(3) comparing the estimates obtained from the original analysis to that of the five
new datasets (i.e., -x1, -x2, …, -x5). The same analysis was repeated five times. A
Bayesian clustering analysis was carried out using STRUCTURE V2.1 to cluster
individual into K groups. Ten independent runs were done for each value of K (1
to 5), with a burn in period of 100,000 iterations and 100,000 replications: The
number of distinct cluster (K) was selected based on ΔK statistic of Evanno et al.
(2005).
Genetic clustering
Genetic distance between populations was estimated using the Nei DA
genetic distance (Nei et al. 1983) as implemented in Powermarker v3.25 (Liu and
Muse 2005). The resulting distance matrix was used to construct a
neighbor-joining (NJ) phenogram that was bootstrapped 10000 times. The above test for
genetic structure required predefined groups of individuals. An alternate approach
was implemented in the STRUCTURE program (Pritchard et al. 2000).
STRUCTURE can estimate the number of genetically homogeneous population
(K) using a Bayesian model-based clustering method that does not require prior
information the number of locations and from which location each individual was
sampled. Admixture among populations and correlated allele frequencies were
assumed for algorithm. A burn in period of 100,000 iterations was followed by
100,000 iterations of the Markov chain. The model was run for a range of K
values from 1 to 5, with ten replications each, and the ΔK values was determined
RESULTS AND DISCUSSION
Results
Microsatellite polymorphisms and level of genetic diversity
After screening 16 primer pairs against 96 individuals from five
populations, eleven primer pairs that clearly amplified were selected for further
analysis, i.e sle105, sle111a, sle267, sle280, sle294, sle303a, sle384, sle392,
sle475, sle562, and sle605. The numbers of alleles varied widely among the
eleven loci, but all of the eleven microsatellite loci displayed polymorphism
among five populations with a total of 135 alleles identified. The most frequent
allele at each locus differed from population to population. Some alleles were
present only in certain populations. The number of allele per locus ranged from 8
alleles at locus sle294 to a maximum 16 alleles at sle562, at population level, the
average number of alleles per polymorphic locus (A) ranged from 3.6 (WKa) to
8.5 (SM), with an average 6.6 (1.77) alleles per locus. A complete list and
distribution of allele frequencies for all the polymorphic loci in each population is
shown in appendix 2 and appendix 3. Genetic diversity parameters for the five S.
leprosula populations were estimated using different statistics (Table 3).
Table 3 Average genetic diversity parameters of five natural populations of
S. leprosula in Southeast Asia based on eleven microsatellite loci. Values in parentheses are standard deviation.
Populations N A AP P HO HE
A = Average number of alleles per locus (arlequin) AP
P = Proportion of polymorphic loci (95% criterion) (GDA) = Number of private allele (GDA)
HO
H
= Observed heterozygosity (Fstat)
The mean expected heterozygosity (HE) was 0.721 with the lowest value
found in WKa population (0.542) and the highest value in the WKb population
(0.788). Private alleles (AP) were identified in all populations except WKa
population. The mean proportion of polymorphic loci are 0.98, except in the WKa
population (0.91), the P value are 1.0 in remaining populations, this is caused by
one monomorphic locus found in the WKa population (Table 3). The observed
heterozygosity (HO) within population ranged from 0.581 (WKa) to 0.754 (SM).
Overall, mean HO (0.687) is generally lower than mean HE (0.721) across five
natural populations, postulating an excess of homozygotes.
Fixation indices (FIS
The fixation indices (F )
IS) calculated for all polymorphic loci in each
population (Table 4) showed significant positive or negative deviations from
Hardy-Weinberg equilibrium in eight loci in the CS population, nine loci in the
NS population, ten loci in the SM population, nine loci in the WKa population and
eight loci in the WKb population. At the population level, a significant level of
inbreeding was observed in three population (CS, SM and WKa) which may
postulate that the plant practices some selfing and biparental mating in these three
populations. The mean FIS for all populations ranged between -0.075 (WKa) to
0.160 (WKb), mean negative fixation indices value was found in the WKa
population (-0.075), while the remaining populations showed positive values. For
all loci, negative values are found at each locus in different populations, this
negative value showed an excess of heterozygosity. Overall, the mean fixation
Table 4 Fixation index (FIS)a for five natural populations of S. leprosula in
Significance level based on 1100 randomisations (* p<0.05) FIS
MONO = Monomorphic loci
was estimated according to Weir and Cockerham (1984).
Genetic differentiation and gene flow
The differentiation among populations (FST) was 0.1110, which indicated
that 11.10% of the total genetic diversity was distributed among populations,
while the remaining percentage of the total genetic diversity partitioned within
populations. This value of FST indicates a highly significant (P<0.01)
differentiation among populations both in allele size and frequency. The mean
weighted RST are 0.1160, both estimates FST and RST showed almost same value.
Analysis of Molecular Variance (AMOVA) showed that most of the variance in
the sample is attributable to within individual variation (84.84% of the variance),
while the variation among populations was 11.07% (Table 5), and the source of
Table 5 Analysis of molecular variance (AMOVA) based on 11 microsatellite loci and five natural populations of S. leprosula in Southeast Asia
Source of Variation d.f Sum of
Among individuals within populations 91 378.269 0.183*** 4.09
Within individuals 96 364 3.791*** 84.84
Total 191 834.844 4.469 100
Significance levels were based on 1023 permutations ( * p<0.05; ** p<0.01; *** p<0.001)
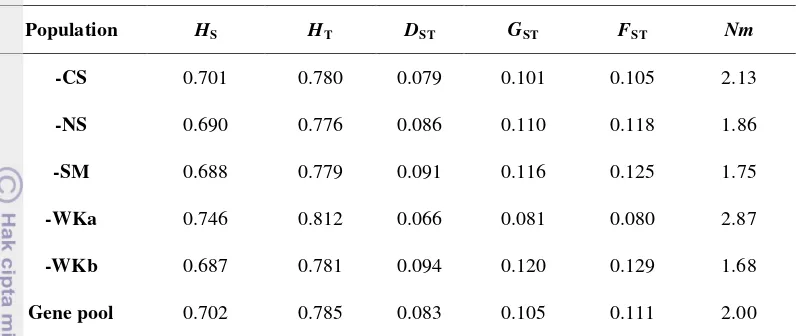
Total genetic diversity (HT) and within population genetic diversity (HS)
generated overall loci averages of 0.702 and 0.785 respectively (Table 6). The
mean proportion of total diversity among population (GST) was 0.105 indicating
that about 10.5% of encountered genetic diversity was due to inter-population
gene frequency differences. Hence, the majority of genetic diversity (79.5%)
resided within population. The level of gene flow (Nm) among the five natural
populations is relatively high (2 migrants per generation). The genetic uniqueness
of each population was determined by calculating GST statistics, average genetic
distance (D), and gene flow (Nm) for remaining populations after the removal of
the specific population from the data. For notation, we denote the populations
remaining as “minus” the deleted population, for example “-CS” for all
populations less CS. Low among population genetic diversity (GST) values of
0.081 were obtained for the analysis of –WKa population. This value is lower
than obtained from the analysis of the five populations altogether (0.105) as well
WKb
S. leprosula populations after the removal of one population at a time.
Population HS HT DST GST FST Nm GST= proportion of total diversity, partition among populations, DST
-CS represents an analysis that contained all populations after the removal of the CS population. Gene pool represents an analysis of the five natural populations.
= distribution of genetic diversity among populations.
Genetic clustering
UPGMA dendrogram based on Da values revealed two major groups of
populations (Fig. 6). First group included populations Central Sumatra (CS),
North Sumatra (NS) and Peninsular Malaysia (SM). The other group contained
populations West Kalimantan (WKa) and Ketapang (WKb). SM was separated
from CS and NS populations.
To further evaluate population structure, model-based clustering
(STRUCTURE analysis) was performed using multi locus genotype data. The ΔK
values showed a clear peak at K = 2, indicating that the investigated S. leprosula
individuals could be split into two genetically distinct groups, at the upper most
hierarchical level (Fig. 7).
Figure 7 Bayesian cluster analysis using STRUCTURE (Pritchard et al. 2000) showed two main clusters with CS, NS and SM as one cluster and WKa and WKb as another cluster
When K = 2, all individuals from populations CS, NS in Sumatera and SM
in Peninsular Malaysia were assigned to one cluster, and all individuals from
populations WKa and WKb in Borneo were assigned to another cluster (Figure 7).
However, individuals from populations Ketapang (WKb) were assigned to either
of two clusters, suggesting this population is a mixture of both clusters. This
analysis revealed that the investigated S. leprosula individuals could be divided
into Sumatera-Peninsular Malaysia and Borneo groups with one admixed
population in each group. Here after we designate the group consisting of
populations from Peninsular Malaysia and Sumatera as Sumatera-Malay Group
and the group consisting of populations from Borneo as Borneo group.
The genetic distances of the five populations of S.leprosula are given in
Table 7. WKa and WKb populations gave the lowest genetic distance (0.234),
while the genetic distance between WKa and NS populations is the highest
Table 7 Genetic distance according to Nei (1978 above diagonal) and matrix of average gene pool distances (do
) according to Gregorius (1974, below diagonal) among five S. leprosula populations
Population CS NS SM WKa WKb
Genetic diversity in Shorea leprosula populations
Out of the eleven microsatellite loci studied, 135 alleles were observed,
which is mean of 6.6 alleles per locus (Table 3). This value is higher than those
obtained from allozyme markers for S. leprosula (3.1 ± 0.5; Lee et al. 2000b).
Ng et al. (2006) obtained 9.2 alleles per locus in S. leprosula using microsatellite
markers. Microsatellite markers give a high number of alleles due to the length
mutation that causes differences in repeats units. Meanwhile microsatellite
markers can be found dispersed in the whole eukaryote genome. Therefore,
microsatellite markers may give a clearer picture of genetic diversity of species.
Nagamitsu et al. (2001) detected 25 alleles at one locus (Sch07) in S. leprosula,
and 17 alleles at one locus in Neobalanocarpus heimii (Iwata et al. 2000), this
value is a slightly lower number of alleles that is ever detected in tropical trees. In
general, a large sample size may be needed to represent all the alleles present in
the population and for the all the alleles to be in Hardy-Weinberg equilibrium.
Our analysis detected a high level polymorphism based on eleven
microsatellite loci in all five populations of the S. leprosula in Southeast Asia.
Expected heterozygosity in this study was more than observed value by 0.678,
showing an excess in homozygotes. This may because leaf samples of seedlings
were used in this study. The levels of genetic diversity estimated were high
dipterocarps. For instance, S. leprosula (Ng et al. 2006; Lee et al. 2000b),
Dryobalanops aromatica (Lim et al. 2002), Intsia palembanica (Lee et al. 2002),
and Shorea lumutensis (Lee et al. 2006). The mean expected heterozygosity
(HE =0.721) within populations for S. leprosula in this study was much higher
than reported for other regionally distributed tropical long lived tree species
(HE= 0.125; Hamrick et al 1992). It was also higher than reported for Shorea
lumutensis, an rare and endemic dipterocarpaceae species in Peninsular Malaysia
(HE= 0.648; Lee et al. 2006). The study of Ng et al. (2006) based on five
microsatellite loci at Sungai Lalang Forest Reserve in Peninsular Malaysia also
encountered exceptionally high level of genetic diversity in S. leprosula
(A= 9.2 and HE
In previous allozyme studies of S. leprosula conducted by Lee et al.
(2000b) in Malaysia, a high genetic diversity was found for allozymes (A=2.5
H
= 0.72).
E=0.410). It seems that the two marker systems produced different genetic
profiles, in that apparently higher genetic diversity was generated by
microsatellites. This discrepancy could be attributed to the different marker
system. As pointed out by many recent studies, microsatellites possessed hyper
variability and higher resolving power among various genetic markers
(Powell et al. 1996). Estimates of expected heterozygosity (HE) from
microsatellite data for tree species are generally based on one or two populations
where the focus is mainly on development of microsatellite primers and their
applicability in related species. According to Hamrick et al. (1979) long-lived
trees have a higher level of heterozygosity. This is important for the survival of
species in changing environments especially when natural selection occurs.
Hiebert and Hamrick (1983) supported this theory with a study on P.longaeva that
showed a high level of HE. High levels of genetic diversity can be associated with
population history, strategy and life history traits of species such as predominantly
outcrossed, long life span, distribution and high fecundity species
Fixation indices (FIS
All the populations of S. leprosula except WKa showed positive fixation
indices, indicating in a general excess of homozygotes. The excess of
homozygotes that is observed here may be caused by inbreeding and/or biparental
mating, as reported in many other studies (Lee et al. 2000a). A similar observation
has also been shown through a study on Pinus (Muona 1989). According to
Muona (1989), positive fixation indices at seedling level might be due to self
pollination. Seedlings produced through inbreeding usually die off before maturity
since they are weaker than outbreed progenies. In Eucalyptus regnans, higher
levels of inbreeding found in natural stands compared to a seed orchard were
explained by the spatial genetic structure (Moran et al. 1989). This also could be
the case for S. leprosula, in which trees in a natural population tend to occur in
clumps. Additional inbreeding may be due to mating between relatives in these
clumps.
)
This phenomenon has also been described in S. megstophylla
(Murawski et al. 1994). Selection favoring and increasing the proportion of
heterozygotes can occur in predominantly outcrossed population as a result of
heterosis and overdominance or by discriminating against the products of selfing
or biparental mating, which tend to have higher level of homozygosity. As shown
by Manokaran et al. (1992), S. leprosula is a dynamic species with high seedling
mortality (19.7%) and a high percentage of recruitment (10.2%). The high
mortality rate in the seedling stage and gradual decrease in sapling and adult
stages (6.4%) suggest that such selection may be common in S. leprosula.
Excess heterozygosity in locus sle111a shown by a negative value might
mean that this locus may be co-segregating with a trait responding to selection.
The Wahlund effect states that natural populations that are divided into
sub-populations might have genotype frequencies that deviate from Hardy-Weinberg
equilibrium due to natural selection or random genetic drift in the case of small
populations (Wahlund 1928). The effect is the homozygous genotype frequency
of the whole populations becomes more than Hardy-Weinberg equilibrium would
predict. In the case of S. leprosula, it could be said that all the populations of
a few sub-populations. This would explain the high fixation indices observed in
all the S. leprosula populations. Excess of homozygotes was also detected in
S. leprosula populations in Peninsular Malaysia using Allozyme markers
(Lee et al. 2000a).
Genetic differentiation and gene flow
The microsatellite markers applied in this study revealed a moderate
degree of genetic differentiation among the five S. leprosula populations with an
overall FST value of 0.111 (11.1%) and GST 0.105 (10.5%). Defined by Wright
(1978), FST has since become a standard measure of differentiation, which has
been somewhat strengthened by Wright’s incidental expression: “We will take
F= 0.25 as an arbitrary value above which there is very great differentiation, the
range 0.05-0.15 as indicating moderately great differentiation. Differentiation is,
however, by no means negligible if F is as small as 0.05 or even less”. For loci
with multiple alleles, Nei (1973) introduced GST as an extension of FST. Thus,
GST is equivalent to FST and can be regarded as a weighted average of FST for all
alleles (Nei 1973). In the present study, genetic differentiation was higher
(FST = 0.111) than the result reported by Lee et al. (2000a) on S. leprosula
(FST= 0.085) in Peninsular Malaysia which was obtained using allozyme markers.
This is because microsatellite loci are more polymorphic than allozyme loci.
Several comparative studies have been conducted in D. aromatica based on
allozyme and microsatellite analysis. Lee et al. (2000b) used allozyme markers to
investigate ten populations of D. aromatica collected from Peninsular Malaysia,
based on eight allozyme loci and found low genetic differentiation (FST= 0.042),
while Lim et al. (2002) detected higher genetic differentiation (FST
Maintenance of moderate variation among populations depends on the
efficiency of gene flow, a factor that usually is supported by effective
cross-pollination and seed dispersal mechanisms. This however is not the case in
S. leprosula as it is characterized by poor pollen and fruit dispersal. S. leprosula is
pollinated by Thrips (Appanah and Chan, 1981), weaker fliers than bees or other = 0.062) on D.
aromatica on the basis of microsatellite analysis. This result is slightly lower than
insect pollinators. S. leprosula can also be pollinated by beetles (Sakai et al. 1999)
which are not likely to diperse pollen for long distances. This may result in
limited pollen movement and greater population differentiation. Fruit dispersal in
S. leprosula is by wind, or more often by gravitation alone, with seeds often
falling within 50 m of the tree crown and there is no evidence that they can
withstand sea water (Ashton, 1988). These facts suggest that migration between
the two population group must have occurred when their distributions were close
enough to allow for pollen and/or seed exchange.
This population genetics studies used indirect methods to establish levels
of gene flow. Statistics that estimate this parameter generally include variance
among populations in allele frequencies (FST Wright, GST Nei, and RST
STRUCTURE analysis revealed that investigated S. leprosula individuals
could be divided into two genetically distinct groups: Sumatra-Peninsular
Malaysia and Borneo with one admixed population in Borneo (Ketapang/WKb).
Clear separation of the two groups suggests limited genomic exchanges between
them and that the admixture occurred quite recently or reproductive isolation has
developed between the two groups. Analysis of S. leprosula based on AFLP data
(Cao et al. 2006) also supported the result in this study. The analysis also revealed
that S. leprosula individuals are separated into two groups. Furthermore they
found another admixed population located in Central Sumatera, where some of the
individuals are clustered with individuals from Borneo, suggesting that a large
area was involved in the admixture event and that S. leprosula has a complicated Slatkin)
and Nm, the effective number of migrants per generation. Values are interpreted
as indications of relative levels of gene flow among populations (Bossart and
Prowell 1998). Estimates of Nm less than one indicate relatively little gene flow
and one or greater suggest high levels of gene flow (Slatkin, 1985; Slatkin and
Barton, 1989). Indirect estimates of Nm represent historical average levels of gene
flow and may not represent present day levels (Loveless, 1992). Thus, the indirect
estimates of Nm of 2.00 (Table 7) indicate the presence of the substantial gene
flow among populations in the past, which might responsible for the maintenance
of moderate genetic differentiation among populations in S. leprosula in the
population structure. In addition, the STRUCTURE analysis of S. parvifolia
individuals conducted by Iwanaga et al. (2012) revealed that seven populations
from peninsular Malaysia, Sumatera and Eastern Borneo are divided into two
groups: Sumatera-Malay and Borneo. Furthermore, each group contained one
admixed populations. This STRUCTURE analysis is similar to the result obtained
in our present study.
The moderate level of population differentiation may also be due to
historical population fragmentation. At the last glacial maximum (LGM,
approximately 0.02 MYA), Peninsular Malaysia, Sumatra, Java and Borneo island
were connected to each other by the exposed Sunda Shelf (Voris, 2000). The
evidence to suggest that the islands of Sumatera, Peninsular Malaysia, Java and
Borneo were connected when sea levels were 60-120 m below the present level is
shown by Figure 8 (Heaney, 1991, Voris 2000). Many studies suggested that
during this period, rainforest refugia were present in northern and eastern Borneo,
northern and western Sumatra and the Mentawai islands (Thomas 2000; Cannon
et al. 2009; Wurster et al. 2010). Peninsular Malaysia, Sumatra, Java and Borneo
were connected by the exposed Sunda Shelf when the sea level dropped and
savanna vegetation appeared (Morley, 2000). The exposed Sunda Shelf in the
Pleistocene might be allowed for S. leprosula to spread. This is supported by a
recent study which revealed that South west Sumatra and a substantial region of
the Sunda Shelf and Borneo were covered by rainforests during much of the last
Figure 8 Map of Southeast Asia showing current land areas and the late Pleistocene land area, as estimated from 120 m bathymetric line (Heaney, 1991)
Population structure and divergence history have been shown in some
lowland rainforest species, for instance in S. parvifolia. However, the divergence
times estimated in S. leprosula are not included in this study due to lack of
sampling and limited analysis. Recently, a study of the demographic history of a
tropical lowland rainforest tree species S. parvifolia was conducted by Iwanaga et
al. (2012). It revealed that the divergence time of the Sumatra-Malay and Borneo
groups is in the range from 2.7 to 0.7 MYA, which corresponds to the late
Pliocene and the middle Pleistocene respectively.
The inferred demographic history of S. parvifolia suggests the presence of
a scarcely forested land bridge on the Sunda shelf during glacial periods in the
Pleistocene and predominance of tropical lowland rainforest in at least in
Sumatera and Borneo. In contrast, population structure and divergence history
similar to S. leprosula have been shown in some lowland rainforest species.
Comparable genetic differences between Sumatera and Borneo populations were
detected in S. parvifolia and S. leprosula (Cao et al. 2006). The deep split
between Borneo and other Sunda lineages was also demonstrated for
between Peninsular Malaysia and Borneo was found in the present study,
migration would be possible between Peninsular Malaysia and Borneo population
via the exposed Sunda shelf. More studies including wider sampling are required
to address this issue.
Implications for conservation of Shorea leprosula
The present results showed S. leprosula maintained a high level of genetic
diversity. Private alleles are the alleles which have low frequency and can show
the uniqueness of a population and it has been found in all Shorea leprosula
populations except WKa populations. This unique allele can be used as criteria for
conservation so that the genetic diversity can be maintained. Private alleles can be
preserved by limited logging activity and forest destruction. As the species
produce valuable timber, disruption of some these existing populations in future is
unavoidable. The high levels of genetic diversity promise a “massive gene pool”
for selection and manipulations. Thus, it is still not too late for tree breeders to
initiate a tree improvement program that can further improve the species for forest
plantations. All the present planting programs rely on natural stand seed
collections. The information on the mating system as reported by Lee et al.
(2000a; 2000b) and the genetic information of some of its population from the
present study could be used to instruct the establishment of several production
areas. The production areas should be established in the three genetically unique
populations (North Sumatera, Peninsular Malaysia and West Kalimantan). This
approach will grant an opportunity to affiliate conservation and utilization efforts
in constructive way. In addition, the establishment of seed production areas in
genetically unique populations will safeguard their elimination from short term
harvesting plans.
In situ conservation of S. leprosula requires a few populations. This is due
to the higher diversity within populations compared to among populations.
For Ex situ conservation, it is suggested that focus is given to variation among
individuals within populations so that all the variations are sampled. Population
selection should be done based on the highest diversity in terms of allele or