THE INFLUENCE OF SERVICE QUALITY, PRODUCT
QUALITY, AND PROMOTION, TOWARD CUSTOMER
SATISFACTION
(Case Study Blue Bird Regular Taxi)
By:
Mohamed Omar Jama 109081100027
FACULITY OF ECONOMICS AND BUSINESS STATE ISLAMIC UNIVERSITY ( UIN )
SYARIF HIDAYATULLAH JAKARTA
i
C U R R I C U L U M V I T A E
Name : Mohamed Omar jama
Nick name
: luqman
Date of Birth : 10 Octobar 1988
Place of Birth : Galkio mudug somalia
Gender : male
Marital Status : Single
Motto : “ if you can dream it u can do it”
Email: :
[email protected]
Educational Background
2009- 2013 : International Management, Economic and Business, State
islamic university Syarif Hidayatullah jakarta .
2005- 2008 : Imamu Nawawi Senior High School, Bosaso Somalia
2002- 2005 : Haji Ali bixi junior High School, Galkio Somalia
1996- 2002 : Abduulahi Bin Abas Elementary school, Galkio Somalia
Organizational Exprience
Student Board Nawawi Bosaso ( Head of Education ) 2007
Puntland Aid for Homeless Children organization ( Director ) 2008
Attributes
. have a good personality and friendly
v
ABSTRACT
The purpose of this research is to analyze the influence of service quality, product quality, and promotion toward customer satisfaction in blue bird regular taxi, researcher used a questioner in collecting data and also used SPSS to analyze the result of data.The analysis tools in this research are : descriptive statistic analysis, validity and reliability test of research instrument, classic assumption test (normality test, multicollinearity test, hateroscedasticity and autocorrelation test) to meet the requirement analysis, T test and F test for testing the research hypothesis. the result found that the variables : service quality, product quality, and promotion, simultaneously and partially have a significant influence or positive influence toward customer satisfaction.
ii
PREFACE
Assalamualaikum Wr. Wb
All praise to Allah SWT, The Most Merciful, The Most Beneficial and above all an abundance of His Gracious, Taufiq and His Guidance, because of Allah SWT i can finish this research.
Shalawat always gives to our prophet Muhammad SAW, all of his family and friends who always helped him in establishing this religion on the earth untill the end of the day.
In this opportunity i would like to thank for those who has been helping me in order to finished this thesis.
1. my special thank for my lovely mother Fatimah ahmed who has been helping and support me , who shed the lights whenever my spirit down. Your pray and your tears give to my successful life. You are the best mother in this world. Thank you Mom.
2. My gratitude appreciation to my beloved fother Omar Jama who always encouraging and support me. Thank you so much Dad.
3. All my brothers and sisters. Thanks for waiting me , your cheerful always create new spirit.
iii
5. Ade suherlan, S.E, MBA, MM, as my second supervisor, for his genuine cooperation and continous guidance during my research. His support is unforgettable .
6. Prof. Dr. Abdul Hamid, MS, as Dean of Faculty of Business and Economics state islamic university syarif Hidayatullah jakarta.
7. All my lecturers who have taught patiently. Mr . Arief Mufraini, Mrs Cut Erika, Mrs Leiz Suzanawaty, prof Margareth, Mr zainudin Bey, and all lecturers which i can’t say one by one. Thank you so much for your guidance.
8. Special thanks for Academic Staff. Mr Sugi, and others which help administration of my form student.
9. international office UIN jakarta all Directres and staff, thank you so much for your warm welcoming and unforgettable support.
10.All my friends in 2009 international management class. Fitri aiya sofia, Firas, Dipa, zaky, Rara, Rizki, Oji, Akira, Andre, Surya, Ari, taufik, Yaser, Vera, Gerry, Innez, and the others. And my friends in Accounting 2009 Batch.
11.All my somalians friends in UIN, Mohamed osman mohamed, hamza amin ali, Adnan, zaky, mohamed mo’alim, abdinasir, muhudin abukar ,
ahmed abdullahi, and others.
iv
13.My somalian friends in mohamaddiyah university jakarta, ibrahim ali, abdulqadir, halooyeelo, ahmed hussein ga’al and others.
Last but not least i realize this Thesis is still far from perfection, thus Suggestions and recommedantions from all parties are welcome. In order to improve my thesis.
Finally i hope this thesis will be usefull to all parties, especially for writers and readers in general, my allah bless us..
Wassalamu’alaikum Wr. Wb.
Jakarta, 13 September 2013
iv Brief of Figure
Figure 2.1 Marketing Concept ... 8
Figure 2.2 Conceptual Thinking ... 32
Figure 2.3 Normality PP plot Regression ... 62
Figure 2.4 Chart Histogram ... 63
Refrences ... 76
v Brief of Table
Table 2.1 Common Communication Platform ... 18
Table 2.2 List of Questioner Answer Value ... 38
Table 2.3 Measurement Scales ... 40
Table 2.4 Operational Variable ( Service Quality) ... 49
Table 2.5 Operational Variable ( Product Quality) ... 50
Table 2.6 Operational Variable ( Promotion) ... 50
Table 2.7 Operational Variable ( Customer Satisfaction ... 51
Table 2.8 Age... ... 54
Table 2.9 Sex ... 55
Table 3.1 Result of Validity and Realibility for Service Quality ... 57
Table 3.2 1 Result of Validity and Realibility for Product Quality ... 58
Table 3.3 Result of Validity and Realibility for Promotion ... 59
Table 3.4 Result of Validity and Realibility for Customer Satisfaction ... 60
Table 3.5 Result of Realibility Test ... 61
Table 3.6 Test of Multicollinearity ... 64
Table 3.7 Test of Heteroscedasticity ... 65
Table 3.8 Tes of . Autocorrelation ... 66
Table 3.9 Coefficient Determination ... 66
Table 4.1 T-Test ... 67
Table 4.2 F-Test ( ANOVA) ... 68
v
BRIEF CONTENTS
Curicullum Vitae ... i
Preface ... ii
Abstract ... vi
Brief Contents ... v
Brief Figure ... ix
Brief Table ... viii
CHAPTER 1 INTRODUCTION A. Background ... 1
B. Problem formulation ... 4
C. Purpose of Research ... 4
D. Benefit of Research ... 5
CHAPTER II LITERATURE REVIEW A. Marketing ... 6
1. Definition of Marketing ... 6
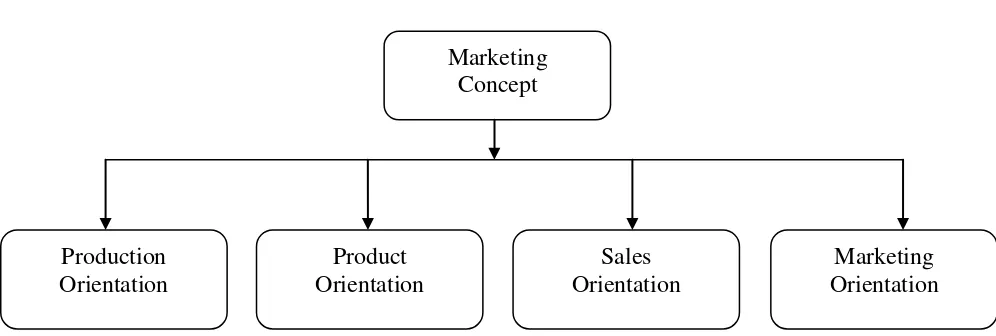
2. Marketing Concept... 7
3. Marketing Mix ... 10
B. Service Quality ... 12
1. Concept of Service Quality . ... 12
2. Definition of Service Quality ... 12
C. Product Quality ... 14
1. Definition of Product ... 14
vi
3. Classification of Product ... 15
4. Product Component ... 16
5. Dimension of Product Quality ... 16
D. Promotion ... 17
E. Customer Satisfaction ... 22
1. Theory of Customer Satisfaction ... 22
2. Customer Satisfaction Driven ... 23
F. Previous Research ... 26
G. Conceptual Thinking ... 30
H. Hypotesis... 33
CHAPTER III RESEARCH METHODOLODY A. Scope of The Research ... 34
B. Determination Sample Method ... 34
1. Population ... 34
2. Sample... 35
C. Kind of Data and Collecting Data Method ... 36
1. Kinds of Data ... 36
2. Collecting Data Method ... 37
D. Analysis Data method ... 39
1. Analysis Method ... 39
2. Data Quality Test ... 41
3. Classic Assumption Test ... 43
4. Multiple Regression ... 45
vii
6. Statistic Test ( F Test ... 47
E. Operational Research Variable ... 49
CHAPTER IV ANALYSIS A. General Discription of Research Object ... 52
1. History of the Company ... 52
2. Company Location ... 54
3. General Description of Respondents ... 54
B. Analysis And Discussion ... 55
1. Validity and Reliability ... 55
2. Classic Asumption Test ... 62
a. Normality Test ... 62
b. Multicollinearity Test ... 64
c. Heteroscedasticity Test ... 65
d. Autocorrelation Test ... 65
3. Multiple Regression ... 66
CHAPTER V CONCLUSION AND IMPLICATION A. Conclusion ... 72
B. Implication ... 73
C. Recommendation ... 74
1 CHAPTER 1
INTRODUCTION
A. BACKGROUND
The trend of world markets has changed noticeably, all of the service businesses are trying their best to improve their service and product quality by doing many efforts including promotion in order to make customers satisfied with their services. Customer satisfaction, a business term, is a measure of how products and services supplied by a company meet or surpass customer expectation. In a competitive marketplace where businesses compete for customers, customer satisfaction is seen as a key differentiator and increasingly has become a key element of business strategy. (Robinson, 2007: 84).
On the other hand the world has come full circle from selling to marketing and from seller’s market to buyer’s market. The customer today has
the option to buy what he thinks he should and from whom, being in his best interest. Product development, technological improvement, cost optimization and excellent service facility are very important for any organisation but their importance is only if the customer appreciates it. (Agyapong 2010: 64)
2 Thus, service organizations are shifting their focus from “transactional
exchange” to “relational exchange” for developing mutually satisfying
relationship with customers. Extended relationships are reported to have a significant impact on transaction cost and profitability, and customer lifetime value. Serving the customers, in true sense, is the need of the hour as the customer was, is and will remain the central focus of all organizational activities.
Companies worldwide lose half their customers every five years. But most managers fail to address that fact head-on by striving to learn why those defectors left. They are making a mistake, because a climbing switching rate is a sign that a business is in trouble. By analyzing the causes of switching, managers can learn how to stem the decline and build a successful enterprise. Reichheld (1996) suggests that by searching the root causes of customer departures, companies with the desire and capacity to learn can identify business practices which can win the customers back and re-establish the relationship on firmer ground.
Currently, Blue Bird has a fleet of 26,000 taxis across Indonesia, over 15,000 of which are used in Jakarta. The company serves more than 8.5 million passengers per month across the country. As such, it is Indonesia's largest taxi operator.It’s From taxi to container to heavy equipment, blue bird group is one company for all transportation needs. For many residents of indonesia’s capital and largest city, blue bird isn’t just another taxi company –
3 month across the country, blue bird group’s line of services encompasses a broad range of spectrum, from regular taxi ( blue bird & pusaka) up to executive taxi (silver bird) , limousine & car rental (Golden bird) , charter bus ( Big bird), logistic (iron bird logistic), propert (Holiday resort lombok and pusaka bumi mutiara), supporting services, and heavy equipment. Today blue bird group’s regular taxi services can be enjoyed in many indonesia’s largest
cities including jakarta, Bali, Bandung, Banten, Lombok Medan, and so on.
There are also to be found in the heart of major business and tourist destinations throughtout the country. Part of blue bird regular taxi’s success is owed to their ability to maintain such a high standard of quality and service over the years. Yet it is the strategic placement and easy availability of their vehicles that ultimately earn us the reputation as a most teliable transportation partner.Blue Bird, Indonesia’s largest taxi my its not the perfect one, the taxi services in term of ordering by call is not quit enough and it’s not good as many customers expect from the company.This makes the researcher to analyze a study of customer satisfaction in blue bird regular taxi.
In order to provide findings,the addressed research tittle will be as follows “ THE INFLUENCE OF SERVICE QUALITY, PRODUCT QUALITY, AND
PROMOTION, TOWARD CUSTOMERSATISFACTION” ( case study blue
4
B. Problem formulation
To examine the influence of service quality, product quality and promotion this research underlines these following questions:
1. Is there any influence of service quality toward customer satisfaction in Blue bird regular taxi ?
2. Is there any influence of product quality toward customer satisfaction in blue bird regular taxi ?
3. Is there any influence of promotion toward customer satisfaction in blue bird regular taxi ?
4. Is there any influence of service quality product quality and promotion toward customer satisfaction in Blue bird regular taxi ?
C. Purpose of the Research
1. To analyze the influence of service quality toward customer satisfaction. 2. To analyze the influence of product quality toward customer satisfaction. 3. To analyze the influence of promotion toward customer satisfaction. 4. To analyze the influence of service quality product quality and promotion
5
D. Benefit of the Research
1. For the Author
Research is an excellent opportunity to apply theory to the case field of marketing for the real world of practice and to develop ideas about consumer behavior, especially the strategic of marketing for increasing with the amount of purchase. And also it is to deepen, understand,and apply the knowledge that has been gained at the bench compiler lectures mainly in thefield of marketing management author field. And compare them with actual conditions on thefield, so it is not only able to observe but also contribute useful knowledge to the world ofmarketing.
2. For the company
The results for this study can be used as an input which useful for companies to know the variables that have not been in accordance with the wishes and needs of consumers so that the company will be easy to develop and to improve of product, especially the attributes of product.
3. For UIN Syarif Hidayatullah
6 Chapter II
LITERATURE REVIEW
A. Marketing
1. Definiton of Marketing
Marketing is the process by which companies create value for customers and build strong customer relationship in order to capture value from customer return. Kotler (2008:228).
Marketing is an organizational function and a set of processes for creating,communicating, delivering value to customers and for managing customer relationships in ways that benefit the organization and its stakeholders (Kotler, 2009 :5).
Marketing is important to all types of organizations because it focus on satisfying the needs of customers. Marketing activities are performed by people in various positions at different organizations. interacting with people is a major component of most marketing positions. (Forge 2006:147).
7 a profit forthe firm by consume – mating the exchange of product or service with those customers who need or want them. And the role advertising is to promote – to inform, persuade, and remaind groups of customers, or markets, about the need – satisfying value of the company goods and services (William Arens and david H. Schaefer, 2007:6).
From definition above we can conclude marketing is the activity to delivering value the product to customers, because value of product very important factor that has the association to efforts for fulfilling the consumer needs. In a company, marketing is one of the main activities the company effort to survive in running business, growing and getting the profit. The activities of marketing also must give the satisfaction for the consumers if the company want to keep business running.
2. Marketing Concept
After we discuss about the definition of marketing, so that we should know the concept of marketing. According to Kotler (Kotler, 2009:5) marketing is about identifying and meeting human and social needs. One of the shortest goods definitions of marketing is “meeting
needs profitably”. Marketing has been defined as an organizational
function and a set of processes for creating, communicating, and delivering value to customers and for managing customer relationships in ways that benefit the organization and stakeholders.
The concept of marketing has changed and evolved over time.
8 businesses in the past followed this concept. Their thinking, orientation or ideology put other factors rather than the customer first. Let us examine reducing costs by mass production. By reaching economies of scale the business will maximize profits by reducing costs.
(Kotler,2009:18) says the production concept is one of the oldest concepts in business. It holds that consumers will prefer products that are widely available and in expensive.
Managers of production-oriented businesses concentrate on achieving high production efficiency, low costs, and mass production.
9 b. Product Orientation
The company believes that they have a superior product, based on quality and features, and because of this they feel their customers will like it also. Kotler (2009:19) says the product concepts propose that consumers favor products that offer the most quality performance, or innovative features. Managers in these organizations focus on making superior products and improving them over time. However, these managers are sometimes caught up in a love affair with their products. A new or improved product will not necessarily be successful unless it is priced, distributed, advertised, and sold properly.
c. Sales Orientation
The focus here is to make the product, and then try to sell it to the target market. However, the problem could be that consumers do not like what is being sold to them. Kotler (2009:19) says the selling concept holds that consumers and businesses, if left alone, would not buy enough of the organizations products. The organization must, therefore, undertake an aggressive selling and promotion effort. The selling concept is practiced most aggressively with unsought goods, goods that buyers normally do not think of buying, such as insurance, encyclopedias, and cemetery plots.
d. Market Orientation
10 methods, to appropriate processes are developed to make sure information from customers is feedback into the heart of the organization. In essence all activities in the organization are based around the customer. The customer is truly king. Kotler (Kotler, 2009:19) says the marketing concept holds that the key to achieving organizational goals is being more effective than competitors in creating, delivering, and communicating superior customer value to your chosen target markets.
3. Marketing Mix
The marketing mixdiscussion explains in detail the selected strategy consisting of product, promotion, distribution, and price, and the rationale for it. If marketing research has been done on these elements or is planned, it can be discussed in this section (J Paul Petter and James H. Donelly, Jr., 2007 : 781).Product is the product section details a description of the product or brand, its packaging, and its attributes. Product life-cycle considerations should be mentioned if they effect the propased plan .
11 b. Distribution is the distribution discussion describes and justifies the appropriete channel orchannels for the product. This incluedes types of intermediaries and specifically who they will be.
c. Price is the pricing discussion starts with a specific statement of the price of the product Depending on what type of channel used, manufacturer price, wholesale price, and suggested retail price need to be listed and justified.
According Kotler (Kotler, 2009:118) especially popular with packaged goods marketers such as Procter & Gamble, Clorox, and Colgate, the finding from marketing – mix modelling are used to allocate or re – allocate expenditures. Analysis expoler which part of ad budgets are wasted, what optimal spending level are, and what minimum investment levels should be.Although marketing – mix modeling helps to isolate effects, it is less effective at assessing how different marketing elements work in combination. Reibstein notes other shortcomings :
Marketing – mix modelling focuses on incremental growth instead of baseline sales or long term effect.
a. Despite their importance, the intergration of matrics such as customer satisfaction,awareness, and brand equity, into marketing mix modeling is limited.
12 B. Service Quality
1. Concept of Service Quality
A service is any activity of benefit that one party can offer to another that is essentially intangible and does not result in the ownership of anything. Its production may or may not be tied to a physical product ((kotler, 2008: 225).
A service is a time-perishable experience performed for a customer acting in the role of co-producer ( Fitzsimmons, 2007:4).
On the whole, service is including all economic activity that makes result not in physical product or construction, commonly it’s consumed at one time when the product resulted and give the additional value, such as convenience, entertainment, happiness, and healthy or solution of the problem that face by the customer ( Baruch 1997:50).
2. Definition of Service Quality
Service quality is effort in order to fulfill the customer needs and customer willingness also exactly in delivery to equilibrium the customer expectation. Tjiptono (2008:208).
While Chandra (2005: 37) said that quality as the dynamic condition that has relationship with the product, service, human resource, process and the environment that could fulfill or can pass the expectation.
Service quality is essential for an organization’s survival and
13 (Gronroos, 2001: 98). Service quality is a form of attitude representing a long-run, overall, evaluation, which is different from customer satisfaction, a more short term, transaction specific judgment. The level of customer
satisfaction is a result of the customer’s comparison of the service quality
expected in a given service encounter with perceived service quality. This implies that satisfaction assessments require customer experiences while quality does not (Caruana, Money and Berthon, 2000 : 73).
Many researchers have recognized the need to develop measures of service quality. One of the most often used measures is the SERVQUAL based on extensive research in generic determinants of perceived service quality (Rambat lupiyoadi and A. Hamdani(2009: 234).
The SERVQUAL instrument is accepted as standard for assessing various dimensions in service quality , lupiyoadi and A. Hamdani (2009: 17). It is a concise multiple- item scale with good reliabity and validity that researcher use to better understand the service expectations and perceptions of consumers and as a result , improve service ( Rambat lupiyoadi and A.Hamdani (2009: 21).
SERVQUAL was also chosen because it is valuable when it is used periodically to track the service quality trends, and when it is used in conjunction with other forms of service quality measurement. (Rambat lupiyoadi and A.Hamdani (2009: 35).
14 A. Hamdani (2009: 53). All these five dimension are:
1.
Tangible : refers to appearance of physical facilities, equipment, personal, and communication materials, including all physical products that are involved in service delivery, and even other customers.2.
Reliability : refers to ability to perform the promised service dependably and accurately. Service is performed with high accuracy and thoroughness every time.3.
Responsiveness : refers to willingness to help customers, provide prompt service and how fast the service is provided.4.
Assurance : refers to know and courtesy of employees and their ability to convey trust and confidence.5.
Empathy : refers to the firm provides care and individualized attention to its customers.Customers use these five dimensions to form their judgments of service quality, which based on a comparison between expected and perceived service.
C. Product Quality
1. Definition of product
15 the technical detail involve in production a product. Most customer think about the a product in terms of the total satisfaction provides.
Aproduct is a set of tangible and intangible attributes, which may include packaging, color, price, and brand, plus the seller service and reputation. A product may be good, service, place person, or idea. In essence, then customers are buying much more than a set of attributes when they buy a product. They are buying want-satisfaction in from of the benefits they expect to receive from the product (Walker 2007: 209). 2. Concept of Product Quality
According to (Kotler 2008: 214) product quality is one of the
marketer’s major positioning tools. Quality has a direct impact on product
or servive performance. Thus, it is closely linked to customer value and satisfaction. In narrowest sence quality can be defined as “ freedom from
defect” . But most customer-centered companies go beyond this narrow
definition.
The American society for quality defines quality as the characteristic of a product on its ability to satisfay or implied customer needs.
3. Classification of product
Kotler (2008:250) said there are two kind of product first is consumer product and the second is industrial product.
16 b. Industrial product is a product bought by individual and organizations
forfurther processing or for use in conducting a business. 4. Product Component
According to Bartlett and Han (2000: 189), to provide the benefits for the consumers want, needed to integrate the components that make a product effectively. These consist of product features as seen below: a. Quality ; As the product component, product quality repsesent how
well a product does what it is supposed to do as defined by customer. b. Design ; Product design includes the styling, aesthetics, and function
of product.
c. Branding ; It is critical that firm identifies its products to distinguish from similar products offered by competitors.
d. Packaging ; Packaging is the container or wrapper for a products, it typically includes a label, a printed description of the product package. 5. Dimension of Product Quality
17 too.Hence , the opinion of someone toward quality is according to the person sees it.
From the five dimensions mentioned above can be explored one by one as follows , Meenaghan (2008: 78),) :
a. Performance is the product uniformity with premier functions or operational characteristics from certain product.
b. Features are specialty of the product which can differs from the other product, which is a complete characteristic and could make a postive imagination form consumer.
c. Durability is a level of product duration application or the long life time limit of product.
d. Conformance is products suitability with circumstances or certain measurement or how far characteristic of the design and operation that fulfilled the standard that alrady made.
e. Perception is a fanatic of the consumer toward the brand of certain product because of the image product reputation.
D. Promotion
18 an interest and ultimately the consumer decides to purchase products, goods or service on offer.
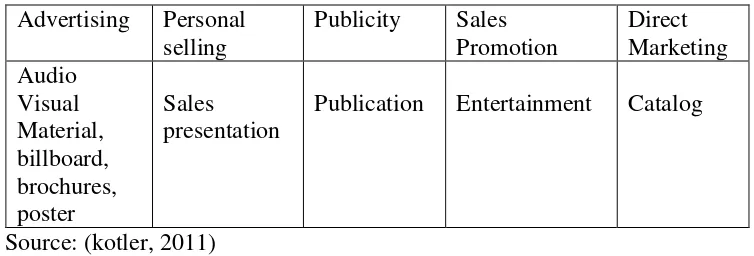
Table 2.1 list numerous communication plat forms company communication goes beyond those specific platform. The product styling and price, the shape and color of the package.
The sales person manner and dress the store decor, company stationery all communicate something to buyers. Every brand delivers an impression that can strengthen or weaken a customer view of company.
Table 2.1
Publication Entertainment Catalog
Source: (kotler, 2011)
According to jefkins (2000) promotion divided in to two parts, namely promotion above the line and below the line
1. Above the line
19 and promotion films like these historians clearly convey the message to consumers every product on offer in the advertising .
In terms of cost, above the line activities require relatively high costs, particularly cost of advertising on television
2. Below the line
This promotion can take the form of add-on services performed by the salesperson, the grating of sponsorship in an activity, carrying out social activities, points of sales materials such as posters, banners and etc.
Below the line promotion is more emphasis on character and nature of the products. Below the line promotion is more emphasis on character and nature of product development be promoted so that a positive image of a product can be created with both cost efficiency, many advertisers just below the line activities.
1. Promotion mix
20 a. Advertising
Advertising is all forms of non-personal presentation and promotion of ideas goods or services by the corporate sponsors. ( kotler, 2008). Advertising can be used to build long term image for a product and on the other hand also can speed up sales. Adversting can efficiently reach many purchases that spead out geographically with a low cost for each apprearance. ( kotler 2008).
b. Publicity and public Relation
According to Rismiati and suratno (2001) publicity is some information about people, goods or organization that is prepared in the editorial room of a media free of charge to be read, seen or heard by the customers or potential customers with specific intent to achieve sales goals.Publicity is usually done in the form of news or editorial commet about the product or services from the company. Publicity and public relations functions as a mediator between the company and society at large.
21 targeted previously, and (3) the ability to dramatize a company or product (Rismiati and suratno, 2001).
c. Personal selling
According to shimp (2000: 56) personal selling is form of communication between individuals in which the salesperson or salesperson to inform, educate, and make persuasive to prospective buyes for buy products or services. Sales of personal is the most effective tools in advanced stages of the buying process, especially to build preference, beliefs and action of the purchase. ( kotler, 2008).
d. Sales promotion
Sales promotion are short-term intensive offerd to customers and intermediaries to stimulate the purchase of product (lovelock and wright, 2005: 73). Sales promotion consists of all marketing activities that try to stimulate the action of the rapid purchase of a product or the purchase in a short time.Sales promotion is directed both to the trade and consumers, Kotler (2008:64) , cites three benefits of sales promtions as follows:
1. Communication tool
22 2. Provide incentive
Sales promotion combines a number of freedom, encouragement or contribution that gives value to the consumer.
3. Persuade
Sales promotion is persuade for to make purchase e. Direct Marketing
According to kotler (2008:164) direct marketing is an interactive marketing system that uses one or more advertising media to generate responses and / or transactions that can be measured at a site. In direct marketing, promotional communication in the show directly to the individual consumer level, with the aim that those message responded to consumers concerned.
E. Customer Satisfaction.
1. Theory of Customer satisfaction
According to kotler (2008: 136), customer satisfaction is a
person’s feelings of pleasure or disappointment that result from
comparing a prdoct’s percieved performance (or outcomes) to their expectations.
According to Hoyer (2005: 98) satisfaction can be associated with feeling of acceptance, happiness, relief, and delight.Customer satisfaction
23 experience, or some part of it. Customer satisfaction is a pleasurable fulfillment response while dissatisfaction is an un pleasurable one (Buttle, 2004).
When the service quality exceeds the expectations, the service provider has won a delighted customer. Dissatisfaction will occur when the perceived overall service quality does not meet expectations (Looy,
Gemmel & Dierdonck, 2003). Sometimes customer’s expectations are met,
yet the customer is not satisfied. This occurs when the expectations are low (Buttle, 2005). For example, the customer expects the flight to be late and it gets late.
While the literature contains significant differences in the definition of satisfaction, all the definitions share some common elements (Giese and Cote, 2002). When examined as a whole, three general components can be identified:
a. Consumer satisfaction is a response (emotional or cognitive).
b. The response pertains to a particular focus (expectations, product, consumption experience)
c. The response occurs at a particular time (after consumption, after choice, based on accumulated experience, etc).
2. Customer satisfaction Driven
24 to the exprience of Handi irawan D, MBA in Fitri Amri (2009:24), Marketing and Research consultant from frontier says there are five
primary driver of customer satisfaction’’
a. Product quality
Consumer satisfied after buying and using the product, where actually the product is fine. This product quality is globally dimensions at least elements from product quality: performance, durability, feature, reliability, consistency, and design.
b. Price
For sensitive consumer usually low price is an important source of satisfaction because they will get satisfaction of high value of money. This price component is not important for those who are not sensitive toward price.
c. Service quality
Service quality is always depends on three things: system, technology, and people. This factor of human being is giving into contributions is about 70% . it does not caused amazement, satisfaction toward service quality usually hard to imitate.
The concept of service quality is believed that have five dimensions that is reliability, responsiveness, assurance, empathy, and tangible. d. Emotion
25 e. Easy way to get product and service
Consumers get the products available in places easily accessible by consumers when needed, and when consumers have complaints or assistance to users of the product, consumers get good service and quick response.
Customer satisfaction is defined as a customer’s overall evaluation of the performance of an offering to data. This overall satisfaction has strong positive effect on customer loyalty intentions across a wide range of product and service catagories ( Gustafsson , 2005).
From these five different drivers, could be concluded that it is not enough for the company to make only the strategy of the company and program of increasing the level of customers. Next step will making long term plan and do make research to many companies. To ask obstacles that faced by company in order to increase the customer satisfaction and look into the drivers of each different companies.
In the survey, the company will get all information that can conclude whether getting research to high level of customer satisfaction is enough or not only by satisfied by using product or service only (Recce, j and inbakaran 1999: 189).
26 Determining how well a company and its major competitors are succeeding in satisfying these xpectation and requirements.
F. Previous Research
1. Previous research conducted by Gloria K.Q Agyapong in a international journal of business and managment Vol. 6, No. 5; May 2011. Entitled
“The Effect of Service Quality on Customer Satisfaction ” The regression
model showed that 63% (R2 = 0.633) of the observed variability in total customer satisfaction is explained by the total service quality variables. Further, the regression model shows how the individual service quality variables affect customer satisfaction. The result indicates that all the service quality items; competence, service tangibility, , security, communication and reliability are good predictors of customer satisfaction. The significance of the F-Statistics (F-value = 130.0) indicates that there is a relationship between the dependent variable (CS) and the six independent variables (service quality factors). In other words, since the observed significance level is less than 0.005, it indicates that the service quality items are the main factors that affect customer satisfaction of Vodafone (Ghana).
27
route to customer satisfaction. Indications of a successful brand building strategy are found when companies provide quality services relative to other companies within the same industry.
28 As significance (sig.) in, third hypothesis is less than 0.05 therefore, this hypothesis is approved. The following table shows result of the analysis of variance (ANOVA) for hypotheses of study. ANOVA provides a statistical test of whether or not the means of several groups are all equal, and therefore generalizes t-test to more than two groups. ANOVAs are helpful because they possess an advantage over a two-sample t-test. Doing multiple two-two-sample t-tests would result in an increased chance of committing a type I error. For this reason, ANOVAs are useful in comparing two, three or more means.
According to statistical analysis in this section the results indicates that customer service and product quality has been influential on customer satisfaction and also there is a positive relationship between customer service and product quality with customer satisfaction and loyalty in the context of the Indian automotive industry.
29 was conducted to determine the reliability and validity of the questionnaire . From Finding there were a positive significant relationship between place/ambiance (r.0,563, p: 0,000) and service quality (P:0,544,p:0,000) with customer satisfaction.
The research conduct in Hong kong by kivela, inbakaran and recee (2002:189) analyzed customer satisfaction factors based on five dimensions which are first and last impressions service excellence, ambiance excellence, food excellence and feeling comfortable eating there and reservation and parking. the population was 600 employees which consist of the total number of sample 150. The type of sampling that was used simple random sampling A croanbach alpha more than 0,63 indicated the variable Met the acceptable of reliability analysis. In terms of each variable had factor of 0,50 indicating it met acceptable standard of variable analysis (Kivela.J Recce J and inbakaran 2002:189).
4. Previous research conduct by Obasan, Kehinde A nad Soyebo yusuf A. Department of Business Administration Olabisi Onabanjo university in
Nigeria. In their Research “ This study revealed that promotion has a
30 and Chew (2006) also supported that by offering the right promotional tools, it can help organizations carefully plan their promotionalstrategies by giving preference to the more effective tools. It is vital because a specific marketing strategies decision assists the company to minimizecost and maximize their profit. Hence, this study revealed that promotion is a good marketing tool for survival, sustenance and expansion of business in theNigerian Telecommunication Industry.
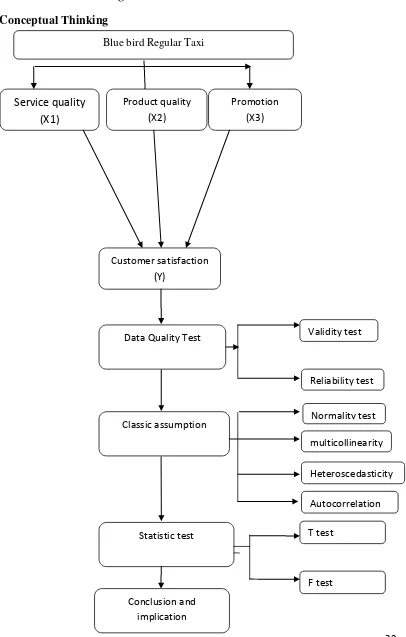
G. Conceptual Of Thinking:
a. understanding customer satisfaction
31 The framework in this study illustrate the relationship of the independent variable in this case is the service quality (X1), product quality (x2) and promotion (x3) towards customer satisfaction dependent variable (Y).
32 Figure 2.2
Conceptual Thinking
Blue bird Regular Taxi
Customer satisfaction (Y)
Service quality (X1)
Product quality
(X2)
Promotion
(X3)
Data Quality Test
Classic assumption
Statistic test
Conclusion and
implication
Validity test
Reliability test
Normality test
Heteroscedasticity multicollinearity
Autocorrelation
T test
33 H. Hypotesis
Hypothesis that is used by the authors in this study are:
Ho1 : there is no influence between service quality toward customer satisfaction.
Ha1 : there is influence between service quality toward customer satisfaction.
Ho2 : there is no influence between product quality toward customer satisfaction.
Ha2 : there is influence between product quality toward customer satisfaction.
Ho3 : there is no influence between promotion toward customer satisfaction.
34 Chapter III
Research Methodology
A. Scope of The Research
The scope of this study is the analysis of the influence of Service quality Product quality and Promotion toward Customer satisfaction of product of Blue bird regular taxi.
Selection of study sites (sampling) is done intentionally by the respondents who deserve to bette object of research and use these products, that is the people as customer of blue bird regular taxi.This is done because the author assume that the population is on Ciputat not only come from one area but also come from different areas and even abroad.
This search were begun on Middle of March until september and the scope only bule bird regular taxi customers.
B. Determination Sample Methode
1. Population
35 A population is the aggregate of all the elements that share some common set of charateristics and that comprise the universe for the purpose of marketing research problem, (Maholtra, 2004: 314).
Population is the generalization which consists of object and subject of a certainquantity and characteristics applied by researchers to learn and then drawn the conclusion Population is subject or object which have certain qualities and characteristics are determined by researcher. Thus, the population is not only people but also objects or other natural objects. Population also not only quantity, but includes all of characteristics‟s subject or object (Sugiyono, 2011:80).
2. Sample
Samples are selected using non probability convenience sampling by means of sampleunits drawn easily be reached anywhere and anytime, is not troublesome to measure and cooperative (Abdul Hamid, 2007: 30).
Sample is a subject of the population that should represent that entire group. Or thesample is a subset of the population, and the sample unit pertains to the basic level ofinvestigation (Burns, 2005: 334).
A sample is a member of the selected population using a specific procedure that is expected to represent its population (Sugiyono, 2007:57).
Sample is a subgroup of the elements of the population selected forparticipation in the study (Maholtra, 2009:373).
36 as participants. In this research use 100 respondents for collectiong data. According (Subiyanto, 1997:103) in the development of this study researchers used a100 questionnaire respondents. Use of these 100 questionnaires with reasons-technical reasons as follows :
a. The total population is not known with certainty (Unlimited).
b. The use of probability is not operational in the field, because it will tend to bias.
c. Analysis of inter-section was not used in the study.
d. Cost and time available did not allow researchers to use probability samplingoperation.
C. Kind of Data and Data Collecting Method
1. Kinds of data
Data collection methods used in this study is as follows:
a. Primary Data
Primary data are orginated by a researcher for the specific purposes of adressing the problem at hand (Malhotra, 2004: 102).
Primary data are original data collected by researchers to answer research specifically (Istijanto, 2009:44).
b. Secondary Data
37 obtained from books, scientific journals, the Internet, mass media research reports and principal problems associated with this research.. Secondary data is the result of studies done by others and for different purpose than the one for which the data are being reviewed (Donald cooper, 2006:89).
According to (Istijanto, 2009:38) secondary data is the data that has been collected byothers not by their own researchers to other purpose. This means that the researchers simply note, accessing, or requested them (sometimes already just the information) to other partiesthat collect in the field. Researchers only use existing data for research. To be able to obtain a strong foundation and concepts in order to solve existing problems, the researchers conductedthe study of literature by reading a book and journal literature and the journal that have associated with the thesis theme.
2. Collecting Data Method
Data used in this study are primary data. Primary data is data obtained directly from the source first. Data collection is done by:
1. Questionnaire
Questionnaire is a formalized set of questions for obtaining information for respondents.It has three specific objectives (Maholtra, 2009:330).
Three specific objectives (Maholtra, 2009:330)
38 and able to answer.
b. A questionnaire should be written to minimize demands imposed on respondents.It should encourage them to participate in the entire interview, without biasing their responses.
c. A questionnaire should minimize response error. These errors can arise from respondents who give inaccurate answers or from reserchers incorrectly recording or analyzing their answers.
Questionnaire method is a method to obtain data that is done by providing a list of questions that will be filled by respondents including questions about the variable service quality, product quality, and promotion of users Blue bird regular taxi to determine the extent to which it these things affect customer satisfaction of Blue bird regular taxi.
In this questionnaire there are two parts, namely:
1. Part 1: concerning the respondent data like name, gender, and age 2. Part 2 : on the list of questions that will be filled by the respondent.
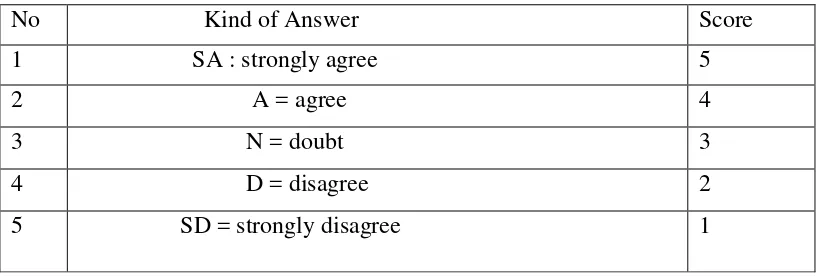
Table 2.2
List of Questionnaire Answer Value
39
D. Analysis Data Method
1. Analysis Method
a. Method of Analysis
The researcher use multiple regression analysis to analyze the independent variable on the dependent variable. This calculation method of the analysis carried out by SPSS program
b. Descriptive Statistics
Descriptive statistics used by researchers to provide information about the main characteristics of variables and demographic list of respondents.
Descriptive statistics provide a picture or description of data which can be seen from mean, standard deviation, variance, maximum, sum, range, kurtosis and skewness (Imam Ghozali, 2005:19 )
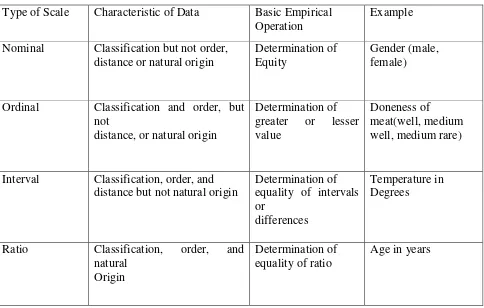
40 properties of order and equal distance between points and withmutually exclusive and exhaustive categories; data that incorporate equally of interval (the distance between one measure and next measure). Ratio scale is scale with properties or categorization, order, equal intervals and unique origin; number used as measurements havenumeric value.
Table 2.3
Measurement Scales
Type of Scale Characteristic of Data Basic Empirical Operation
Example
Nominal Classification but not order, distance or natural origin
Determination of Equity
Gender (male, female)
Ordinal Classification and order, but not
Interval Classification, order, and distance but not natural origin
Determination of equality of intervals or
differences
Temperature in Degrees
41
2. Data Quality Test
To get good results then before the statistical test, data must to be tested using validity and reliability.
a. Validity Test.
Validity is a characteristic of measurement concerned with the extent that a testmeasures what the researcher actually wishes tool reflect true differences among participantsdrawn from a population ( Donald Cooper, 2006:765).
According to Imam Ghozali (Ghozali, 2005:45) the validity of this research is used to measure the legality of a questionnaire. Test validity used to measure the legal valid or unvalid of a questionnaire. A questionnaire is said valid if the questions on the questionnaire is able to reveal something that will be on the questionnaire measure. The total score on test validity of said valid if the number of scores > 0.30 (sugiono, 2007 : 178).
b. Reliability Test.
42 Reliability refers to the extent to which a scale produces consistent results if repeated measurements are made. Therefore, reliability can be defined as the extent to which measures are free from random error (Maholtra, 2006: 273). According to Imam Ghozali (Ghozali, 2005:42) reliability measurements can be done in 2 ways:
1. Measure or measurements repeated: here someone will be given the same questions at different times, and then see if he remains consistent with the answers.
2. One shot or one-time measurement: here measurement only once and then the results werecompared with another question or measure the correlation between answers to questions. SPSS provides facilities to measure the reliability with statistical uni Cronbach alpha (α). A construct or variable is said cronbach
reliable if the value of alpha > 0.60.
43
3. Classic Assumption Test
a. Normality Test
Testing normality is a test of the normality of data distribution. Test is a test of the most widely performed by parametric statistical analysis. The use of normality tests becausethere is a parametric statistical analysis, the assumptionsthat must be owned by data is that the data are normally distributed (Ghozali, 2005:110).
44
b. Multicollinearity Test
According to (Ghozali 2005:91), multicollinearity is used to indicate the existence of linear relationships between free variable (Independent) in the regression model. If the independent variable, it can be perfectly, correlated with perfect multicollinearity.
According to the (Wibowo, 2012: 87) one way to detect multicolinearity is to use a test tool called Variance inflation factor (VIF). If the value of VIF < 10 it shows on the model there are no symptoms of multicollinearity. In addition to the other methods that can be done is to correlate between the independent variables. When the value of the correlation between the independent variable is not greater than 0.5 then the model there is no multicollinearity.
c. Heteroscedasticity Test
This test assumption aims to find out whether in a regressionmodel, there was inequality a variance of residual of one observation and other observation.The model is said to have a problem if there is a variance heteroscedasticity variables in the model are not the same.
45 According to (Wibowo, 2012: 93) if the result has a significance probability value > alpha values ( 0.05) then the model is not experiencing heteroscedasticity.
d. Autocorrelation Test
Autocorrelation test is used for the sole purpose of knowing whether there is a correlation between members of a set of observed data and analyzed according to a (cross section). This test aims to see whether there is residual in an observation with other observation on the model. In these research, researcher using Durbin Watson test. A model can be expressed is not the case if probability value autocorrelation symptoms Durbin Watson > 0.05 (Wibowo 2012: 106).
4. Multiple Regression Analysis
Multiple Regression involves a single dependent variable and twoor more independent variables. The questions raised in the context of bivariate regression can also be answered via multiple regression by considering additional independent variables. ( Malhotra, 2004: 512).
The general form of the multiple regression model is as follows: Y = βo + β1X1 + β2 + X2 + β3 + X3 + ... + βkXK + e
46 It means:
Y = Customer Satisfaction a = Number Constant b1x1 = Service Quality b2x2 = Product Quality b3x3 = Promotion e = Standart error
5. T- test Statistic (Partial )
This test method is used to test the partial coefficient of the free variable to the variable bound by the hypothesis put forward. T test basically shows how much influence a single dependent variable. The probability is smaller than 0.05, then the result means that there are significant independent variables individually influence on the dependent variable (Ghozali, 2006:84).
1. If -t table < t test < + t table, then Ho is rejected and Ha is accepted, it means there is influence between
indepedent variable toward dependent variable.
47
Ho : Using servic quality, product quality, and promotion
there is no significant influence toward customer satisfaction.
Ha : Using service quality, product quality, and promotion there is significant influence toward customer satisfaction.
the criteria to making decision (significancy) with α = 0,05 a. If probability > α 0.05, so Ho accept. It means using
service quality, product quality, and promotion there is no influence toward customer satisfaction.
b. If probability < α 0.05, so Ho reject. It means service quality, product quality, and promotion there is influence toward customer satisfaction.
6. F- Test statistic (F- simultaneous test)
F test essentially indicates whether all the independent variables or independentvariables included in the model have jointly influence on the dependent variable or bound.The probability is smaller than 0.05, then the result means that there are significant effects ofindependent variables collectively against the dependent variable (Ghazali, 2005:84). The results of this F test in SPSS output can be seen in the ANOVA table. The null hypothesis (Ho) and alternative hypothesis (Ha) used are:
48 product quality, and promotion of blue bird regular taxi 2. Ha: β0 = 0, its mean there are influences of service quality,
product quality and promotion of blue bird regular taxi. To examine the influence with together independent variable toward dependent variable, so used the creteria, as follows : Ho : Using Service quality, product quality, and promotion there is no influence on customer satisfaction
Ha : Using service quality, product quality and promotion there is influence on customer satisfaction
.
a. If F count < F tabel, so Ho is accept. It means service quality,, product quality, and promotion there is no influence on customer satisfaction..
b. If F count > F tabel, so Ho reject. It means using service quality, product quality, and promotion there is influence on customer satisfaction .
E. Operational Variable
49 According to cooper (2007:155), independent variable is the variable manipulated by the researcher, thereby causing an effect or change on the dependent variable. In this research as independent variables are service quality (X1) Product quality (X2) and Promotion (X3).
2. Dependent Variable
According to cooper (2007: 156), dependent Variable is the variable measured predicted, or otherwise monitored by researcher, expected to be affected by manipulation of independent variable. In this Research as the dependent variable is customer satisfaction (Y)
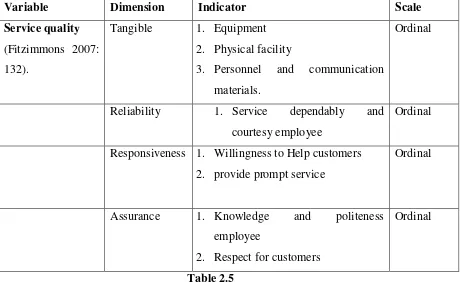
Table 2.4
Operational variable (service quality)
Variable Dimension Indicator Scale
Service quality (Fitzimmons 2007: 132).
Tangible 1. Equipment 2. Physical facility
3. Personnel and communication materials.
Ordinal
Reliability 1. Service dependably and courtesy employee
Ordinal
Responsiveness 1. Willingness to Help customers 2. provide prompt service
Ordinal
Assurance 1. Knowledge and politeness employee
2. Respect for customers
Ordinal
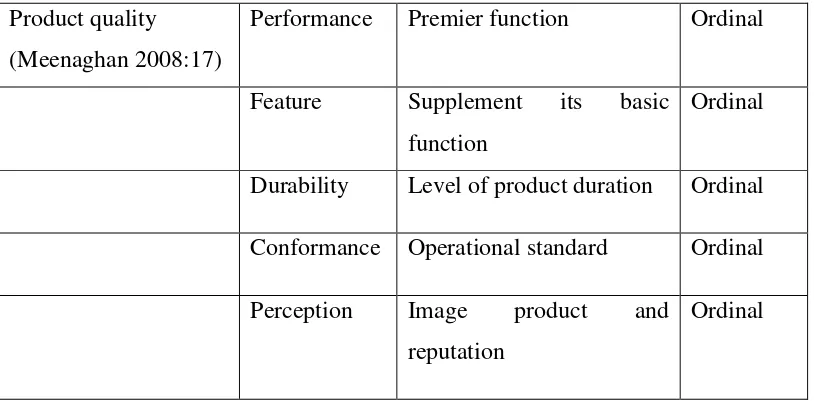
Table 2.5
Operational Variable (Product Quality)
50 Product quality
(Meenaghan 2008:17)
Performance Premier function Ordinal
Feature Supplement its basic function
Ordinal
Durability Level of product duration Ordinal
Conformance Operational standard Ordinal
Perception Image product and reputation
Ordinal
Table 2.6
Operational Variable (promotion)
Variable Dimension Indicator Scale
Promotion (Kotler Keller 2008: 63)
Advertising 1. Audio Visual materials 2. Billboard
3. Brochures poster
Ordinal
Personal Selling 1. Sales presentation Ordinal Public Relations 1. Publication Ordinal Sales Promotions 1. Entertainment Ordinal Direct marketing 1. Catalog Ordinal
Table 2.7
51
Variable Dimension Indicator Scale
Customer Satisfaction Peter (2007:181)
Professionalism 1. Understnad the expectation of customer 2. Provide opportunites
Ordinal
Empathy 1. How well company
succeeding in satisfying customer products available in places easily accessible by consumers when needed.
2. Delivery advice
Ordinal
Emotional 1. Pleasure response 2. Enjoylable
52 CHAPTER IV
ANALYSIS
A. General Description of Research Object
1. History of the Company
Back in 1972, well before Jakarta became a cosmopolitan of 12 million people, blue bird had been there. The actual embryo of the group was the golden bird, then known as chandra taksi, a car rental service catering to journalists and other visitors to the country. Before long the company earned a number of recommendations that helped in applying for a license to operate a taxi company.
From blue bird taxis and golden bird limousine and car rental, next came Big Bird ( 1979) with its charter buses. And more recently the silver bird executive taxi ( 1993). Over the past decade , Blue Bird group has seen a rapid expansion in all four business divisions and blue bird group is today more integrated than ever with services extended through out parts of indonesia.
Blue bird Becaome the pioneering taxi company to implement the strictuse of taximeters and radio communications on air- conditioned vechicles. Several service stations were also set up in jakarta to support daily operations of such vechicles.
From taxis, container to heavy equipment, blue bird group is one
53 capital and largest city, blue bird isn’t just another taxi company – it has become a way of life.
From a humble beginning of just 25 taxi cabs in 1972, blue bird group has gone through numerous trials and extensions to reach current fleet of around 28,904 fleets, Serving more than 8.5 million passengers per
month across the country, blue bird group’s line of services encompasses a
broad range of spectrum, from regular taxi ( blue bird & pusaka) up to executive taxi ( silver bird) , limousine & car rental ( Golden bird) , charter bus ( Big bird), logistic ( iron bird logistic), (propert) ( Holiday resort lombok and pusaka bumi mutiara), supporting services, and heavy equipment.
a. Vision and Mission
Vision
To be a sustainable quality driven company that ensuresthe continuing prosperity of all its stakeholders.
b. Mission statement
54
2. Company location
The blue bird company Head Office located in Jl. Mampang Prapatan Raya No. 60 Jakarta 12790 . the reason to choosing a location site of the company are :
a. Readily available workforce and very strategic location. b. Easy accessible to the customer.
c. Cleanliness, safe and comfortable environment.
3. General Description of Respondents :
Respondents in this study were customers of Blue bird regular taxi both in jakarta and Ciputat . Based on data from 100 Respondents who use blue bird regular taxi, through survey methods of data collection by questionnaire respondents obtained the conditions on age and gender.
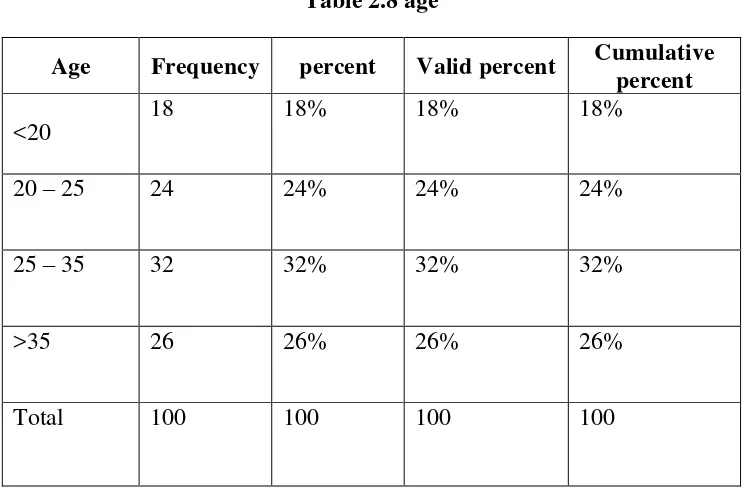
a. General Description of Respondents : age
Table 2.8 age
Age Frequency percent Valid percent Cumulative
percent
<20
18 18% 18% 18%
20 – 25 24 24% 24% 24%
25 – 35 32 32% 32% 32%
>35 26 26% 26% 26%
Total 100 100 100 100
55 Based on Table 4.1 can be seen that the percentage amount for the age of therespondents that most respondents are age 25-35 years as many as 32 people or 32%.
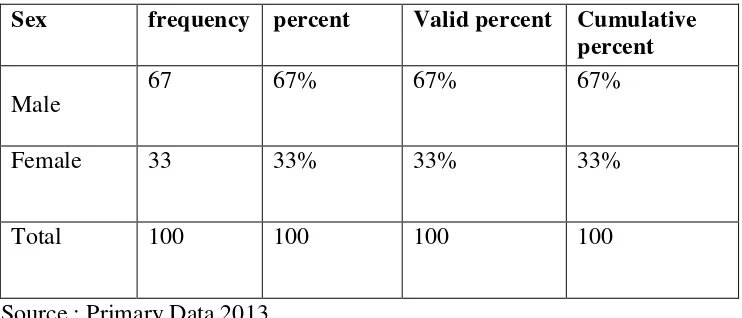
b. General description of respondents : sex
From the research conducted by the method of distributing a questionnaire to customers of blue bird regular taxi
Table 2.9 Sex
Sex frequency percent Valid percent Cumulative
percent
Male
67 67% 67% 67%
Female 33 33% 33% 33%
Total 100 100 100 100
Source : Primary Data 2013
Based on table 2.9 above can be seen that the largest percentage of male respondents was larger than the female respondents, with the number of respondents male gender for 67people or 67%
B. Analaysis And Discussion
1. Validity and Realibity Test
56 divided in to four variables which are service quality, product quality, promotion , and customer satisfaction.
According to Sugiono ( 2011: 178) test validity is used to measure the legal valid or unvalid of a questionnaire. A questionnaire is said valid if the questions on the questionnaire is able to reveal something that will be on the questionnaire measurement. The total score on test validity can be valid if the number of scores >0.30.
According to Imam Ghozali ( 2005: 42) reliablity measurement can be done in 2 ways:
1. Measure or measurement repeated: here someone will be given the same question s at different times, and then see if the remains consistent with the answers.
2. One shot or one time measurement: here measurement only running once and then the results were compared with another question or measure the correlation between answers to questions. SPSS provide facilities to measure the reliability with statistical uni
Cronbach alpha (α). A construct or variable is said cronbach
reliable if the value of alpha > 0.60.
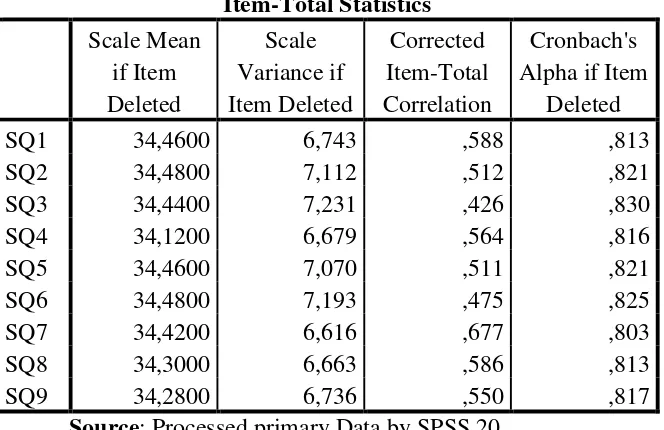
57 Table 3.1
Result of Validity and Realibity Test for Service Quality Item-Total Statistics
that all questions are valid, because the score of α > 0.30, it means the
data is valid and have positive correlation or the score corrected item total correlation is > 0.30, it means the data is valid.
Measurement result is reliable if the coefficient α > 0.60 ( Imam
58 Table 3.2
Result of Validity and Reliability Test for Product Quality Item-Total Statistics
Source: Processed primary Data by SPSS 20
Based on table above 7 question about Product quality it can be seen
that all The questions are valid, because the score of α > 0.30, it means
the data is valid and have positive correlation or the score corrected item total correlation is > 0.30, it means the data is valid.
Measurement result is reliable if the coefficient α > 0.60 ( Imam