213
Overall Equipment Efficiency (Oee) Improvement Through Integrating Quality
Tool: Case Study
Perumal Puvanasvaran
1,
Chan Yun Kim
2, Teoh Yong Siang
3 Perumal Puvanasvaran,Chan Yun Kim, Teoh Yong Siang1,2,
3Faculty of Manufacturing Engineering,
Universiti Teknikal Malaysia Melaka, Durian Tunggal, 76100 Melaka, Malaysia Phone: +606-3316002, Fax: +606-3316411, Email: [email protected]
Abstract – The purpose of this paper is to develop a macro framework that involving the implementation of integrating quality tools on improving Overall Equipment Efficiency (OEE) in autoclave study as to achieve the world benchmark of Overall Equipment Efficiency.A refinement of existing concept of OEE approach is developed primarily based on literature review. The methodology would be used as a set of standard operating procedures to be followed along project flow. The primarily procedures designed on emphasizing the observation and the empirically collected data, while implementation of quality tools are on analyzing the problem found in the previous stage of study and proposed alternative remedies to optimize the OEE. OEE as core quality tool in this study used to monitor the performance and measure the effectiveness of the autoclave curing process in order to achieve the world rating of OEE benchmark. This paper discussed on the implementation of integrating several quality tools which focus mainly to improve the current performance of OEE.
Keywords– Overall Equipment Efficiency (OEE), Quality tools, Value Stream Mapping (VSM), Failure Mode Effect Analysis (FMEA), Single Minute Exchange Die (SMED)
I. INTSRODUCTION
Overall equipment effectiveness (OEE) is seen to be the fundamental way of measuring performance efficiency. Overall equipment effectiveness (OEE) is the key measure of both total productive maintenance (TPM) and lean maintenance. The concept of OEE, introduced by Nakajima (1988), is being used increasingly in industry. It looks at the wider manufacturing aspects, not only the equipment availability and performance, but also the efficiency losses that result from rework and yield losses. Honda (2000) stated that OEE is a measure of how well equipment or lines are utilized in relation to their full potential. The main objectives to measure OEE is to make
constraints or “bottleneck” equipment run more
effectively. OEE and its individual factors will give a result on where the equipment is losing time.
In the measurement of the three factors, the key reasons that most operations of the study do not achieved high OEE percentages are generally caused by the six big losses which are breakdowns, setup and adjustments, small stops, reduced speed, startup rejects and the production rejects (Tajiri and Gotoh, 1992). These losses created during the operation would somehow reduce the efficiency of the machine and material usage, quality of products and the time utilization for the overall process.
In this study, autoclave is chosen as the subject of study among the processes of the production because it is the bottleneck that contributes to delay of the production and shipment. The problems exist in the autoclave include the excessive long setup time, unexpected breakdown or delay and sometimes the cancelation of curing process just before the scheduled time for the particular curing. Some of these problems happen in relatively short time and are usually neglected. This is somehow contributing to big loss when they are accumulated and there is a necessity to quantify the total loss in effectiveness of utilization for the autoclave.
To investigate the issues on hand, this paper is developed through few analysis tools which concerning on identifying the cause of low OEE in the company studied, while supportive tools are use in facilitating the implementation of OEE approach.
II.LITERATURE REVIEW
General knowledge of the quality tools that will develop in this study is included to serve as a guideline in designing and planning the project. This study is developed through OEE as the core quality tool in this project, and other related supportive tools to facilitate the implementation of OEE approach and will be discussed forward in later section.
A.Overall Equipment Efficiency
According to Tajiri and Gotoh (1992) the relationship between OEE and losses depends on equipment availability, their performance rates and the quality of the product. OEE monitors the actual performance of a machine relative to its performance capabilities under optimal manufacturing conditions.
According to Ericsson (1997), OEE attempts to identify
production losses and other indirect and “hidden” costs,
which are those that contribute with a large proportion of the total cost of production. These losses are formulated as a function of a number of mutually exclusive components (Huang et al., 2003), namely: availability (A), performance (P) and quality (Q). In essence, OEE is the result achieved by multiplying these three factors altogether.
Historical data of Overall Equipment Effectiveness (OEE) value was very low compared to the general manufacturing scenario will due to which the machines
iDECON 2012 – International Conference on Design and Concurrent Engineering
214 were not utilized effectively and hence production rate and volume was affected (Harsha, et al, 2009).
Dal et al. (2000) point out the OEE measure can provide topical information for daily decision making by utilizing largely existing performance data, such as preventive maintenance, material utilization, absenteeism, accidents, labor recovery, conformance to schedule, set-up and changeover data.
According to Jeong and Phillips (2001), definite clarification between equipment states should be defined to validate and facilitate the data collection system. This is because the methodology for designing the data collection system is a significant point of discussion.
It is apparent that the successful computation of OEE depends on the ability to collect data. If the data collected are unreliable, the OEE value computed may not reflect real equipment utilization. It is also important to recognize that each loss classified corresponds to an equipment state. In computing OEE, each company may require different equipment states due to the level of accuracy and their data collection ability (Jeong, K.Y. and Phillips, D.T., 2001).
B.Value Stream Mapping (VSM)
VSM is a very important step in the lean process before dividing into the task of waste elimination. VSM is simple and efficient method used to focus on the path a product takes through the value adding chain and to generate good ideas for how to develop, simplify and make it more efficient. VSM work is to prepare to implement any the improvement quickly (Daniel Hogfeldt, 2005).
To be able to see the whole flow of activities and to quickly discover where there is room for improvement some form of method to visualize the refining process is needed. In VSM work done on drawing a map of the information and material flows that are the essential parts of the production system. Purpose of VSM is to highlight sources of waste and eliminate them by implementing the future state value stream that can become a reality within a short period of time. (Daniel Hogfeldt, 2005).
C.Cause and Effect Diagram
A Cause-and-Effect Diagram is a tool that helps identify, sort, and display possible causes of a specific problem or quality characteristic. It graphically illustrates the interrelationships of various theories of the root cause of a problem. Cause and Effect Diagram are commonly referred to as Fishbone diagrams because the complete diagram resembles a fish skeleton or as "Ishikawa diagram" because it was invented by Kaoru Ishikawa. The diagram illustrates the main causes and sub-causes leading to an effect (symptom), (Scott and James, 2009). Cause and Effect Diagram is constructed through the following steps (Scott and James, 2009):
i.Identify the problem
Ensure the problem is clearly stated and clearly understood by everyone. Write down the exact problem you face in detail where appropriate identify who is involved, what the problem is, and when and where it occurs. Write the problem in a box on the left hand side of a large sheet of paper. Draw a line across the paper horizontally from the box where the arrangement looking like the head and spine of a fish, gives you space to develop ideas.
ii. Work out the major factors involved
Next identify the factors that may contribute to the problem. Draw lines off the spine for each factor, and label it. These may be people involved with the problem, systems, equipment, materials, external forces, etc. Try to draw out as many possible factors as possible. If you are trying to solve the problem as part of a group, then this may be a good time for some brainstorming. Using the 'Fish bone' analogy, the factors you find can be thought of as the bones of the fish.
iii.Identify possible causes
For each of the factors you considered in stage 2, brainstorm possible causes of the problem that may be related to the factor. Show these as smaller lines coming off the 'bones' of the fish. Where a cause is large or complex, then it may be best to break it down into sub-causes. Show these as lines coming off each cause line.
iv Analyze your diagram
By this stage you should have a diagram showing all the possible causes of your problem. Depending on the complexity and importance of the problem, you can now investigate the most likely causes further. This may involve setting up investigations, carrying out surveys, etc. These will be designed to test whether your assessments are correct.
D.Failure Mode Effect Analysis (FMEA)
Failure Mode and Effects Analysis is a risk management and quality improvement methodology, with the purpose of identifying the potential failure causes for products and processes, their quantification by the evaluation of the associated risks, the ranking of the identified problems in relation to their importance and the determination and application of corrective measures in order to address the greatest concerns. FMEA is one of the inductive methods for the evaluation of system reliability and security (Neago, 2008).
215 Purpose of FMEA is to analyse the design characteristics relative to the planned manufacturing process as to ensure the resultant product meets the customer needs and expectations. When potential failure modes are identified, corrective action can be taken to eliminate or continually reduce the potential for occurrence. The FMEA approach also documents the rationale for a particular manufacturing process. FMEA provides an organized, critical analysis of potential failure modes of the system being defined and identifies associated causes. It uses occurrence and detection probabilities in conjunction with a severity criterion to develop a risk priority number (RPN) for ranking corrective action considerations. When potential failure modes are identified, corrective action can be taken to eliminate them or to continually reduce a potential occurrence. (Mario Villacourt, 1992).
E.Single Minute Exchange Dies (SMED)
Single Minute Exchange Die (SMED) is an approach in Lean Thinking where setup time and changeover time can be reduced through a rapid change technique. SMED has as its objective to accomplish setup time in less than ten minutes. Although not all setups can be literally reduced to this time, between one and nine minutes, this is the goal of the SMED methodology (Shingo, 1985).
Dirk Van Goubergen (2000) state that an OEE calculation can easily show that reducing set-up times also provides substantial improvement of OEE. Setup reduction that applied in OEE cans also the waste of the poor quality products at start-up while the current working standard set-up method is more controlled.
F.Problem Solving Capability
The main focus of lean process is to reduce cost by eliminating non-value added activities; labeled as waste in every organization which either produce products or provide services. The problem solving capability of the employees is another important factor that derives the system successfully, including the cooperation of everyone from top to bottom. It is hard to deny that most of the manufacturing companies that are focusing on company strategy for cost reduction through eliminating wastages are remain to sustain in this competitive world. Lean process management definitely becomes their arms to fight to achieve this goal. (Puvanasvaran et al., 2008).
Lean Process Management System: Lean Process Management System enables any types of organization to reduce or eliminate wasteful practices. It is an integrated system developed and refined over the course of more than a decade. In addition, it is used to establish standardized conditions and methods to eliminate opportunities for waste. This has become a very difficult task for every manager and employees who are responsible for solving
problems to further improve the processes of eliminate waste.
People Management System: People management systems are those activities, practices, and procedures that
will empower the company’s people. They provide the
direction and challengers in the development of people. This system assists the employees in the implementation of
the company’s business plan. In order to realize this
tremendous benefit, people need to arm with clear objectives and proper skill sets. Unfortunately, these requirements are not common in the classic pyramid type of organization structure.
Business Management System: Business management
systems are the company’s practices, policies and
procedures. They plan and direct the activities of the
organization’s personals in applying company resources to
satisfy customer requirements. Business management system are critical because no company has unlimited resources. The winners in manufacturing are those who understand how to maximize the amount of value they add while minimizing the resources they require to add this
value. The most precious resources in today’s
manufacturing and business world in general is time. The objective of the lean process management system is to identify and eliminate wastages by removing non value added activities. People management systems need to provide the capability for rapid improvement and adoption to change. Hence, we must accept the fact that change is inevitable and that the speed with which the necessary modification are made is the deciding factor in our survival. The objective of the business management
system is to apply carefully the organization’s limited
resources, including capital and hard assets as well as time and human assets (Puvanasvaran et al., 2008).
III. METHODOLOGY
The study is categorized in four phase which are observation, data collection, data analysis, and the improvement action. Observation is to be done on the autoclave curing process. the operation of autoclave curing process is observed and being understood through the interview with the operator. Time study analysis is accomplished to figure out the issues that affect the OEE performance. Current OEE data is shown in phase two which is data collection. The data is developed through the calculation from all sources that get from the respective company which included the downtime losses report, the schedule of the curing process, the plan downtime for breakdown and other relevant activities and so on.
216 result. On the other hand, FMEA is used on identifying the risk priority number of the potential failure modes through severity, occurrence and detection of each sub-process computed. The failure mode with highest RPN value will be prioritized to be eliminating through the implementation of quality tool.
Final stage of the study is to propose the alternative solution which will contribute on improving the time loss in the process. SMED is proposed to use as a countermeasure on the improvement where SMED will be effective on the setup time and changeover time elimination. OEE improvement is shown in the final part of the study to prove that it will improve to a higher value of OEE through the elimination of the setup and changeover time.
A macro framework that can be used in any OEE implementation work is established in the end of the study where the methodology of using integrating quality tools can benefit in calculating OEE in any field of industry.
Table 3.0 Summary of methodology
Phase Tools and Techniques
1 Observation Process Flow 2 Data Collection OEE Approach
Bar Chart
3 Data Analysis Value Stream Mapping (VSM) Cause and Effect Diagram
Failure Mode Effect Analysis (FMEA) Pareto Chart
4 Improvement Action Single Minute Exchange Die (SMED)
IV. RESULTS AND DISCUSSION
A.Observation
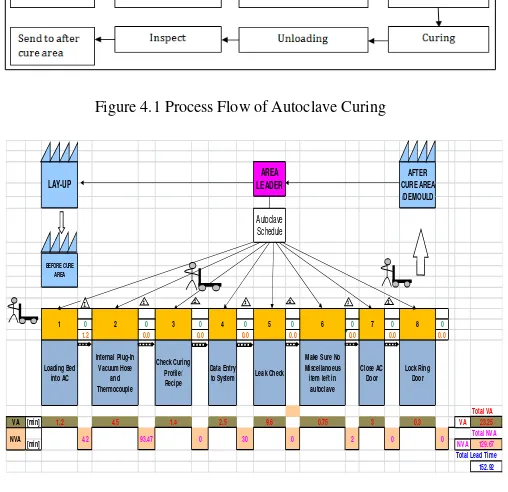
The process flow of curing department is received the curing mould from lay-up department and allocate it at the before cure area. The mould to be cured is being verified and the paperwork is checked. Vacuum and thermocouple are setting up on the mould after the verification. In the loading process, bed is load into autoclave, vacuum hose and thermocouple internal setting are to be done to connect it to the autoclave. The operator is then checked the curing recipe or profile form the system and enter the required data to the autoclave curing system. After the data entry, leak check to ensure that the vacuum hose and thermocouple are functioning and prevent the operation from unplanned shutdown hence performing specification to make a good product. The autoclave door is closed and the door ring is locked.
The mould start to be cured for a period of up to 6 hours depends on the time spent for each panel of product. The curing graph shown from the system is monitoring by the operators for the whole curing process. When the curing is end, the graph is being inspected. If there are any issues occurred, they will pass to the Material Review Board (MRB) to analyze the potential causes. The door ring is unlocked and autoclave door is opened. Vacuum hose and thermocouple is unplugging internally and tidy up. The
panel is stacking out from the autoclave by the cart caddy and change to stacker to move it to the after cure area. The cured mould is being inspect and sent to the downstream area which is demould department for the next action.
B.Data Collection
According to Nakajima (1988), the research indicated that under ideal conditions organizations should have Availability > 0.90, Performance ratio > 0.95 and Quality ratio > 0.99. These figures would result in an OEE>0.84 for world-class firm and Nakajima considers this figure to be a good benchmark for a typical manufacturing capability. The data of OEE is shown in Figure 1 where the data is collected through time study from September 2011 to February 2012.
Figure 4.0 Graph of Current OEE in Company
The calculation of the OEE is based on the downtime losses report, machine utilization, OEE report and the schedule of the production planning report from the company. Bamber et al. (2003) remark that OEE is often used as a driver for improving the performance of a business by concentrating on quality, productivity and machine utilization issues and hence aimed at reducing non-valued adding activities often inherent in manufacturing processes. One the other hand, the low performance rate in OEE that is corresponding to speed losses, minor stoppages and idling could be observed from the long waiting time obtained from time study. (Silvester et al., 2004).
i. Value Stream Mapping
217 state value stream that can become a reality within a short period of time. (Daniel Hogfeldt, 2005). Process flow of autoclave curing is as followed:
Figure 4.1 Process Flow of Autoclave Curing
Figure 4.2 Value Stream Mapping of Loading Process
Unplanned downtime losses covered with the time spent for setup time, jig change or unloading and the waiting time for the material, we are look into the big picture of the loading process as shown in Figure 4.2 as to identify the wastages of time spent on the sub-processes respectively due to the time spending in the process show bottleneck in the VSM which contribute 129.67 minutes of non-value added time to the overall lead time of 152.92 minutes. During the loading section, the total set up time is extremely high which contribute with a value of 123.47 minutes to the loading process. While the changeover time, inspection time and travel time are lesser compared to the total set up time.
Other than the unplanned breakdown, the excessive long setup time in the process might be one of the major problems which lead to the lower OEE of the autoclave process. Hence, analysis is to be done in the next section as to identify the problem occurred in existing operation of autoclave curing.
Data Analysis
i. Cause and Effect Diagram
The development of cause and effect diagram is to highlight the problem occurred in the setup procedures of autoclave curing. According to Scott and James (2009), cause and effect diagram is a tool that helps identify, sort, and display possible causes of a specific problem or
quality characteristic. It graphically illustrates the interrelationships of various theories of the root cause of a problem. The diagram illustrates the main causes and sub-causes leading to an effect.
Figure 4.3 Causes and Effect Analysis
As shown in Figure 4.3, the long excessive setup is occurred due to some main causes which classified in method, man, machine and material. Lack of standardized procedures might cause the long time spending in the installation, errors might occurs and need extra time to make adjustment on the installation. Operator awareness is also one of the issues which lead to the long setup time where they might be carelessly on the installation, data entry to system or any other action which contribute to the long setup. Other than that, some of the operators who are lack of the knowledge of autoclave curing process might be slow in their action during installation as they afraid to create errors and lead to the non-conformance issues.
The capacity difference of upstream and downstream process might cause the curing section to be delayed. Upstream process which is autoclave curing spent time to wait for the curing bed from downstream which is demould department as the previous mould is finished cure before the next curing bed sent to upstream. In contrast, if the demould department prepared the curing bed and allocated it in the before cured area earlier than the curing mould finish time, the mould in the curing bed might expired due to the technical issues. This would be spend more time on schedule up the next curing bed to be cured first and inspection time on the expiry curing mould need to be done through the Material Review Board (MRB).
The condition of the machine that been used during the installation of the curing process might be the major issue that need to be concerned. Machine breakdown or leakage during the installation will cause troublesome to the overall process. Delay of operation is occurred. On the other hand, the malfunctioned of equipments that used to move the curing bed to the autoclave such as cart caddy, stacker would contribute to the long excessive setup in autoclave curing process. Hence, we have to identify the occurrence and severity of the failure modes and the risk
Autoclave Schedule
0 0 0 0 0 0 0 0
1.2 0.0 0.0 0.0 0.0 0.0 0.0 0.0
Loading Bed into AC
Internal Plug-In Vacuum Hose and Thermocouple
Check Curing Profile/ Recipe
Data Entry to System Leak Check
Make Sure No Miscellanoeus item left in autoclave
Close AC Door
Lock Ring Door
Total VA
VA [min] 1.2 4.5 1.4 2.5 9.6 0.75 3 0.3 VA 23.25
Total NVA
[min] NVA 129.67
Total Lead Time 152.92
LAY-UP
AREA LEADER
AFTER CURE AREA /DEMOULD
BEFORE CURE AREA
1 2 3 4 5 6 7 8
218 impact which would seriously contribute to the lower achievement of OEE.
i. Failure Mode Effect Analysis
According to Neago (2008), Failure Mode and Effects Analysis is a risk management and quality improvement methodology with the purpose of identifying the potential failure causes for products and processes, their quantification by the evaluation of the associated risks, the ranking of the identified problems in relation to their importance and the determination and application of corrective measures in order to address the greatest concerns. Risk Priority Number (RPN) for all different possible failures where all failures might occur are prioritized according to how serious their consequences are, how frequently they occur and how easily they can be detected.
A Process FMEA (PFMEA) is actually developed in this section. The purpose of this variant of FMEA is to
determine the potential failure modes of
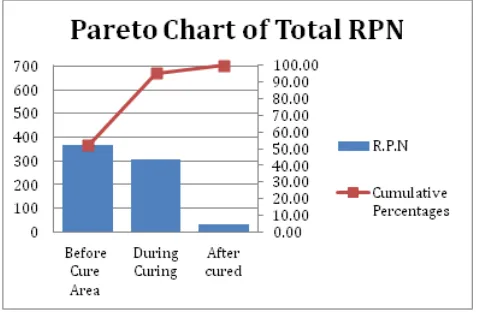
manufacturing/assembly processes at operation, subsystem or system level and to eliminate as early as possible the process deficiencies that could lead to the apparition of defective products as well as to avoid using inadequate methods as part of the processes. Besides offering solutions for the improvement of the process design, PFMEA also provides solutions for the development of future processes and process validation programs. This PFMEA is done through the categorization of three sections of the autoclave curing process which are before cure, during cure and after cured. Risk Priority Number is identified through the verification of three factors of severity, occurrence and detection for each potential failure mode. The analysis table is shown in Appendix A.A Pareto chart is shown in Figure 4.4 based on the RPN data in FMEA tabulation. From the chart below, before cure section shows highest risk in overall operation and followed by during cure and after cured.
Figure 4.4 Pareto chart of RPN
Through the analysis of FMEA, most of the problem occurred in before cure section will lead to the long excessive setup time of the autoclave curing. Most of the activities that involved are the installation and setup actions. Thus, alternative tool and technique must be done to eliminate the non-value time spending in the loading process. During cure involved the unexpected machine breakdown as shown in the FMEA analysis which will usually spend a long time for repairment. Preventive maintenance have been done every morning before the curing process start. The machine breakdown might due to
the problem that occurred in the machine itself which can’t
be fully elimintaed through any improvement action.
C.Improvement Action
According to Shingo (1985), Single Minute Exchange Dies can accomplish setup time in less than ten minutes. It is an approach where setup and changeover time can be reduced through a rapid change technique. Dirk Van Goubergen (2000) also stated that the calculation of OEE can easily show that by reducing the set-up time will provides substantial improvement in OEE. Thus, SMED seems to be an effective tool on reducing the non-value added of setup time wastages in the autoclave curing process.
D.SMED implementation steps:
Identify pilot area, observe current state process
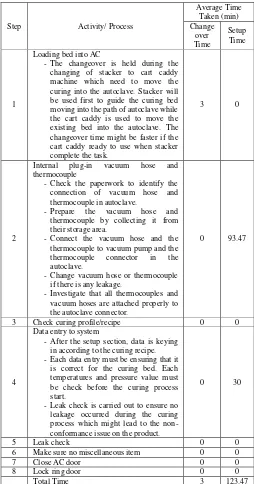
219 Table 4.0 Current Loading Process Time
The time taken on the installation of vacuum hoses and thermocouples takes 93.47 minutes within the total setup time of 123.47 minutes which nearly 76% of the overall setup time in loading process. The data entry is the process that contributes another 24% on the overall setup time which takes 30 minutes for entering the data to the system.
Separate internal and external activities
As to eliminate and reduce the setup time that incurred in the sub-processes which stated in section a, each action taken in the sub-processes are separated as internal and
external where as external if it can be performed with minimal change and be completed while equipment is running. Table 4.1 shows that few actions can be done as external activities during the autoclave curing process.
Table 4.1 Internal and External Activities
Convert internal activities to external activities
After the separation of internal and external activity, we can identify that the actions to be performed while the machine still running without creating any disturbance to the operation. The external activities can be eliminated through the conversion of external to internal activities. Solutions are proposed as below.
Internal plug-in vacuum hose and thermocouple
Firstly, the connection of the vacuum hoses and thermocouples can be verified during the previous cure mould is done. A tag number can be attached with the vacuum hose and thermocouple which already set up on the curing bed to enable the operator to recognize which connector to be plug in during the internal setup section in the autoclave. This method will save much more time consuming for the internal plug-in rather than they check one by one which connector to connect during the internal setup.
The attachment of the tag number can be done when the autoclave machine are still running for the previous curing bed. The tag is attached based on the curing recipe and can Step Activity/ Process moving into the path of autoclave while the cart caddy is used to move the thermocouple by collecting it from their storage area.
- Connect the vacuum hose and the thermocouple to vacuum pump and the thermocouple connector in the autoclave.
- Change vacuum hose or thermocouple if there is any leakage.
- Investigate that all thermocouples and vacuum hoses are attached properly to in according to the curing recipe. - Each data entry must be ensuring that it
is correct for the curing bed. Each temperatures and pressure value must be check before the curing process start.
- Leak check is carried out to ensure no leakage occurred during the curing process which might lead to the non-conformance issue on the product.
0 30
Internal plug-in vacuum hose and thermocouple Internal Activities External
Activities i.Connect the vacuum hose and the thermocouple
to vacuum pump and the thermocouple connector in the autoclave.
ii.Change vacuum hose or thermocouple if there is any leakage.
iii. Investigate that all thermocouples and vacuum hoses are attached properly to the autoclave
ii.Each data entry must be ensuring that it is correct for the curing bed. Each temperatures and pressure value must be check before the curing process start.
220 be removed from the vacuum hoses and thermocouples for next time usage once it attached to the correct connector.
On the other hand, the storage area of the vacuum hoses and thermocouples should be arranged according to the functionality of the equipment. Some equipments are not in a good condition or malfunction should be stored in other place where separated with the equipments in good functionality. It will be easier for the operator to do the setup operations. Hence, setup time can be reduced.
Streamline the remaining internal activities by simplify it
After the implementation of section c above, the time spent in the loading process might be improved through the streamline of the activities. Setup time has been reduced as the external activities are converted to become value added to the curing operation which it can perform in a very short period during the installation.
Expected Outcome
Table 4.0 shows that the current setup time for loading process is 123.47 minutes in the overall non-value added time of 367.37 minutes. This higher value of setup time has lead to the low value of OEE since the before cure process that involved most of the setup activities that analyze through the FMEA shows highest risk priority in the overall operation. The proposed alternative tool and techniques have been clarified through several researchers that it seems to be an effective tool on reducing the setup and changeover time of process through a rapid change methodology of SMED. Table 4.2 shows the expected result of autoclave curing process which consist of the improvement of value added (VA) and non-value added (NVA) time before and after the implementation of SMED. It shows that SMED contribute the improvement in eliminate the non-value added time.
Table 4.2 VA and NVA in autoclave curing
Time (minutes) Percentage of Improvemen
t (%) Before
Implementatio n
After Implementatio
n
Reductio n in time
Total
VA 585.73 555.73 30 5.12
Total
NVA 367.37 297.37 70 26.4
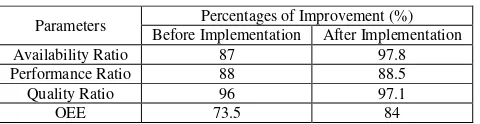
According to the research of Dirk Van Goubergen (2000), through the implementation of SMED, the percentage of OEE value will be increased significantly and hence can achieved the OEE world benchmarking. Table 4.3 shows that the OEE of 73.5 % before setup reduction can be improved to 84% after the setup reduction. Detailed of the evaluation is shown in Appendix E.
Table 4.3 SMED Improvement Result (Dirk Van Goubergen, 2000)
Parameters Percentages of Improvement (%) Before Implementation After Implementation
Availability Ratio 87 97.8
Performance Ratio 88 88.5
Quality Ratio 96 97.1
OEE 73.5 84
Hence, the result shows that the implementation of SMED methodology will contribute to the improvement on OEE. Despite, the implementing of the methodology must be sustaining through afford of the people development in the company to achieve the improvement of the OEE to world class manufacturing level. The implementation of the integrating quality tools might need the total involvement of the employees in the company.
According to Puvanasvaran et al. (2008), the problem solving capability of the employees is another important factor that derives the system successfully, including the cooperation of everyone from top to bottom. Through the three system that proposed by Puvanasvaran et al., (2008), lean process management system enables any types of organization to reduce or eliminate wasteful practices in any field while the people management system provide the direction and challengers in the development of people. This system assists the employees in the implementation of
the company’s business plan, business management
systems are the company’s practices, policies and
procedures where they plan and direct the activities of the
organization’s personals in applying company resources to
satisfy customer requirements.
In this study, the integrating quality tool on improving OEE value can be implemented through the system proposed which need to have the cooperation of all the employees. Hence, the system implementation has to be supported from everyone in the company from top to bottom which can lead the company to become world class manufacturing industry.
V.OUTCOME
Through the study on the autoclave curing process, a macro framework used on monitoring OEE and enhancing the improvement of OEE through quality tools is established. This framework is developed through the concept on benchmarking that proposed by John (2002) as in Appendix B and Appendix D.
221 Based on the process flow that proposed by John S.M. (2002), the first action need to be done here is to identify the objective that need to be achieved. In this study, the target for improvement is the OEE performance which is in a lower value in the benchmarking level. OEE approach is a core tool which used as the performance indicators in the overall study. According to Tajiri and Gotoh (1992), OEE monitors the actual performance of a machine relative to its performance capabilities under optimal manufacturing conditions. Dal et al. (2000) point out the OEE measure can provide topical information for daily decision making by utilizing largely existing performance data, such as preventive maintenance, material utilization, absenteeism, accidents, labor recovery, conformance to schedule, set-up and changeover data. Thus, OEE approach is used as indicators which to evaluate the current performance of the OEE through the validation of data collection from companies. Benchmark team is formed to develop this process.
In the analyze variance purpose, various kind of tool can be used. The modification of the framework which shown in Figure 5.0 use cause and effect diagram and FMEA to analyze the potential cause which cause the performance gap between the current OEE and the benchmark OEE. Harsha et al., (2009) proposed the cause and effect diagram to be the tool on analyzing the causes that lead to lower OEE. Linda (2001) stated that cause and effect diagrams are not only useful in the analysis of actual problems. They can be used to analyze potential problems and their potential causes. Besides, purpose of FMEA is to
determine the potential failure modes of
manufacturing/assembly processes at operation, subsystem or system level and to eliminate as early as possible the process deficiencies that could lead to the apparition of defective products as well as to avoid using inadequate methods as part of the processes. Offering solutions for the improvement of the process design through PFMEA also provides solutions for the development of future processes and process validation programs.
After the analytical stage, a Pareto chart is developed to illustrate the result of PFMEA. According to John (2002), Pareto chart can be used to identify the distribution of the main cause contributes in lower OEE result which shown in Appendix B. After the identification of the problem incurred in the autoclave curing, improvement can be done based on the root cause.
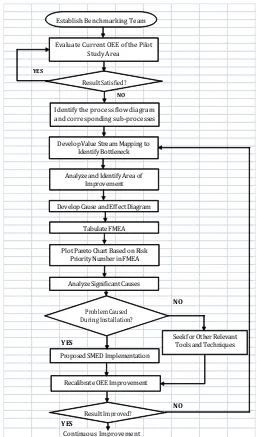
Figure 5.0 Framework of developing integrating quality tool on improving OEE
Figure 5.0 shows that the proposal of SMED implementation can only be done if the problem analysis in the previous stage proved that the root cause is from the installation of the autoclave curing process. If not, other lean tools and techniques could be implemented to reduce the non-value added activities. Next, either SMED or other tools been used on the improvement, OEE reevaluation should be done to monitor or recalibrate to identify the percentage to improvement. If result shows that the OEE value has been increased, monitoring on the OEE must be done since it is the continuous improvement cycle to maintain the benchmark level that has been achieved. If the percentage of improvement is not satisfied, the cycle is started again to identify the bottleneck of the pilot study area.
YES
NO
NO
YES
NO
YES
Continuous Improvement Establish Benchmarking Team
Identify the process flow diagram and corresponding sub-processes
Develop Value Stream Mapping to Identify Bottleneck
Analyze and Identify Area of Improvement
Develop Cause and Effect Diagram
Plot Pareto Chart Based on Risk Priority Number in FMEA
Analyze Significant Causes Evaluate Current OEE of the Pilot
Study Area
ResultSatisfied?
Tabulate FMEA
Problem Caused During Installation?
Proposed SMED Implementation
Seek for Other Relevant Tools and Techniques
Recalibrate OEE Improvement
222
VI. SUMMARY
In conclusion, the purpose of the study is achieved through the implementation of several quality tools where each tool is interacting with each other which aim to reducing the non-value added in the operation and enhancing the perfect utilization and efficiency of the machine use.
OEE approach as the core tool in this study while it support by several quality tools such as value stream mapping which is first used to be visualize the flow of the curing process, cause and effect diagram, FMEA and the Pareto chart used to identify the area of improvement. Through the implementation, optimization of the effectiveness and efficiency of autoclave curing is achieved. The losses accumulated in the operation are identified, solution has been proposed to the elimination of the losses which quantify in the analytical stage of this study.
Lastly, the framework is developed after the study. This framework will be useful in every OEE machinery field as to level up their organization to the world benchmarking in the OEE value of 85% and above. The flow of the framework might be standard operating procedures of improving the current condition of the production flow in every machining centre not only in the autoclave curing section.
REFERENCES
[1] Bamber, C.J., Castka, P., Sharp, J.M. and Motara, Y., 2003. Cross-functional Team Working for Overall Equipment Effectiveness (OEE). Journal of Quality in Maintenance Engineering, Vol. 9 No. 3, pp. 223-38.
[2] Britsman, C. et al. (1993). Handbook FMEA, Forfattarna och Forlags AB Industrilitteratur, Uppsala, Sweden.
[3] Dal, B., Tugwell, P. and Greatbanks, R., 2000. Overall Equipment Effectiveness As A Measure of Operational Improvement: A Practical Analysis. International Journal of Operations & Production Management, Vol. 20 No. 12, pp. 1488-502.
[4] Daniel, H., 2005. Plant Efficiency: A Value Stream Mapping and Overall Equipment Effectiveness Study. Department of Applied Physics and Mechanical Engineering.
[5] Dirk, V.G., 2000. Set-up Reduction As An Organization-Wide Problem. Institute of Industrial Engineers. Cleveland, Ohio (USA). [6] Ericsson, J., 1997. Disruption Analysis – An Important Tool in Lean
Production, Department of Production and Materials Engineering, Lund University, Lund.
[7] Harsha G. Hedge, N.S. Mahes and Kishan Doss, 2009. Overall Equipment Effectiveness Improvement by TPM and 5S Techniques in a CNC Machine Shop. Volume 8, Issue 2.
[8] Honda, (2000). Overall Equipment Effectiveness, Revision 10. Capacity Management System Applivation. Huang, S., Dismukes,
J., Shi, J. and Su, Q. (2003), “εanufacturing productivity improvement using effectiveness metrics and simulation analysis”,
International Journal of Production Research, Vol. 41 No. 3, pp.513-27.
[9] Huang, S.H., Dismukes, J.P., Shi, J. and Su, Q.I. (2003),
“εanufacturing productivity improvement using effectiveness metrics and simulation analysis”, International Journal of
Production Research, Vol. 41 No. 3, pp. 513-27.
[10] Jeong, K.Y. and Phillips, D.T., 2001. Operational Efficiency and Effectiveness Measurement. International Journal of Operations & Production Management, Vol. 21 No. 11, pp. 1404-16.
[11] John S. M., (2002). Metrics/Measures of Performance. Physical Asset Management Handbook, Third Edition.
[12] Linda, W. (2001). Cause & Effect Diagrams. The Six Sigma Handbook, McGraw-Hill, New York, Quality Publishing Tucson. [13] Mario V., 1992. Failure Modes and Effects Analysis, Reliability,
Functional, Risk Priority Number. International SEMATECH, Inc. [14] Nakajima, S. ,1988. Introduction to TPM, Productivity Press.
Cambridge, MA.
[15] Neageo B.S, Martinescu I., 2008. The Specifics of The Application of The Failure Mode and Effects Analysis (FMEA) in The Automotive Industry. Quality Management Department, University Transilvania of Brasov.
[16] Puvanasvaran, A.P.,Megat, M.H.M.A, Tang, S.H., Muhamad, M.R and Hamouda, A.M.S., 2008.A Review of Problem Solving Capabilities in Lean Process Manangement. American Journal of Applied Sciences 5 (5): 504-511.
[17] Rother, M. and Shook, J. (2003). Learning to see (Value Stream Mapping to create value and eliminate Muda), the Lean Enterprise Institute, Brookline, USA.
[18] Scott L. and James E.R., 2009. Performance Excellence in The Wood Products Industry: Statistical Process Control. Oregon State University.
[19] Shingo, S. (1985), A Revolution in Manufacturing: The SMED System, Productivity Press, Cambridge, MA.
[20] Silvester, K., Lendon, R., Bevan, H., Steyn, R. and Walley, P., 2004. Reducing Waiting Times in The NHS: Is Lack of Capacity The Problem?. Clinician in Management, Vol.12 No.3, pp.105-111 [21] Tajiri, M. and Gotoh, F., (1992). TPM Implementation: A Japanese