Estimating Quality-Affecting Risks in Software Projects
Abdelrafe Ezamly and Burairah Hussin
University Technology Malaysia Melaka (UTeM), Malaysia[Abstract] Regardless how much effort we make for the success of software projects, many software projects have very high failure rates and risks during their life. In addition to technical risks, the projects normally suffer from risks caused by management practices and conflicts of interests. Risk is not always avoidable, but it is controllable. The aim of this paper is to improve quality of software projects of the participating companies while estimating the quality–affecting risks in IT software projects. The results showed that there were 40 common risks in software projects of IT companies in Palestine. The amount of technical and non-technical difficulties was very large. Our data showed, once again, that most of the risks were very important. The study has been conducted on a group of managers to improve the probability of project success.
[Keywords] software project management; risk management; quality software; risk factors
Introduction
Despite much research and progress in the area of software project management, software development projects still fail to deliver acceptable systems on time and within budget. Much of the failure could be avoided by managers pro-actively planning for and dealing with risk factors, rather than waiting for problems to occur and then trying to react. Project management and risk management have been proposed as solutions to preserving the quality and integrity of a project by reducing cost escalation. Risk is an uncertainty that can have a negative or positive effect on meeting project objectives. Risk management is the process of identifying, analyzing, and controlling risk throughout the life of a project to meet the project objectives (Schawlbe, 2005).
In the process of understanding the factors that contribute to software project success, risk is becoming increasingly important. This is a result of the size, complexity, and strategic importance of many of the information systems currently being developed.
The importance of software quality has been increasing for the last decade. In order to measure software quality, many metrics and methodologies have been proposed. Among them, the number of residual problems is frequently used, since it is easily understandable and deeply concerned with the needs in the software development organization. Also, development of a system or a software product should be supported by an appropriate quality plan to implement quality in processes for the development of systems and software (Kenett & Baker, 2010).
However, improving the overall development process is more desirable for achieving high software quality. For instance, constructing rigid specifications, introducing review activities, and determining feasible development plans (Mizuno, et al., 2002). Quality engineering is to ensure software quality through related validation and verification activities. These activities need to be carried out by the people and organizations responsible for developing and supporting software systems in an overall quality engineering process (Sun, 2010).
A software project’s success can suffer due to the poor quality of its deployed software products and today, quality is still commonly managed on an ad hoc basis; research into software engineering projects indicates that software can use quantitative approaches to manage quality by using techniques and estimates to decide whether to release or to conduct additional tests (Li, et al., 2007). Despite many software projects’ failures, there is importance in software process and software usage; quality-related issues have been relatively little treated in research and literature. We analyzed SDLC, popular software development methodologies, and showed risks in all phases.
software projects in the analyzed software companies. In this paper, we identified key project risk factors, such as software size, technology, budget, and design that determine software project outcomes for IT projects. We defined risk factors to mean any activity that is intended to help managers understand or reduce risk in software projects.
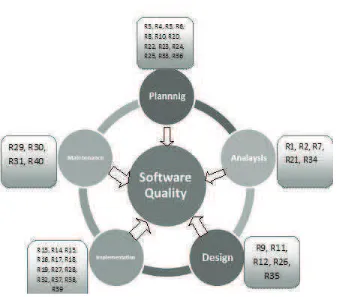
Software Development Life Cycle, according to (Hoffer, et al., 2008), is the process of creating or altering systems and the models and methodologies that people use to develop these systems. Traditional software development methodologies basically include the phases of SDLC: planning, analysis, design, implementation, and maintenance. In this paper, we depend on these phases to estimate quality in software project management.
The objectives of this study are to: 1) Improve quality of software project of the participating companies during estimating of quality–affecting risks produced using IT software projects. 2) Identify the risks involved in software projects in Palestinian companies; rank the risks according to their importance and occurrence frequency. The organization of this paper as will be as follows. Section 2 presents an overview of the literature. Section 3 presents the empirical work. Section 4 will provide analysis and results. Section 5 concludes the article and recommendations for future work.
Literature Review
Freimut, et al (2001) proposed an industrial case study of implementing software risk management; the results showed that the risk method is practical, added value to the project, and that its key concepts are understood and usable in practice. Padayachee (2002) proposed a framework for a field investigation of risk management in the context of a particular software development organization. It was experimentally tested within several companies. This framework was designed to provide an understanding of software development risk phenomena from a project manager's perspective and gave an indication of how this perspective affects their perception. According to the author, this study can be used as a precursor to improving research into the creation of new software risk management frameworks.
Flinn and Stoyles (2004) described a risk management approach for building confidence and trust for Internet users. This approach helps users to build an awareness of the risks they might encounter and supply them with timely guidance. Alshathry and Anicke (2010) proposed a regression-based model that allows project managers to estimate the trade-off between the quality cost and development time of a software product based on previously collected data.
Guoheng, et al., (2010) proposed an Analytic Hierarchical Process (AHP) approach to estimate the relative importance of each functional variable feature on a quality attribute. Based on the relative importance value of each functional variable feature on a quality attribute, the level of quality attributes of a product configuration in software product lines can be assessed. An illustrative example based on the Computer Aided Dispatch (CAD) software product line is presented to demonstrate how the proposed approach works.
Hribar, et al (2009) focused on software quality ranks (SQR) an important method to manage and improve software quality. Component software quality has a major influence in a development project’s lead time and cost. SQR enables better management and visibility of the quality effort associated with the component implementation. It also provides a roadmap for continuous improvement leading to value added quality attributes like low maintenance, self-optimizing software, and short development lifecycles. The SQR method focuses attention on prioritizing the quality investment in design component levels through different quality assurance mechanisms (basic test, code review, desk checks, documentation, and other actions). The resulting design delivery to verification phase will be more predictable quality software with shorter lead-times and times-to-market (TTM).
statistically compared quality models that have previously been published in empirical studies by applying them to the same set of software systems, i.e., to altogether 328 versions of 11 open-source software systems. Finally, they draw conclusions from quality assessment using the different quality models, i.e., they calculated a quality trend and compared these conclusions statistically.
Zheng, et al. (2009) proposed an estimating method for software effort based on function points. It helps to estimated software effort more accurately without considering the languages or the developing environment you choose. First, they used actual project records to obtain the linear relations between function points and software efforts. Then, they determined the parameters of linear equations by the maximum likelihood of the estimating method. Finally, you can get the effort of the project according to this equation with the function point given. After obtaining the software effort, a project manager can arrange the project’s progress, control the cost, and ensure the quality more accurately.
Redzic, et al. (2006) presented the Six Sigma DMAIC approach, which is used for software quality improvement. The goal was to identify and establish tactical changes that substantially increased the software quality of all software products over the next two years. They analyzed the data and, based on the analysis, expert decisions were made to determine which new technologies (tools, methods, standards, training) should be implemented and institutionalized in order to reach our goals. To measure the improvement from the Six Sigma process changes, they calculated our process capability baselines based on tactical changes, and they tracked and evaluated ongoing software product quality on a regular basis against these baselines to ensure that the software product quality goals were being achieved as planned.
Khanfar, et al. (2008) proposed that for the success of software projects, many software projects have very high failure rate and presented a new technique by which they can study the impact of different control factors and different risk factors on software projects risk. The new technique uses the chi-square test to control the risks in a software project. Fourteen risk factors and eighteen control factors were used. The study has been conducted on a group of managers. Successful project risk management will greatly improve the probability of project success.
Ayerbe, et al. (1998) presented the work that is being carried out under this project It is expected that at the end of QUALIMET, the incorporation of these quality assurance techniques into the current methodology for developing software, will allow to have a complete methodology that guarantees software product quality, minimizing the complexity of the code earlier in the programming process, yielding more maintainable and less error-prone software and improving the quality of the software and the satisfaction of customers.
Khoshgoftaar, et al. (1992) introduced two new estimation procedures and compared their performance in the modeling of software quality from software complexity in terms of the predictive quality and the quality of fit with the more traditional least squares and least absolute value estimation techniques. The two new estimation techniques produced regression models with better quality of fit and predictive quality when applying them to data obtained from two actual software development projects.
Software Project Risks
before the actual implementation can be done: R13: Test case design turns out to be very difficult; R14: Unit-level testing is too often neglected; R15: The drivers required for running and testing the components and subsystems have not been created; R16: Test cases and test data may be completely unrealistic; R17: Automation is difficult; R18: The test plans for integration are missing; R19: The test plan for the system is missing; R20: There may not be actual criteria for accepting the system; R21: Test cases are based on requirements, and the understanding of requirements may be quite different; R22: Schedules are set before the project is defined; R23: Excessive schedule pressure; R24: Major requirements change after the requirements phase; R25: Inadequate project planning, tracking, measurement, and estimating methods; R26: Inadequate pretest defect removal methods; R27: Inadequate office space and poor environment; R28: Inadequate training for management and staff; R29: Inadequate support for reusable designs and code; R30: Inadequate organizations and use of specialists; R31: Lack of domain knowledge; R32: Lack of technology knowledge; R33: Unrealistic schedules; R34: Badly engineered software; R35: Poor acquisition practices; R36: Requirements Missing or incomplete; R37: Configuration management missing or incomplete; R38: User documentation missing or incomplete; R39: Installation and training missing or incomplete; R40: Purchased package acquisition missing or incomplete.
Empirical Strategy
A sample was chosen to examine the software projects at companies in Palestine. We have developed, validated, and tested a model for estimating quality-affecting risks in software projects. A structured questionnaire is used for data collection that asked respondents questions aimed to help us in developing the model. Forty factors were presented to respondents. In this questionnaire, the method of sample selection referred to as a “snowball” sampling will be used. This involved e-mailing survey questionnaires to managers in the field of information technology who have experience in this area. This generated several more responses, as these referrals were used to gain further referrals and, hence, the term snowball. This procedure is appropriate when members of a homogeneous group (such as managers) are difficult to locate. The sample was designed to contain 40 individuals working for many software companies in Palestine, and the design questionnaire was used for collecting data. The questionnaire was sent to the target managers by e-mail.
Statistical Method
The analysis of the questionnaires responses was conducted using mean, standard deviation, percent, and one way ANOVA.
Analysis and Results
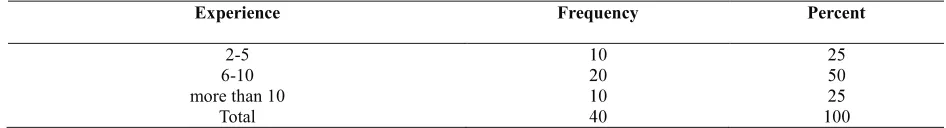
Distribution SampleOf the 45 distributed questionnaires, 40 were returned with responses. All 40 questionnaires were complete and were, thus, used in the analysis of the data, which was done using order methods, frequency scales, and percent. The results of the analysis are shown in Table 1.
Table 1. Distribution Sample According To Experience of Manager
Experience Frequency Percent
2-5 10 25
6-10 20 50
more than 10 10 25
Total 40 100
Importance of Risk Factors
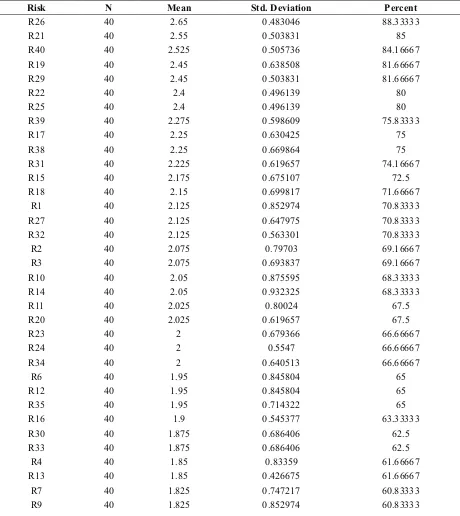
The mean of all risks and is shown in Table 2. All respondents indicated that the risk of “Inadequate pretest defect removal methods.” was the highest risk factor and very important. In fact, the risk factors from risk numbers 26, 21, 40, 19, 29, 22, 25, 39, 17, 38, 31, 15, 18, 1, 27, 32, 2, 3, 10, 14, 11, 20, 23, 24, and 34 were identified as very important; the risk factors from risk numbers 6, 12, 35, 16, 30, 33, 4, 13, 7, 9, 36, 37, 8, 28, 5 in descending means, were identified as important: aggregating the responses resulted in the following ranking of the importance of the listed risks (in order of importance): R26, R21, R40, R19, R29, R22, R25, R39, R17, R38, R31, R15, R18, R1, R27, R32, R2, R3, R19, R14, R11, R20, R23, R24, R6, R12, R35, R16, R30, R33, R4, R13, R7, R9, R36, R37, R8, R28 and R5.
Table 2. Mean Score for Each Problem Factor
Percent
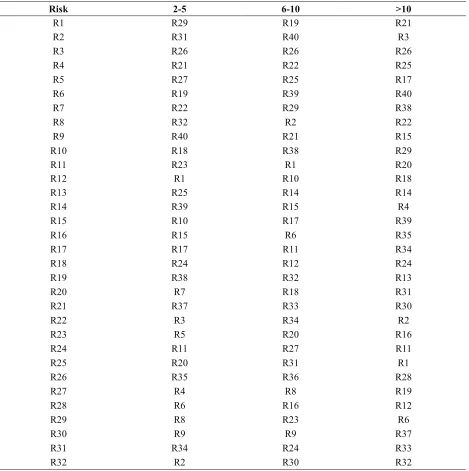
As we see, the results in Table 2 show that most of the risks are very important and the overall ranking of importance of each risk factor for the three categories of project managers' experience is shown in Table 3. As we see, the results in Table 3 reveal that most of risks are very important and important.
Table 3. The Overall Problem Ranking of Each Problem Factor
>10 6-10
2-5 Risk
R27 R35
R12 R33
R23 R3
R13 R34
R10 R7
R14 R35
R9 R13
R16 R36
R36 R4
R30 R37
R7 R37
R33 R38
R5 R28
R36 R39
R8 R5
R28 R40
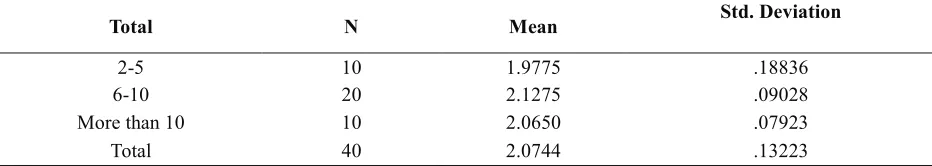
Measure Significant Differences
Are there any significant differences in the quality risks due to experience of manager?
Table 4. Means and Standard Deviations for the Quality Problems According to the Experience of Manager.
Total N Mean Std. Deviation
2-5 10 1.9775 .18836
6-10 20 2.1275 .09028
More than 10 10 2.0650 .07923
Total 40 2.0744 .13223
Table 5. One Way ANOVA
Total Sum of Squares df Mean Square F Sig.
Between Groups .151 2 .076
5.27
.010
Within Groups .531 37 .014
Total .682 39
Table 6. Tukey Test to Measure Multiple Comparisons
Experience (I) Experience (J) Mean Difference (I-J) Sig.
6-10 2-5 .1500 .007
Research Model
Our model helps us to understand which phase from SDLC has big risks on the quality software through the 40 risks shown in Figure 2. Important phases are the planning and implementation phases.
Figure 1. Research Model
Conclusion
The concern of this study is estimating quality affecting –risks in software projects. The results showed that there were 40 common risks in software projects of IT companies. The amount of technical and non-technical difficulties was very large. The highest risk factors and very important was "Inadequate pretest defect removal methods." In fact, the risk factors from risk number 26, 21, 40, 19, 29, 22, 25, 39, 17, 38, 31, 15, 18, 1, 27, 32, 2, 3, 19, 14, 11, 20, 23, 24, and 34 were identified as very important, the risk factors from risk number 6, 12, 35, 16, 30, 33, 4, 13, 7, 9, 36, 37, 8, 28, 5 in descending means were identified as important. Our data showed, once again, that most of the risks were very important and important. The overall ranking of importance of each risk factor for the three categories of project managers' experience is (2-5, 6-10, and more than 10).
Based on these results, the companies must improve the quality of software through improving all factors or other techniques as considering quality software, being careful with test cases, test plan, schedules set, support for reusable designs and code, and package acquisition. Finally, there are significant differences in the quality problems due to the experience of managers between 6-10 experience and 2-5 experience of manager. In the future, the researchers should be concerned with new techniques to improve quality software.
References
a measurement process. COMPSAC ‘98 Proceedings of the 22nd Annual International Computer Software and Applications Conference. 172.
Bukhari, S., & Arif, F. (2010). Analyzing effects of multi agent's technology towards software quality assurance and quality engineering. International Conference on Information and Emerging Technologies (ICIET), 1, 1-8.
Changjun, H., Feng, J., & Chongchong, Z. (2008). An architectural quality assessment for domain-specific software. International Conference on Computer Science and Software Engineering, 2, 143. Freimut, B., Hartkopf, S., Kaiser, P., Kontio, J., & Kobitzsch, W. (2001). An Industrial Case Study of
Implementing Software Risk Management. Communications of the ACM, 277-286. Flinn, S., & Stoyles, S. (2004). Human factors: Omnivore: Risk management through bidirectional
transparency. Proceedings of the 2004 workshop on new security paradigms, 97-104. Guoheng, Z., Huilin, Y., & Yuqing, L. (2010). Quality attributes assessment for feature-based product
configuration in software product line, 17th Asia Pacific Software Engineering Conference (APSEC), International Conference on Quality Software (QSIC), 1, 137.
Hoffer, J., George, J., & Valacich J. (2008). Modern systems analysis and design, 5th Edition. Prentice Hall. Hribar, L., Burilovic, A., & Huljenic, D. (2009). Implementation of the software quality ranks method in the legacy product development environment. 10th International Conference on Telecommunications, ConTEL2009, 141-145.
Kenett, R., & Baker, E. (2010). Process improvement and CMMI for systems and software. Taylor and Francis Group, LLC, 36.
Khanfar, K., Elzamly, A., Al-Ahmad, W., El-Qawasmeh, E. Alsamara,K., & Abuleil, S. (2008). Managing software project risks with Chi-Square technique. International Management Review, 4(2), 18-29. Khoshgoftaar, T., Munson, J., Bhattacharya, J., & Richardson,G. (1992). Predictive modeling techniques of
software quality from software measures. IEEE Transactions on Software Engineering - Special issue on software measurement principles, techniques, and environments, 18, 82.
Lincke, R., Gutzmann, T., & Lowe, W. (2010). Software quality prediction models compared. 10th International Conference on Quality Software (QSIC), 82-91.
Mizuno, O., Shigematsu, E., Takagi, Y., Kikuno, T. (2002). On estimating testing effort needed to assure field quality in software development. 13th International Symposium on Software Reliability Engineering (ISSRE), 139.
Padayachee, k. (2002). An interpretive study of software risk management perspectives. SAICSIT '02. Proceedings of the 2002 annual research conference of the South African institute of computer scientists and information technologists on enablement through technology, 118-127.
Pressman, R. S. (2009). Software engineering: A practitioner’s approach, 7th edition. McGraw-Hill Series. Redzic, C., & Jongmoon, B. (2006). Six Sigma Approach in software quality improvement. Fourth
International Conference on Software Engineering Research, Management and Applications, 396. Runeson, P., & Isacsson, P. (1998). Software quality assurance-concepts and misconceptions. 24th Euromicro
Conference, 853-859.
Schawlbe, K. (2005). Information technology project management Fourth Edition, Course Technology: Thomson.
Sun, C. (2010). Software documents quality measurement – A fuzzy approach. IEEE International Conference on Information Theory and Information Security (ICITIS),88.
Tian, J., & Jongmoon, B. (2005). Software quality engineering testing, quality assurance, and quantifiable improvement, IEEE Computer Society, Hoboken, NJ: John Wiley & Sons, Inc., 30.
IS/IT capability and Strategic Information System Planning (SISP) Success
Naser Khani, Khalil Md Nor and Mojgan Bahrami
Faculty of Management and Human Resource DevelopmentUniversiti Technologi, Johor, Malaysia
[Abstract] Strategic planning of information systems is, perhaps, going to be more problematic in today’s world of rapid change and uncertainty. SISP is a cornerstone of the information system discipline, and very little attention has been paid to its success based on the resource-based view of the firm (RBV). This paper provides a model for IT capability and strategic information system planning success by considering environmental and organizational factors that may influence this relationship in a contingency model. A review of existing IT capability and SISP literature is given to identify the opportunities in building successful SISP. A model is developed by hypothesizing the IT capability, as independent variables lead to SISP success as a dependent variable in which organizational and environmental influences are considered as moderating variables. The control variables are firm size, firm structure, and industry type. The study proposes a model to conceptualize the relationship between IT capabilities and SISP success and contingency factors moderating that relationship. This paper explains the ways of exploiting IT capabilities as specialized and integrated knowledge of the firm in IT area to create a more successful SISP. The researchers believe that the aim to build a model for SISP success based on RBV theory is important because this new perspective will be helpful for gaining a superior assessment and better underpinning of the SISP from a knowledge-based perspective.
[Keywords] firm-wide IS capability; strategic information systems planning
Introduction
As a new strategic perspective in the IS management field, RBV proposes that it is possible to exploit human, technical, and business dimensions of information systems (IS capabilities). Through a capability perspective, this study will look for SISP success. Many studies have been done on SISP or IS capabilities, but the relationship between IS capabilities and SISP success and moderating factors affecting this relationship have not been investigated yet. IS success has been an attractive research subject for many scholars and researchers. As IS and technology grow and the environment becomes more competitive and strategies of the business change, SISP can help firms to encounter this complexity, analyze the environment, track IT development, monitor how competitors use IT, plan more effective infrastructure, and, finally, impact business objectives. In addition, strategic information system planning (as of now: SISP) has been interpreted as an important management issue. Some believe that SISP is the best framework for assuring that IS efforts are concordant with other organization’s activities and arising needs (Sabherwal & Chau, 2001). According to Bechor, et al. (2010), SISP “is the process of strategic thinking that identifies the most desirable IS on which the firm can implement and enforce its long-term IS activities and policies” (p: 1). Prior research on SISP success involves topics such as the effect of senior management approval (Kearns, 2006), SISP critical success factors (Basu, et al, 2002; Bechor, et al., 2010), and various other aspects.
IS Capability
IS and Sustainable Competitive Advantage
opportunities through IT and IT-business strategy alignment, scant attention has been paid to the organizational mechanisms through which firms achieve sustained and repeated value from IT (Peppard & Ward, 2004). Therefore, the challenge of understanding how to develop this sustainability is becoming more important.
Some researchers (Mata, et al., 1995; Keen, 1993; Kettinger, et al., 1994; Ciborra, 1994; Dvorak, et al., 1997; Marchand, et al., 2000; Bharadwaj, 2000) have hinted to the IT and sustainable competitive advantage (CA). In summary, their studies show that when all firms have access to a similar technology, it is the management differences that determine CA. Accordingly, acquiring sustained IT-based CA requires organizational infrastructure to provide innovative action strategies and needs IT management skills to contribute to utilizing intangibles, business, and human resources. In essence, these are management differences that determine economic superiority that firms gain from their IS/IT investments. For example, some managers can fit the parts together more elaborately than others, so management of IS/IT skills could be a source of sustainable competitive advantage. In this regard, researchers (Bharadwaj, 2000; Bharadwaj, et al., 1999; Ross, et al., 1996) have shown that in order to use IT to improve organization’s ongoing competitiveness, “IS capability” has to be developed. Rooted in strategic management and RBV perspective, IS capability is the organization’s ability of IS/IT usage to continuously leverage and exploit business value (Peppard & Ward, 2004).
IS Capability Evolution
The RBV perspective has gained increasing dominance in the strategic management field and views organization as a bundle of resources. According to Barney, the organizational resources are the main elements that differentiate an organization from others in the industry and make the firm matchless. Barney (1991) has defined resources as information, knowledge, firm attributes, organizational processes, assets, and capabilities that empower the firm to formulate and implement effective and efficient strategies.
In the RBV perspective, IS capabilities are intrinsic part of the strategy instead of being strategy outcomes. Using the RBV perspective in strategic management thinking, the focus on the demand side has changed with emphasis on the supply side that is associated with organizational capabilities.
IT resources are software, hardware, communication, IT personnel, and IT applications that are hardly inimitable and unique and, consequently, cannot be a source of competitive advantage (Teo & Ranganathan, 2003). Instead, Mata, et al. (1995) have introduced IT attributes (i.e. managerial IT skills, technical IT skills, proprietary technology, access to capital, and customer switching costs) and have argued that only managerial IT skills can provide distinct advantage. Then, Bharadwaj (Bharadwaj, 2000) showed that although IT resources have no innate value, a combination of IT resources and human and business resources, as complementary resources, can guarantee higher firm performance. Similar to Teo and Ranganathan (2003), Peppard and Ward (2004) introduced IS resources as business resources, technical (IT resources) and behavior and attitude (human part of IS resources) in their model (Figure 1).
Figure 1. IS Capability and its Components (IS Competencies) - Adapted from Peppard and Ward (2004)
In the IS capability perspective, the fundamental promise is that they are utilizing and combining mechanisms that produce the firm’s strategic benefits; such mechanisms as managerial IT skills are firm-specific and hard to imitate (Teo & Ranganathan, 2003). Peppard and Ward (2004) suggested that these are a firm’s process, roles, and structure that produce and shape those mechanisms. Accordingly, they proposed that IS capability has three attributes: business and IT knowledge fusion, flexible IT infrastructure, and effective utilization process.
The Position of IT Capability Among Other Organizational Capabilities: A Knowledge Perspective The organizational capability theory is based upon the integration of specialized knowledge of organizations’ members, in which efficiency of the knowledge acquisition needs individuals’ specialization in a specific knowledge, and knowledge application requires accumulation of several areas of expertise knowledge (Grant, 1996). Knowledge application to production – that is, value creation through input into output transformation – requires many specialized knowledge areas to be brought together (Demstez, 1991) to shape organizational capability.
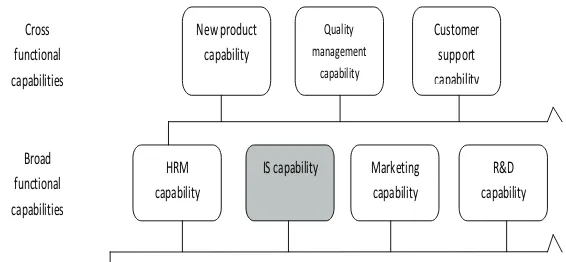
From an organizational perspective, organizational capabilities have been described as a hierarchy by Grant (1996), where functional capabilities are the result of specialized capabilities’ combination. Likewise, functional capabilities’ integration forms a higher level of capabilities that are cross-functional capabilities (see Figure 2). For example, new product development capability as a cross-functional capability derives from operations, R&D and design, and marketing and sales capabilities.
Figure 2. The Hierarchy of Capabilities and the Position of IS Capability /^ĐĂƉĂďŝůŝƚLJ
/^ĐŽŵƉĞƚĞŶĐLJ
ƵƐŝŶĞƐƐƌĞƐŽƵƌĐĞƐ
^ƚƌĂƚĞŐLJ
WƌŽĐĞƐƐ͕ƐƚƌƵĐƚƵƌĞ͕ĂŶĚƌŽůĞƐ
,ƵŵĂŶƌĞƐŽƵƌĐĞƐ dĞĐŚŶŽůŽŐLJƌĞƐŽƵƌĐĞƐ
EĞǁƉƌŽĚƵĐƚ ĐĂƉĂďŝůŝƚLJ
/^ĐĂƉĂďŝůŝƚLJ YƵĂůŝƚLJ ŵĂŶĂŐĞŵĞŶƚ
ĐĂƉĂďŝůŝƚLJ
ƵƐƚŽŵĞƌ ƐƵƉƉŽƌƚ ĐĂƉĂďŝůŝƚLJ
DĂƌŬĞƚŝŶŐ ĐĂƉĂďŝůŝƚLJ
ZΘ ĐĂƉĂďŝůŝƚLJ ƌŽƐƐ
ĨƵŶĐƚŝŽŶĂů ĐĂƉĂďŝůŝƚŝĞƐ
ƌŽĂĚ ĨƵŶĐƚŝŽŶĂů ĐĂƉĂďŝůŝƚŝĞƐ
By considering knowledge as a single resource, Grant (1996) has defined organizational capability as the ability of a firm to carry out a productive task repeatedly that influence a firm’s aptness for value creation through input-process-output concept. The fundamental notion in this definition is knowledge. Specialists’ knowledge integration to do a distinctive productive task is the essence of organization capabilities. For example, a popular fast food chain’s capability in serving special foods is an organization capability that requires specialized knowledge integration among too many employees (Yongmei, et al., 2008).
Based on the role of organizations in acquisition, processing, and implementing knowledge, individuals’ expert knowledge is the essence of organizational capability (Grant, 1996) that shapes other levels of organizational capabilities. Here, tacit knowledge, in the form of practical knowledge, know-how, and skills is related to production task.
IS Capability as the Fourth IS Era
King (1995) discussed that strategic capability architecture (SCA) is the fundamental basis for sustainable competitive advantage of a company. In his discussion, SCA is a basic plan of organizational capability that is continuously improving and flexible. Consequently, by the application of RBV in IS management, the notion of IS capabilities emerges that considers developing and leveraging business value through IS. As Peppard and Ward have proposed, this can be assumed as the fourth era in IS management field.
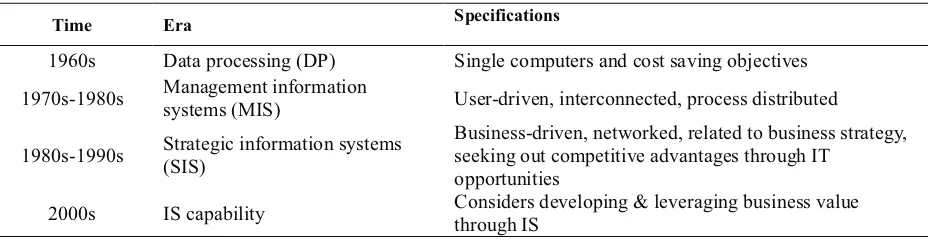
The IS management era has been faced with several changes from 1960 to 2002. According to the model that Ward and Griffith (1996) have developed, there were three different, albeit overlapping, IS management eras. Table 1 depicts a model of four eras of IS evolution.
Table 1. The Four IS Eras
Time Era Specifications
1960s Data processing (DP) Single computers and cost saving objectives 1970s-1980s Management information
systems (MIS) User-driven, interconnected, process distributed 1980s-1990s Strategic information systems
(SIS)
Business-driven, networked, related to business strategy, seeking out competitive advantages through IT
opportunities
2000s IS capability Considers developing & leveraging business value through IS
Adapted from Ward and Peppard, (2002) and Ward and Grifith (1996)
According to archival analyses of strategic information systems research, three distinct categories of research have been identified (Gable, 2010): (1) IS for strategic decision making, (2) strategic use of IS, and (3) strategies for IS issues (i.e. IS management, IS planning, IS organization, IS development method, application service provision, IS implementation, IS evaluation, and IS adoption). In the third main topic, strategic IS planning has received the most researchers’ attention after the IS management subtitle and, accordingly, is the focus in this paper.
SISP Success
SISP Evolution Perspective
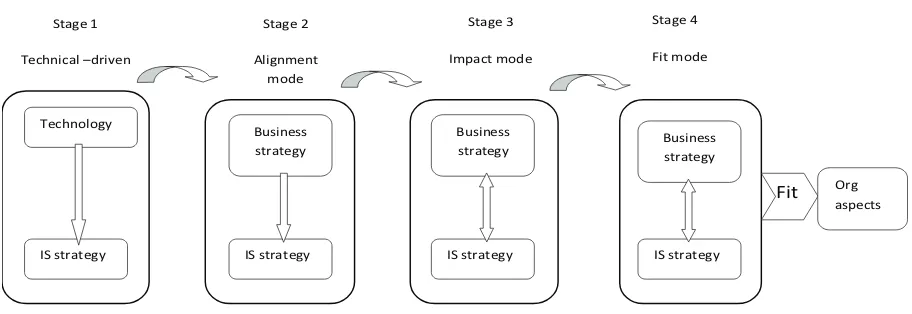
The SISP notion has experienced an evolution (Lederer & Sethi, 1998). Rapid business and IT change have been recognized as the main drivers for SISP (Newkirk, et al., 2008). Those changes within recognition of IT as a strategic resource have caused an SISP evolution. Figure 3 depicts the SISP evolution in four stages; each is the result of IT changing nature and its position as a strategic resource for the firms.
Figure 3. The Evolution Perspective of SISP
SISP Success
SISP requires significant financial and human resources and a considerable budget and managerial effort (Segar and Grover, 1998). This is a crucial issue for IS and business managers and, furthermore, it is often unsuccessful and hard to complete (Lederer & Salmela, 1996). These issues have made it a legitimate goal for research, but such research cannot simply be established on financial measures like return on investment (ROI) or other financial ratios because, like any other strategic planning, it contains several intangible outcomes. Among these four perspectives, goal-centered and improvement perspectives are more appropriate because SISP has an ongoing nature and a broad focus and involves different outcomes (Segar and Grover, 1998). To fill this requirement, a goal-centered approach represents planning outcomes as “ends” and improvement approach represents process adaptability as “means” of effectiveness assessments.
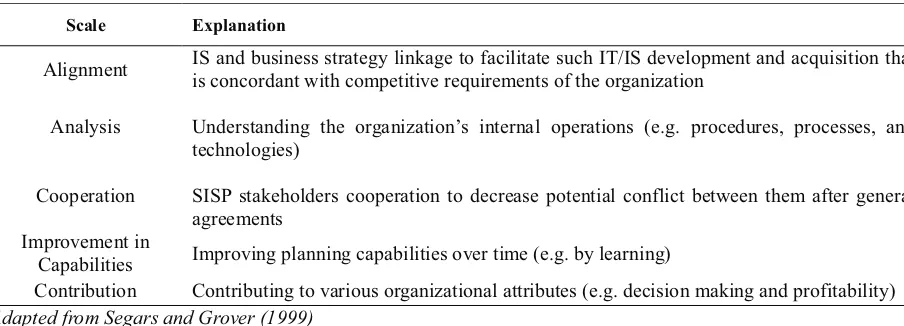
SISP Success Dimensions
Based on this fact that the effectiveness aspects in the IS management field are complex (Delone and McLean, 1992), a collection of interdependent success dimensions can assess success more properly in contrast to a collection of financial measures or all items’ measurement. By keeping this in mind and with a broad literature review, Segar and Grover (1998) have introduced four dimensions of alignment, cooperation, analysis, and capability improvement in which the first three are “goals” and the last one measures SISP improvement over time. Some researchers have defined another dimension entitled contribution (Doherty, et al., 1999). These dimensions and their descriptions are indicated in Table 2.
dĞĐŚŶŽůŽŐLJ
/^ƐƚƌĂƚĞŐLJ
ƵƐŝŶĞƐƐ ƐƚƌĂƚĞŐLJ
/^ƐƚƌĂƚĞŐLJ /^ƐƚƌĂƚĞŐLJ
ƵƐŝŶĞƐƐ ƐƚƌĂƚĞŐLJ
ƵƐŝŶĞƐƐ ƐƚƌĂƚĞŐLJ
/^ƐƚƌĂƚĞŐLJ
&ŝƚ KƌŐ
ĂƐƉĞĐƚƐ ^ƚĂŐĞϭ
dĞĐŚŶŝĐĂůʹĚƌŝǀĞŶ
^ƚĂŐĞϮ
ůŝŐŶŵĞŶƚ ŵŽĚĞ
^ƚĂŐĞϯ
/ŵƉĂĐƚŵŽĚĞ
^ƚĂŐĞϰ
Table 2. SISP Success Dimensions
Scale Explanation
Alignment IS and business strategy linkage to facilitate such IT/IS development and acquisition that is concordant with competitive requirements of the organization
Analysis Understanding the organization’s internal operations (e.g. procedures, processes, and technologies)
Cooperation SISP stakeholders cooperation to decrease potential conflict between them after general agreements
Improvement in
Capabilities Improving planning capabilities over time (e.g. by learning)
Contribution Contributing to various organizational attributes (e.g. decision making and profitability) Adapted from Segars and Grover (1999)
IS Capabilities and SISP Success Integration
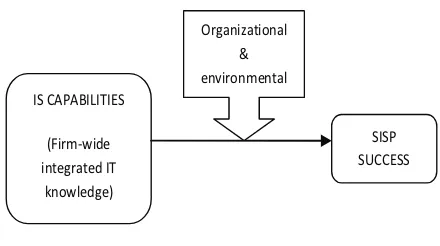
Despite the fact that SISP is a cornerstone of the information system discipline (Gable, 2010), very little attention has been given to its success based on the resource-based view of the firm (RBV) in strategic management field. Generally, literature mirrors significantly little effort to recommend a framework for understanding the relationship between “IS capabilities” and “SISP success” in particular. To be clearer, the question is what kind of skills and abilities, knowledge, and qualification or capacity is needed for organizations to have a successful plan for strategic information systems? And, what conditions affect this relationship? To fill this gap in the IS field, this paper aims to establish a conceptual model by providing a contingency model to investigate this relationship. The researchers believe that the aim to build a model for SISP success based on RBV perspective is important because this new perspective will be helpful for gaining a superior assessment and better understanding of SISP.
Figure 5. IS Capabilities, SISP Success, and Moderating Factors
Conclusion
Generally, capability has been interpreted to have the ability to influence organizational success. As an organizational construct, IS/IT capability is related to the ability of an organization to provide sustainable, competitive advantage in the IS field. IT capability is the ability to deliver a system, control IT costs, and affect objectives of the business with IT implementation. Conceptualizing the relationship between IS capabilities and SISP success and factors moderating this relationship was the aim of this study. In this research through the RBV perspective, this relationship has been investigated. Finally, because of possible inconsistency between those two variables (IS capabilities and SISP success), factors moderating this relationship were introduced based on a contingency model to address planning paradoxes.
Acknowledgment
We would like to thank Universiti Technologi Malaysia (UTM) and Ministry of Higher Education (MOHE) for their support.
References
Barney, J. (1991). Firm resources and sustainable competitive advantage. Journal of Management Decision, 17, 99-120.
Basu, V., Hartono, E., Lederer, A. L. & Sethi, V. (2002). The impact of organizational commitment, senior management involvement, and team involvement on strategic information systems planning. Information & Management, 39, 513-524.
Bharadwaj, A. S., Sambamurthy, V., & Zmud, R. W. (1999). IT capabilities: Theoretical perspectives and empirical operationalization. 20th International Conference on Information Systems. Atlanta, USA. Bharadwaj, A. S. (2000). A resource-based perspective on information technology and firm performance: An
empirical investigation. MIS Quarterly, 24, 169-196.
Bechor, T., Neumann, S., Zuiran, M., & Glezer, C. (2010). A contingency model for estimating success of strategic information systems planning. Information & Management, 47, 17-29.
Caldeira, M. (1998). Understanding the adoption and use of information systems/information technology in small and medium-sized manufacturing enterprises: A study in Portuguese industry. Unpublished PhD Thesis. Cranfield School of Management.
Caldeira, M., & Dhillon, G. (2010). Are we really competent? Assessing organizational ability in delivering IT benefits. Business Process Management Journal, 16, 5-28.
Ciborra, C. 1994. Toward a Fourth Era: An Organizational IS Capability 55 grassroots of IT and strategy. In: Ciborra, C. & Jelessi, T. (eds.) Strategic Information Systems: A European Perspective. Chichester, UK: John Wiley & Sons.
/^W/>/d/^
;&ŝƌŵͲǁŝĚĞ ŝŶƚĞŐƌĂƚĞĚ/d
ŬŶŽǁůĞĚŐĞͿ
^/^W ^h^^ KƌŐĂŶŝnjĂƚŝŽŶĂů
Θ ĞŶǀŝƌŽŶŵĞŶƚĂů
Delone, W. H., & Mclean, E. R. (1992). Information systems success: The quest for the dependent variable. Information Systems Research, 3, 60-95.
Demsetz, H. 1991. The Theory of the firm revisited. In Williamson, E., & Winter, S. (eds.) The Nature of the Firm. New York: Oxford University Press.
Doherty, N. F., Marples, C. G., & Suhaimi, A. (1999). The relative success of alternative approaches to strategic information systems planning: An empirical analysis. Journal of Strategic Information Systems, 8, 263-283.
Dvorak, R. E., Holen, E., Mark, D., & Meeha, W. F. (1997). Six principles of high-performance IT. The McKinsey Quarterly, 3, 164-177.
Feeny, D. F., Edwards, B., & Al, E. (1992). Understanding the CEO/CIO relationship. MIS Quarterly, 16, 435-449.
Gable, G. (2010). Strategic information systems research: An archival analysis. Journal of Strategic Information Systems, 19, 3-16.
Grant, R. M. (1996). Prospering in dynamically-competitive environments: Organizational capability as knowledge integration. Organization Science, 7, 375-387.
Hisham, B. M. B., & Mohd, D. N. (2009). The Effect of Strategic Alignment on Strategic Information System Planning (SISP) Success: An Exploratory Study in Public Universities in Malaysia. International Journal of Scientific Research in Education, 2, 76-87.
Kearns, G. S. (2006). The effect of top management support of SISP on strategic IS management: Insights from the US electric power industry. Omega, 34, 236–253.
Keen, P. G. W. (1993). Information technology and the management difference: A fusion map. IBM Systems Journal, 32, 17-39.
Kettinger,W., Grover, V., Guha, S., & Segars, A. H. (1994). Strategic information systems revisited: A study in sustainability and performance. MIS Quarterly, 18, 31-55.
King, W. (1995). Creating a strategic capabilities architecture. Information Systems Management 12. Lederer, A. L., & Salmela, H. (1996). Toward a theory of strategic information systems planning. Journal of
Strategic Information Systems, 5, 237-253.
Lederer, A. L., & Sethi, V. (1988). The implementation of strategic information system planning methodologies. MIS Quarterly, 12, 445-461.
Marchand, D. A., Kettinger, W. & Rollins, J. D. (2000). Information orientation: People, technology and bottom line. Sloan Management Review, Summer, 69-80.
Mata, F. J., Fuerst, W. L., & Barney, J. B. (1995). Information technology and sustained competitive advantage: A resource-based analysis. MIS Quarterly, 487–505.
Newkirk, H. E., Lederer, A. L., & Johnson, A. M. (2008). Rapid business and IT change: Drivers for strategic information systems planning? European Journal of Information Systems, 17, 198-218.
Peppard, J., & Ward, J. (2004). Beyond strategic information systems: Towards an IS capability. Journal of Strategic Information Systems, 167-194.
Powell, T. C., & Dent-Micallef, A. (1997). Information technology as competitive advantage: The role of human, business and technology resources. Strategic Management Journal, 18, 375-405.
Ross, J. W., Beath, C. M., & Goodhue, D. L. (1996). Develop long-term competitiveness through IT assets. Sloan Management Review, 38, 31-42.
Sabherwal, R., & Chan, Y. E. (2001). Alignment between business and IS strategies: A study of prospectors, analysers and defenders.Information Systems Research, 12(1), 11-33.
Segars, A. H., & Grover, V. (1998). Strategic information systems planning success: An investigation of the construct and its measurement. MIS Quarterly, 22, 139-163.
Segars, A. H., & Grover, V. (1999). Profiles of strategic information system planning. Information Systems Research, 10, 199-232.
Srinivasan, R., Lilien, G., & Rangaswarny, A. (2002). Technological Opportunism and Radical Technology Adoption: An Application to E-Business. Journal of Marketing, 66, 47-60.
Teo, T. S. H., & Ranganathan, C. (2003). Leveraging IT resources and capabilities at the housing and development board. Journal of Strategic Information Systems, 12, 229-249.
Ward, J., & Griffith, P. (1996). Strategic planning for information systems (2nd Edition). London; John Wiley & Son.
Ward, J., & Peppard, J. (2002). Strategic planning for information systems. Cranfield, Bedfordshire, UK: Cranfield School of Management.
Watson, R., Kelly, G., Galliers, R. D., & Brancheau, J. (1997). Key issues in information systems management: An international perspective. Journal of Management Information Systems, 13, 91-115.